![]()
![]()
![]()
![]()
![]()
![]()
![]()
![]()
![]()
![]()
|
|
|
| Weighting (The most significant impact potentials)In the previous section, the normalized
values express the contribution to the environmental impacts relative to an
average person’s contribution; it doesn’t shows the critical contribution.
For example, certain resources will be exhausted in a few decades at the present
rates of consumption. It should be noted that not all the environmental impacts
are equally critical. To assess which normalized resource consumptions and
environmental impact potentials figures (3.22), & (3.24), are judged
to be worst, it is necessary to apply the weightings on the hydraulic product
system. It should be noted that the weighting principle for the various impacts
are not the same in the EDIP method, the weighted impact potentials cannot be
compared across the two categories; for example, resource consumption cannot be
compared with environmental impact potentials. The weighting factors that are
used in the assessment are described in the EDIP book, volume 1 (Wenzel, et
al., 1997) and shown in table (F1.1) appendix F.
To
assess the potential impacts and their importance in the entire lifespan of the
hydraulic motor OMV/W-800, the environmental impact potentials and resource
consumptions have been weighted by multiplying the normalized values with
weighted factors based on actual Danish and
international political reduction targets for the year 2000 (for detailed
methodology, see previous chapter, section (2.4.4.2). The
results from the weightings criteria are illustrated in the following sections
and significant parameters have been described. Some impact categories and
consumptions do not have a visible bar on the graph, because of the low value,
though existing.
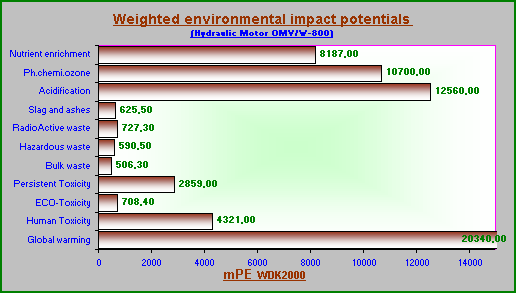
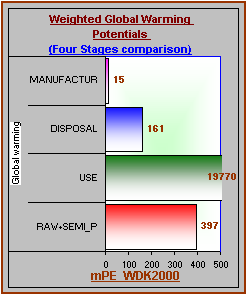
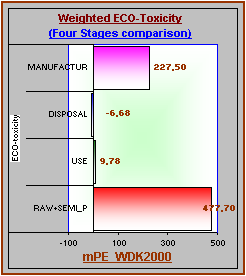
0.1.1.1 Weighting environmental impact potentialThe environmental impact potentials profile, figure (3.25)&(3.26), is weighted with the international reduction targets for the global impact categories and the national reduction targets for the regional and local categories. The unit is called a targeted milli-person-equivalent (mPEWDK2000), (reference year 2000.) On the basis of this criterion, it can be seen that the product contributed significantly to global warming, acidification, photochemical ozone creation, nutrient enrichment impact categories, human toxicity and persistent toxicity, which are discussed below. Rest of the categories are grouped and discussed also as below:
Figure
(3.25):
Weighted environmental impact potentials for the hydraulic motor OMV/W-800.
Figure
(3.22): Weighted
environmental impact potentials for the hydraulic motor OMV/W-800. Figure
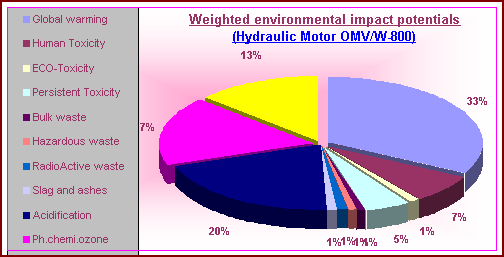
(3.26)
shows the % variant of all impact categories. The qualitative description on
each impact category is reported below:
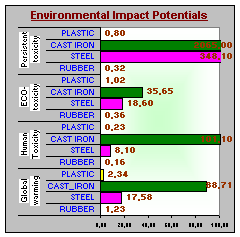
Figure
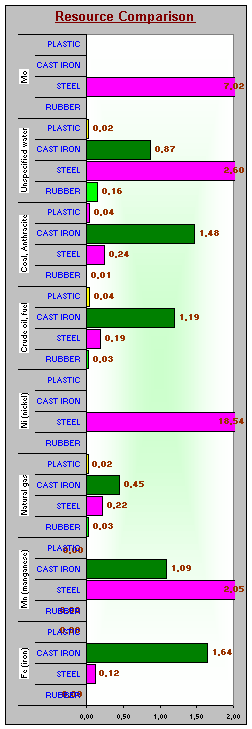
(3.27): The materials
(cast iron, steel, plastic and rubber) comparison on significant impacts
potentials in the hydraulic product system.
Figure
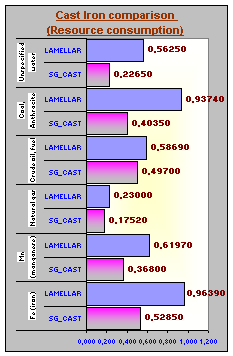
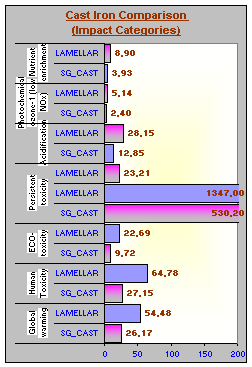
(3.28): Cast irons
(lamellar and SG- cast iron) comparison on significant impacts potential in the
hydraulic product system. 0.1.1.1.1 Global warmingAs
shown in figure (3.25), global warming is one of the significant impact
potentials in the hydraulic product system, which is obtained by multiplying the
normalized value by a weighting factor (1.3) based on actual Danish and
international political reduction targets for the year 2000. It should be noted
that a weighting factor of 1.3 means that the contribution in 1990 corresponds
to the reduction target set for the year 2000. Global warming is approx.
20340mPEWDK2000, the
contribution corresponds to 2034% of the maximum contribution, which an average
person should make in the year 2000. The value seems to be a very high value in
the product system. The figure (3.29) shows that global warming mainly
derives from the use stage of the hydraulic product amounting to 19770mPEWDK2000,
which is the main reason for large contributions to global warming impact
potentials in the hydraulic product system. The main parameter, which creates
large amounts of CO2, SO2, NOX, VOC and CH4
substances in the use stage, is energy consumption in the form of gasoline oil.
As mentioned in section (C.7.4), chapter 7,
appendix C, of the 25% energy reduction in the use stage almost 23.5%
affect the global warming category. The hydraulic product in its entire life
span The
raw materials and disposal stages also contribute to the global warming impact
category, amounting to 0.397 PEWDK2000 and 0.161 PEWDK2000, which
seem to be reasonable with respect to product weight. By performing a
sensitivity analysis on raw materials + semi-products in appendix A, chapter
5, section (A.5.4), the raw material preparation and production processes
are also found to contribute to the global warming impact category. By going a
step back in raw materials and processes, in the raw cast iron’s (sponge/pig)
manufacturing processes, electrodes ancillary
material and coal firing are found
to mainly contribute to global warming. The
large amount of hydraulic oil incineration also contributes to global warming in
the disposal stage. The manufacturing stage contributes but with a very low bar
on the graph, which is the cause of electricity consumption in the manufacturing
stage.
The above results demonstrate that the
energy consumption in the use stage, raw materials preparation processes in the
raw materials + semi products stage, oils incineration in the disposal stage are
the main parameters in the product system, which contribute significantly to
global warming. These parameters are included in the environmental diagnosis for
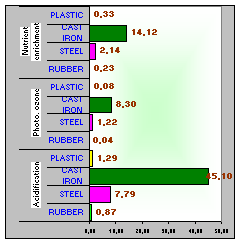
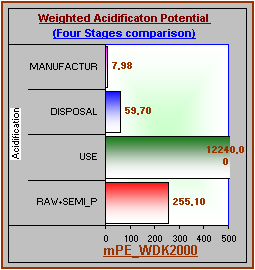
detail investigation and improvement, and discussion in the later section. 0.1.1.1.2 AcidificationFigure
(3.25) shows that
acidification is also a significant environmental impact potential in the
hydraulic product system, which is approx. 12240mPEWDK2000, i.e. the
hydraulic motor’s contribution corresponds to The
coal firing and raw materials preparations processes in the raw materials +
semi-products stage also contribute to the acidification category, amounting to
255mPEWDK2000. By investigating in detail the coal firing and raw
materials preparations processes found to contribute to acidification. In the
disposal stage acidification mainly derives from the hydraulic oil incineration
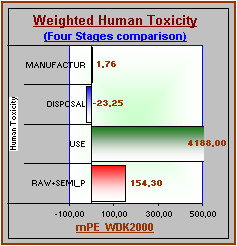
process. From the results presented above, the important parameters that affect the acidification impact potential category significantly, are energy consumption in the use stage, raw materials preparation processes in the raw materials + semi products stage, and oil incineration in the disposal stage. The above parameters are also very influential in regard to global warming. These parameters are further added in the later sections ‘environmental diagnosis’ and ‘discussion’ (the acidification category is very much related to global warming. The same substances contribute to acidification; therefore product improvement in global warming will also improve acidification results.) 0.1.1.1.3 Human ToxicityFigure
(3.25) shows that human toxicity is one of the most significant
environmental impact potentials in the hydraulic product system, which is
contributed to 4321mPEWDK2000, corresponded to 432% of the maximum
contribution an average person in the year 2000. The use stage of the hydraulic
product system is found to be a significant stage (see figure The
raw material + semi product stage of the hydraulic product system also
contributes to human toxicity, which is very small in comparison with the use
stage. As shown in figures (3.27 and 3.28), the
cast iron material mainly contributes to human toxicity. By going one step back
in the cast iron material, the ferromanganese and ferrosilicon manganese
materials are found to be significant in contribution to human toxicity with a
quantity of 56g of manganese emission to air per kg of cast iron production with
a factor EF(hta) 2.5.106 m3/g. The
manufacturing stage also contributes, but is insignificant in comparison with
other stages in the product. Please note that the human toxicity from the
ancillary substances is not included (calculated), which could make significant
changes in the manufacturing stage (discussed in the later section
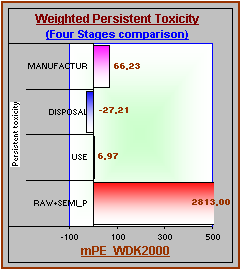
‘discussion’) 0.1.1.1.4 Persistent ToxicityIt
is surprising that the persistent toxicity is found to be a high priority in
toxicity impact potentials. The persistent toxicity contributes to 2859mPEWDK2000
i.e. the hydraulic motor’s contribution corresponds
to 289% of the maximum contribution which an average person should make in the
year 2000. It is clear from figure (3.32) that potentials for
persistent toxicity derive from the consumption of raw materials. As noted it
was unexpected and it was therefore investigated further. In figures
(3.27&3.28), the computation shows that the persistent toxicity derives
from the cast-iron and steel manufacturing processes. By
going a step further back in the computation it was clear that the persistent
toxicity contribution derived from the iron oxides and manganese contents in the
emission from the cast iron and steel works in question. As mentioned in the
precious section (3.1.2.2.2.1.6&7), reactions under high temperature
in cast iron and steel
raw materials preparation processes produce large quantities of iron oxide, The
manufacturing stage also contributes to persistent toxicity, this is due to the
ancillary substance emissions in the wastewater after use. The chronic
eco-toxicity from the various substances contributes further to persistent
toxicity in the manufacturing stage. See in detail the results on sensitivity
analysis in appendix
B chapter 5, section (5.4). From the above investigation, the raw material preparation processes in the raw material + semi-product stage and ancillary substances in the manufacturing stage parameters are aggregated to be significant in the persistent toxicity category, which are included in later sections ‘environmental diagnosis and discussion.’ 0.1.1.1.5
Eco-toxicity:
Eco-toxicity contributes to 709mPEWDK2000 person equivalent for the year 2000. In further made investigations on different stages of the hydraulic product system, the raw material + semi products and manufacturing stages are found to be significant stages in the hydraulic product system, which contribute to eco-toxicity significantly. As
discussed in appendix A, chapter 5, section (5.4), in the raw material +
semi products stage, the potential for eco toxicity derives from the consumption
of raw materials, not from electricity consumption and transport. It was
therefore investigated further on raw materials. In figures (3.27and 3.28),
the computation shows that the eco-toxicity derives from the cast-iron and steel
processes similar to persistent toxicity. By investigating in a detail, it was
clear that the eco-toxicity contribution derived from the iron oxides and
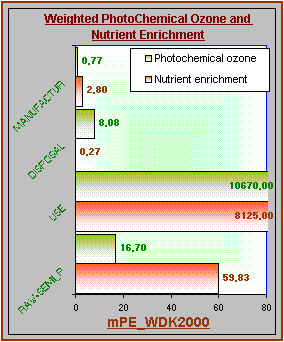
ancillary substances that are used to manufactured semi-products. The The manufacturing stage also contributes significantly to eco-toxicity, (see appendix B, section (B.5.3)). The used amount of ancillary substances in the manufacturing stage contributes to 97% in the manufacturing stage and 32% in the hydraulic product system. Regarding ancillary substances, some of the substances are incinerated after use (very low amounts) and most of them are emitted with wastewater and treated in a wastewater treatment plant near Nordborg. The substances that are emitted with wastewater have significant impacts on toxicity categories. Furthermore the (ancillary substances) oils products are aggregated, which contribute to eco-toxicity and the oil products containing manganese and molybdenum substances found to be significant in contribution to eco-toxicity in the manufacturing stage such as product (Bonder2), product (miscellaneous2), product (phos. Compound1) and product (phos. Compound2). The use stage also contributes but with a very low value, and is therefore not significant. From the above investigation, the raw material preparation processes in the raw material + semi-product stage and ancillary substances in the manufacturing stage parameters are aggregated to be significant in the eco-toxicity category, and are discussed with persistent toxicity in the later sections ‘environmental diagnosis and discussion.’ 0.1.1.1.6 Photochemical ozone creation and nutrient enrichmentThe environmental impacts potential profile, figure
(3.25) shows that the photochemical ozone creation and nutrient enrichment
impact potentials categories contribute
to 10700 mPEWDK2000
and 8187 mPRWDK2000
respectively, which are quite large values in the hydraulic product system.
As shown in figure (3.34), the use stage of the hydraulic motor
contributes 99,5% in average of the quantities of photochemical ozone creation
and nutrient enrichment in the
hydraulic product system. The
gasoline oil combustion in the diesel engine produces
the methane and the substances
containing N and P from as outputs, which contribute to photochemical ozone creation and
nutrient enrichment in
the use stage of the hydraulic motor (see in detail, appendix C, chapter 7,
section (7.4)).
Both
categories (photochemical ozone creation and nutriment enrichment)
categories are very much related to global warming and the cause of
similar parameters in the use stage, therefore discussed in the later sections
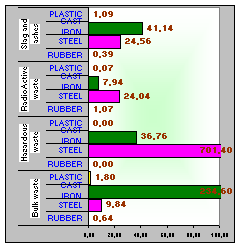
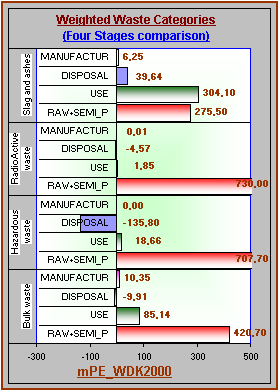
in same parameters. 0.1.1.1.7 Waste Categories:As shown in figure (3.25), the waste categories
do not seem to be important in the product system, but by removing energy
consumption in the use stage, the waste categories can be viewed as dominant
contributions to wastes impact potentials categories in the product system. With
this weighting, the profile shows that the hazardous waste category is dominant
in the waste categories. Furthermore the model is simulated on different stages
in order to find a clear picture of the product system the From
the above investigation, the raw material preparation processes in the raw
material + semi-product stage and oil combustion in the use stage parameters are
aggregated to be significant in contribution to waste impact potentials, which
are discussed briefly in the later sections ‘environmental diagnosis and
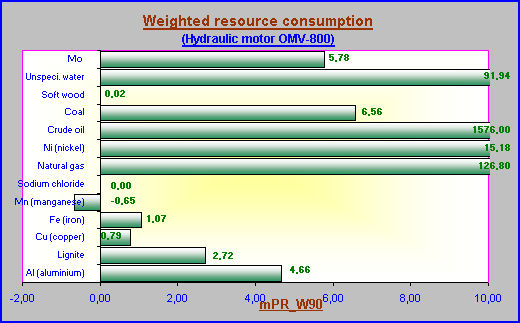
discussion.’ 0.1.1.2 Weighted resource profileThe resources profile is obtained by
weighting the normalized values relative to the size of known reserves (see
reserve list and supply horizon on resource in Appendix F, table (F1.1)).
The size of the reserves is dependent on time. In this study the reserve time is
chosen from the year 1990 (reference year) and the
unit of the weighted resource consumptions is in milli-Person Reserve (mPRw90)
defined, for the reference year 1990. The weighting of the resources expresses the
proportion of known reserves remaining in 1990 for the individual person and
his/her successors, i.e. the size of the reserves is set relative to the size of
the population in 1990. The weighting ranks the resource consumption on the basis of a “Scarce
resources” criterion, i.e. resources which are threatened by a short
supply horizon (depletion). A short supply horizon means that the known reserves
are only sufficient for a short period of time given the present extraction
rate. It can be argued that on the hydraulic product, resources that are burned to produce energy and other processes on raw material preparation should be weighted more highly than resources used for material. The resources, which are disposed with material in a landfill, can be recovered if this is ultimately desired. It should be noted that this weighting criterion is not included in present LCA and the energy production and other burned resources are not weighted higher than other resources, which are used in the material.
Figure (3.36): Weighted resource for the hydraulic motor OMV/W-800.
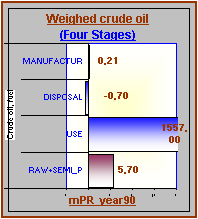
On the basis of the above criterion, the significant resources are aggregated from the resources profile shown in figure (3.36) and discussed below: 0.1.1.2.1 Crude oil:Crude
oil makes the greatest contribution in the resource profile as shown in figure
(3.36), with a value of this 1576mPR_year90 for the reference
year 1990. This corresponds to the hydraulic motor 1576 parts per thousand of
the entire quantity of crude oil available for one person, and all of his/her
successors for all time. It is quite a lot. The reason for the large weighted
contribution for crude oil is the higher consumption of materials and gasoline
oils consumption. In order to get
a view of the The
raw material + semi products stage
is also investigated by comparing (rubber, plastic, steel, and cast iron) used
materials, (shown in figures (3.27 and 3.28)) and the cast iron is found
to contributes to crude oil in the raw materials
+ semi products stage. By going a step back in cast iron manufacturing
processes data, the pig/sponge iron production contributes to crude oil
consumption, which is the cause of heating in the production processes and other
involved machinery and processes in the extraction and preparation of raw
materials. For example, gasoline oils are consumed by machinery and transport on
raw material refining and preparation, which contributes to crude oil in the
cast iron production. The other parameters also contribute in the raw materials
stages i.e. plastic and rubber production, but not significantly. The
manufacturing and disposal stages are insignificant stages, and therefore not
discussed. Crude oil consumption is found to be the cause of energy consumption in the use stage and raw material parameters, which are further included in the environment diagnosis and discussion in the later sections.
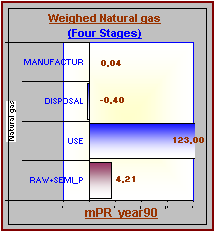
0.1.1.2.2 Natural gas:Natural
gas resource is one of the dominant resources in the product system, which
contributes to 126mPR_year90. In order to add it to the environmental
diagnosis discussion in the later section, it is important to know where the
contribution comes from. The model is simulated
stage-wise and by comparing the stages, the use stage is found to be a
significant stage in consumption of large amounts of natural gas, which
contribute to 97.6% in natural gas consumption similar to crude oil and 91%,
contributes to the hydraulic product system. The use stage is further
investigated by performing simulation on different parameters and gasoline oil
is found to be a significant parameter in the use stage. The 61.2 grams of
natural gas as a resource is used in the production of The
raw material + semi products stage also contributes to natural gas but not
significantly. The cast iron material, (shown in figure (3.24)) is found
to be a significant material which contributes to the natural gas consumption
due to the heating processes in production of pig/sponge iron, which further
effects steel results, because the raw cast iron is added in the primary steel
production as input material. The
manufacturing stage also shows a very low bar on the graph, amounting to 0.04
mPRW90, which is the cause of natural gas consumption in the hardening and
soldering of distributor plates. In the disposal stage, re-melting materials
(cast iron and steel) consumed natural gas for the heating process, which is why
the bar on the graph is in minus (-). 0.1.1.2.3
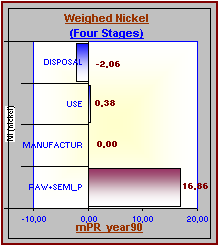
Nickel
Nickel also makes the greatest contribution in the metals resource profile, with a value of 15,18mPR_year90. The main reason for the large weighted contribution of nickel is the short supply horizon of nickel (50 years). As
shown in figure (3.39), the raw material + semi products stage
contributes 100% of the quantity of nickel in the product system. The reason
behind the 100% ranked (the amount shown in use stage) is also due to replaced
parts, which also pass through the raw materials + semi-products stage. By
comparing the materials (figures (3.27 and 3.28)), the steel material is
found to contribute to 100% of the quantity of nickel in the hydraulic product
system. Furthermore different qualities of steel are investigated by computation
and 18CrNi8 and X45Cr13 qualities of steels are found to contribute to the
consumption of nickel. The 0.1%
of nickel is credited in recycled materials in the disposal stage, which is
why the bar in figure (3.39) is so low in minus (-). From the above results, the high quality of steel in the raw materials + semi-products stage is found to be important in nickel resource consumption in the hydraulic product system, which is discussed with the “raw material” parameter in later sections. 0.1.1.2.4 Coal:The
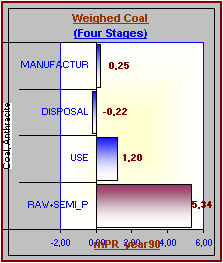
resource profile (figure (3.36)) shows that the coal resource also has a
visible consumption relative to the other resources. The hydraulic motor
OMV/W-800 accounts for over 0.6% of an average person’s average consumption of
coal worldwide in 1990, the reference year. The raw Resources
will be discussed in the raw material and energy consumption parameters in the
later sections ‘discussion and environmental diagnosis’ 0.1.1.2.5
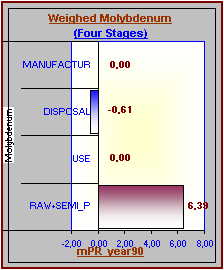
Molybdenum:
Molybdenum
is also a material-related resource. It also has
significant contribution in the resource profile, with a value of 5.77mPR_year90.
Note that in spite of the small quantity involved shown in the previous sections
(normalization profile), the molybdenum is ranked highly in the weighted profile
because of the small known reserves (4 kg/person) compared to the annual The use stage and manufacturing stages are insignificant stages with a 0.00% of contribution. 0.1% of molybdenum is ranked in the recycled product (renewed product) on the basis of the recycling company’s specific data, which is the reason behind the low bar in minus (-) in figure (3.41). In the other words, the disposal stage of the hydraulic product credited 10% of the quantity of molybdenum. The resource is important in consumption of scarce materials, therefore discussed in the later sections in raw material parameters in the ‘environmental diagnosis’ section. 0.1.1.2.6
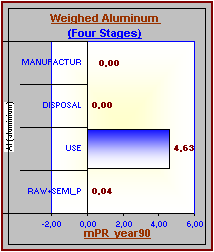
Aluminum:
On the basis of weighting criteria,
aluminum also has a visible bar on the graph as shown in figure (3.36).
The use stage is found to affect the results in the consumption of aluminum. It
is clear from figure (7.6), chapter 7, appendix C, that the aluminum is
consumed by energy in the form of
oil combustion in the diesel engine in the use stage. This was unexpected; The raw materials+ semi-product stage also contributes, but with a very low bar. This is because of nameplate material in the material stage. Manufacturing and disposal stages are insignificant stages. Resource consumption in the hydraulic product system is found to be the cause of energy consumption in the use stage. The energy consumption is already added in the later sections therefore by improving the energy consumption in the product system, aluminum resource consumption will reduce. No special reason is found behind the contribution to aluminum consumption, therefore it is not separately included in the later sections. 0.1.1.2.7
Lignite:
Lignite consumption is found in the production of raw material. The pig/sponge iron manufacturing processes contribute to the magnitude of lignite in the hydraulic product system. 0.1.1.2.8
Fe
(iron):
This is due to the consumption of cast iron and steel materials in the product system and therefore not investigated. The environmental diagnosis on materials such as cast iron and steel, will affect the Fe (iron) resources in the product system.
0.1.1.2.9
Copper:
The copper consumption is due to the raw material in the hydraulic product. The steel qualities such as X45Cr13 (0.3%), 100Cr6 (0.25%) and 20CrMo5 (0.25%) contain copper resource in the products. The copper (14 grams) is used to solder the distributor, which is the cause of copper consumption in the product system. It should be noted that the high amount of copper content in the steel product, downgrades (impairs) steel quality, therefore 0.00% copper is ranked in metals recovery. 0.1.1.2.10
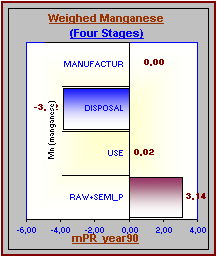
Manganese:
Manganese
consumption in the product is one of the significant impact potentials.
Manganese consumption in the product is material-related resource
consumption. By going a step back in the raw materials data, the manganese is
also used in the all cast irons and steels products, which are included in the
LCA. For example, manganese is included in the pig/sponge cast iron in the form
of ferromanganese and ferrosilicon manganese. Furthermore The manganese content in the recycled material is ranked on the basis of company recycling data (see appendix D, table (D1.4)) and more manganese is added, therefore graph bar is in minus (-). This means that almost 100% manganese is credited after use. The use stage contributes, but with a very low bar on the graph, which is due to the replaced material included in the use stage. The manufacturing stage is an insignificant stage with a 0.00% contribution. This
resource is 100% credited, therefore it is not significant in resource
consumption. But it is a material related resource. The raw material is already
added in the later sections therefore by improving raw materials in the product
system, manganese resource consumption will reduce. No special parameter is
found to be contributing to manganese consumption; therefore it is not discussed
separately in the later sections. | ||||||||||
Send mail to [email protected] with
questions or comments about this web site.
|