gis 520 portfolio
advanced geospatial analysis - spring 2014

Editorial Staff:
Steven Mohr - [email protected]
RALEIGH, THURSDAY, APRIL 24, 2014
"All the News
That's Fit to Print"
Suitability Analysis and Weighted Overlay
Problem
In this scenario, the Great Smoky Mountain National Park is having an issue with visitors and bears interacting. The park staff makes an attempt to put a distance between the two parties, but they always seem to find each other again. The park would like to contract an analyst to find the best locations to place the bears in which they will be segregated from visiting tourists. By doing this, bears will be more likely to stay in the habitat they are placed and visitors will be less likely to come across these areas.
Analysis Procedures
Strategies: To perform the needed analysis, the analyst will use ArcMap and a few important shapefiles that detail the ecology, infrastructure, and topology of this area. In addition, the analyst needs to know the favorability the bears have to some of these pieces of information, and for other information pieces, we need to know the best distances to place the bears from them. In order to know the proper methods and understand the best ways to proceed in this analysis, useful information sources by ESRI include: Understand Overlay Analysis, How Weighted Overlay Works, and Weighted Overlay.
Methods: There are a number of tools to use in this analysis. The analyst will use tools to find the distance, to turn vector files into raster, to reclassify shapefiles in order to bring graduated scales of multiple files together, and to classify weight in order to turn those reclassified shapefiles into one raster while inserting an overlaid gradation of the files.
(Note: See Model Below for Workflow Diagram)
Application & Reflection
Problem description: This process of dealing with weighting various factors in order to find the best location to place something is a useful application of GIS software. This is one of the processes that have made GIS a very important resource in running all levels of government. For instance, when deciding where to establish various amenities such as a city zoo, it is important to find the best location for this.
Data needed: To perform this analysis, the city’s analyst would need certain files describing the state. They would need shapefiles where other zoos in the state are because if there is a zoo in a close by city, they will either have to scrap the project all together or find ways to make this zoo different or better. They will need to know the demographics and population of their city sectors, the road structure, the open spaces within the city, and multiple other factors that help the analyst to find the best location for such an expensive project.
Analysis procedures: To do this, the analyst would perform particular procedures needed per file to bring them to the point where they are ready to be reclassified and merged. The analyst would them reclassify these files to make their scales alike. After that, the analyst would merge them using the Weighted Overlay tool. This would allow these files to be brought together while at the same time ranked so that the ones that have the most importance are given the most attention in the ranking. The subsequent raster would provide a graphical look at the best places to build this city zoo.
Additional Assignment Reflection
Often in an analysis it is important for the user to have certain biases allowing the user to rank factors contributing to an analysis by the importance placed on it by the user. In these situations, tools such as the Weighted Overlay tool are very useful. Statistically, it can be dangerous to use ranking numbers placed subjectively, but in certain analyses, such as the one done in this assignment, it is a time saving procedure to place these analyst decided levels. All data is retained and can be displayed at any time. The only difference is that this data is graphically ranked into levels that must eventually be decided for a successful analysis. This is a change for me because I generally assumed it’s never part of a statistical procedure to use my own judgment when ranking items. This assignment has helped me see the uses of this more clearly.
Results


This screen shot shows the Reclassify tool.
This screen shot shows the Model used to process this analysis.
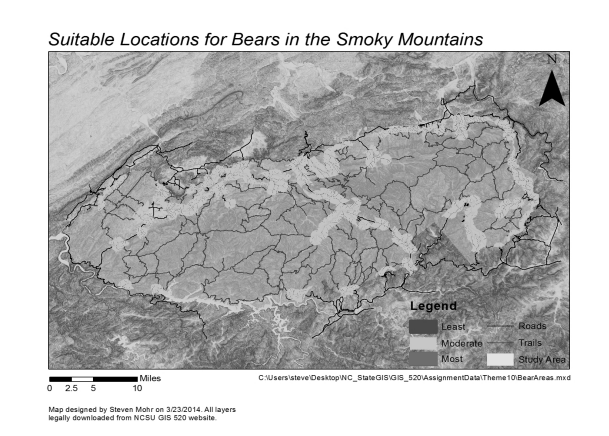

This screen shot shows the most suitable places to locate bears within the Smoky Mountain National Park.
This screen shot shows the Weighted Overlay tool.
World News

Local Traffic

Environmental News

Regional Weather
