gis 520 portfolio
advanced geospatial analysis - spring 2014

Editorial Staff:
Steven Mohr - [email protected]
RALEIGH, THURSDAY, APRIL 24, 2014
"All the News
That's Fit to Print"
Census Data
Problem
In this assignment, it was my job to develop a geodatabase that contained a number of specific feature classes. This database would be used for the future management of campus buildings and related facilities. The biggest challenge in this was that the files I was given to construct this database were CAD files, a system of files used by a different package of software. That means these Masterplan files were not georeferenced and could be in very different displays once imported into ArcMaps.
Analysis Procedures
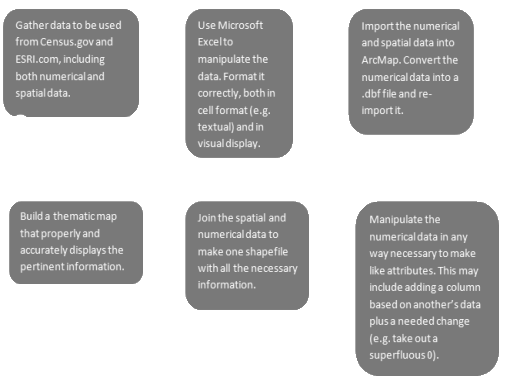
Strategies: In order to put together this thematic map, I needed to get the right information from reliable sources. I was able to get spreadsheet data files with the proper numbers I needed from the US Census organizations American Factfinder site. For the year 2000 data, I got the shapefiles from ESRI’s website, but for the 2010 data, those same shapefiles were held by another section the US Census organizations site, Census.gov. To understand the procedure used to find this information, the professor included a step by step example guide PDF. This was useful in understanding the process and allowing me to use what I learned to design my own search. Finally, using Microsoft Excel and ArcMap, this data gathered can be implemented and used to build a proper thematic map.
Methods: This assignment called for a greater time investment in research. Through maneuvering and manipulating the Census.gov sites and the ESRI.com site, there was information that could be tailored to fit my search better before it even got to my own software. Once there, however, there is more to be done to make sure the information displayed in the thematic map I built was both accurate and useful.
Application & Reflection
Problem description: This is a procedure that is used every day by some analyst out there for some type of marketing or tabulation purpose. One possible use is to see the age groups within a particular area using the census tracts. This age census could be used to find and present to a company the best possible locations to put in a new retirement home.
Data needed: To perform this inquiry, the analyst would need data about the population that included ages, present housing statuses, locations of other current retirement homes, and various other pieces of data that could be used to build a solid picture.
Analysis procedures: After that, this numerical data would have to be manipulated to be within the proper cell structure and would have to be joined into a larger spatial database. This database would be used to display the information visually in an understandable way.
Additional Assignment Reflection
Whether government or private sector, there are many organizations out there that collect data to be used for various purposes. Often, however, a good analysis takes the usage of multiple sets of data: various tables. For this, it is important to combine them. ArcMap provides tools that can find the common factors and use them to combine as many pieces of data as possible. I am always amazed at how many tools I see in GIS that can save organizations thousands and thousands of dollars. Census data (and most survey data) is very costly to produce. To be able to use this data for multiple purposes (thanks to the combining/tailoring process) instead of resurveying every time data is needed is a great help to the organizations that use it.
Results


This screen shot shows the number of properties in Wake County valued between $250,000 and $299,000.
This screen shot shows a spatial Join, brining spatial and numerical data together.

This screen shot shows the Excel file containing all the numerical data used in the project.
World News

Local Traffic

Environmental News

Regional Weather
