gis 520 portfolio
advanced geospatial analysis - spring 2014

Editorial Staff:
Steven Mohr - [email protected]
RALEIGH, THURSDAY, APRIL 24, 2014
"All the News
That's Fit to Print"
Turning Data into Information
Problem
In this ESRI Virtual Campus course we are presented with the thesis that data has its limitations and uncertainty is inherent throughout all GIS technologies and analyses. This course attempts to provide examples of these limitations and uncertainties in the form of exercises that detail many of the possible deficits of GIS and the ways in which GIS scientists are able to move past or minimize these deficits.
Analysis Procedures
Strategies: This is one of the many useful courses provided by ESRI to teach a portion of the great breadth of knowledge that ArcGIS comprises. In this course, we learned various ways to decrease uncertainties through the use of particular geoprocessing tools and correctly analyzing the results. The first module teaches how to spatially sample and display our maps through the use of interpolation tools and graphic effects. In doing this, the analyst can take a set of numbers that make little sense by themselves and interpret them graphically and statistically within ArcMap.
Methods: Using various statistical tools, in this assignment, we built multiple analyses that predict surfaces based on interpolations sampled throughout the landscape. There are multiple tools to use in this interpolation. The analyst’s choice of tool will be based on the particular situation.
Application & Reflection
Problem description: In this ESRI course, we were taught about the aspects of GIS and mapmaking that are inexact and uncertain. We were taught how to compensate for these imprecise aspects to GIS technology through specific procedures. This concept can be applied at my job in the Raleigh city government in regards to district zoning. This procedure requires a good idea of what property types a particular area of the city is mostly made up of. However, through sampling methods, this can often be off its estimation.
Data needed: Development ordinance, property data, boundaries data, and a confusion matrix
Analysis procedures: Take an estimation of city property data and compare it to a more precise measurement of property data and perform the proper steps involved in the confusion matrix. Calculate the kappa index. All of this could show how often this data was wrong and how often classifications occurred by chance.
Additional Assignment Reflection
One aspect of GIS technology—and ArcMap in general—that always impresses me is the ease in which major statistical analyses can be done and displayed. These tools can take random samples and through interpolation build a map of probabilities in seconds that would have taken thousands of calculations and unthinkable time in just decades past. However, these are only probabilities. There are a few different versions of interpolation that help to tailor them to any particular analysis in the best way, but they are still just probabilities. There is no guarantee that if one location is tested, it will have the exact characteristics this process hypothesized for it. That being said, in learning about these tools more, I can better see the usefulness it has for working with large amounts of data. Data that, in order to be economically feasible, must be paired down and sampled.
Results


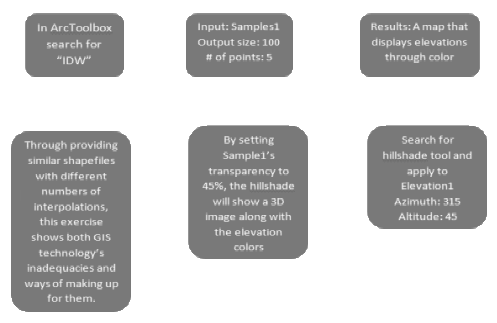
This screen shot represents the interpolation using IDW.
This screen shot represents the process of using aspect, slope, and elevation to find the best place for a new vineyard.
World News

Local Traffic

Environmental News

Regional Weather
