gis 520 portfolio
advanced geospatial analysis - spring 2014

Editorial Staff:
Steven Mohr - [email protected]
RALEIGH, THURSDAY, APRIL 24, 2014
"All the News
That's Fit to Print"
Spatial Statistics
Problem
In this project, the Fort Worth Fire Department has asked my help to analyze certain spatial data they have. The department feels that their EMS calls for an area known as Battalion 2 tend to cluster. They would like to know where these cluster zones are (should they be a reality) so that they can station their Emergency Intensive Care Units in the best locations, locations that provide the quickest and most effective response.
Analysis Procedures
Strategies: In order to perform the correct analyses and provide the information this fire department seeks, there are several tools that can be used within the Spatial Statistics area of ArcGIS technology. This information is shown through the Chapter 8 GIS Tutorial Guide and the ESRI Spatial Statistics Webinar: Introduction to Spatial Pattern Analysis. The first tool to use is Average Nearest Neighbor. This tool can be used to calculate the distance from each feature to its nearest neighbor. Another tool to use is the Calculate Distance Band from Neighbor Count to find the minimum, average, and maximum distance at which each feature can find results for whatever neighbor count number is sought. The High/Low Clustering tool shows the percentage of clustering at various distances. The Multidistance Spatial Cluster Analysis tool allows you to tabulate and graph the distances of the clustering. Tables will be joined in this project. And finally the Spatial Autocorrelation tool will be used to see the values associated with grid cells in these joined tables.
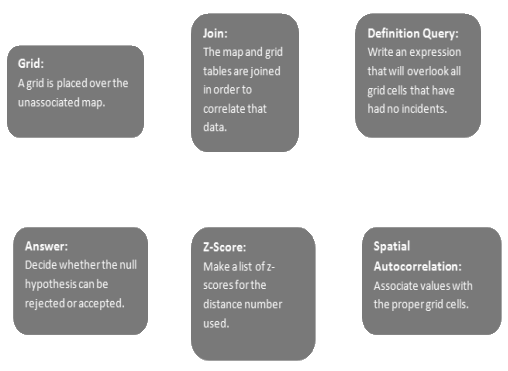
Methods: There were several tutorials in this project. The one that I will show here is the one involving Measuring Spatial Autocorrelation. In this process, the Moran’s I function is designed to find clustering using the attribute values as well as locations of features. This process involves relating tables through joins in order to relate incident locations with a particular grid.
Application & Reflection
Problem description: There could be a situation within a city where the police look for the most strategic places to patrol and they want a GIS analyst to find the most statistically important places to be. To do this, they would need to know where the clusters of reported crime are.
Data needed: To perform this analysis, I would need data on all the crimes within the past few years, street and district boundary data, and data regarding where current patrol routes are centered.
Analysis procedures: There are various tools to use to lead up to this, but most important tool to use in this analysis procedure is the High/Low Clustering tool. This will show the percentage of clustering at various distances. These distances can be changed, checked, rechecked. The analyst can place the distance and z-score information into a table to see at which distance the clustering is happening. This would help police to know where these clusters are and how large they are. By knowing the size, they are better able to set up a proper patrol route.
Additional Assignment Reflection
When outsiders look into the professional world of GIS, often they only see maps and cartographers. While this is an important part of the field, it is neither all of it nor most of it. In my experience with GIS, the most important part to me seems to be the statistics aspect. Statistics is a very math intense and concentration dense field. GIS tools such as those seen in this assignment provide a way for analysts to both build these put together a heavily mathematical analysis into an easily readable graphical display. That GIS function by itself makes this field extremely valuable, and this assignment shines a degree of light on that fact. This continues to add to my knowledge of what GIS can do.
Results


This screen shot shows the map layout with a Ripley's K Function graph.
This screen shot shows the graph of the Difference field.


This screen shot shows the bellcurve created through Spatial Statistics tools.
This screen shot shows the Join done between the grid and the spatial table.
World News

Local Traffic

Environmental News

Regional Weather
