gis 520 portfolio
advanced geospatial analysis - spring 2014

Editorial Staff:
Steven Mohr - [email protected]
RALEIGH, THURSDAY, APRIL 24, 2014
"All the News
That's Fit to Print"
Using Raster Data for Site Selection
Problem
GIS tools are often used to provide information regarding where things are in order to provide the needed information for some type of analysis. Other times, however, instead of analyzing based on where things are, we need to build a hypothesis based on where things should be. This means that we have to use statistics and good guesses bases on these statistics. There are a number of tools in GIS that can build graphical pictures based on the imputed statistical numbers. These can then be used by the GIS user to analyze and make educated guesses as to where things should be or should go.
Analysis Procedures
Strategies: A good source of information on this topic is the ESRI website, where the user can take a webcourse on the use of raster data for site selection. Here, the user will be taught methods in which they will use ArcMap tools such as Aspect, Slope, Euclidean Distance, Reclassify, Weighted Overlay, Fuzzy Overlay, and Fuzzy Membership to compile their data and find the most likely locations for whatever they seek.
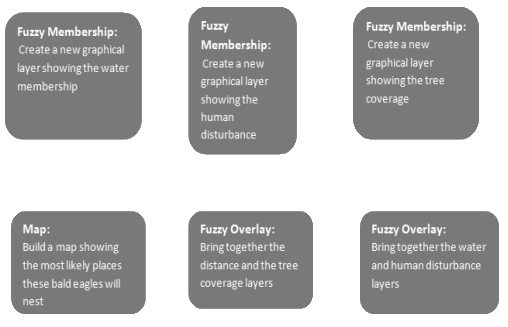
Methods: In an analysis where the user needs to figure out the most likely place something will be but there are exact numbers to work with (these numbers can be high one moment and low the other) Fuzzy Logic tools are the best to work with. For instance, in the following situation we are looking for possible nesting places of Bald Eagles. Each use of the Fuzzy Membership tool can be tailored to fit the particular search.
Application & Reflection
Problem description: It would be possible to use the weighted analyses when looking for the best place to place a new concert hall. In this situation, the entrepreneur who is looking to make this concert hall into a reality would need to know a lot about various areas in the city to find the best location to place this hall. It would be best for this entrepreneur to ask the assistance of a GIS firm with the capabilities of putting together several pieces of information and providing a sensible weight to them.
Data needed: To perform this analysis, the GIS analyst would need certain data. This data would include graphical files showing where other concert halls are located, files showing where this particular audience lives (a file showing the demographics of age, income level, and education level), a file showing possible venues to buy or properties to build on, and a file showing transportation access.
Analysis procedures: I would use analysis tools such as Euclidean Distance to provide graphical statistics on the best areas to use, and I would coordinate their levels using the Reclassify tool. Finally, I would provide a sensible weight to each of these shapefiles using the Weighted Overlay tool. This would provide a visual display of the best places to build this new concert venue.
Additional Assignment Reflection
Any analyst who works with statistics knows the usefulness and importance of exact numbers to be used in the production of an analysis. Often, however, those exact numbers simply don’t exist. For these situations, the Fuzzy Membership and Fuzzy Overlay tools are very useful. They can build an analysis that uses approximate inputs to develop an approximate output. This output will give the best guess statistics can show and do so in a graphical display that can be made into a comprehensible map. Before using this tool, I had never seen (or noticed) any statistical software that allowed me to
Results


This screen shot shows the Weighted Overlay tool.
This screen shot shows the solar radiation of the Vineyard.mxd.


This screen shot shows the most likely places bald eagles will live based on Fuzzy Logic.
This screen shot shows the Aspect tool.
World News

Local Traffic

Environmental News

Regional Weather
