gis 520 portfolio
advanced geospatial analysis - spring 2014

Editorial Staff:
Steven Mohr - [email protected]
RALEIGH, THURSDAY, APRIL 24, 2014
"All the News
That's Fit to Print"
Database Cardinality
Problem
In this assignment, I was contracted to use a set of data to find the number of jobs created within each voting district for the North Carolina House of Representatives and the North Carolina Senate. After using the proper methods to find this data, I was then expected to use the data to make two maps that could visually display this data. By doing so, not only would this data have more tangibility but it would also be easier for the politicians to readily see the increases in jobs their neighboring district was able to garner.
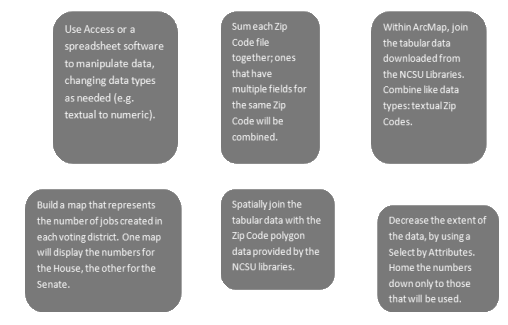
Analysis Procedures
Strategies: In this project, I had to use various tabular data to perform certain transformation. In order to understand the background of this project, a useful literature and visual tool is ESRI’s Relationships and Related Objects chapter for ArcGIS Help 10.1. In this chapter, the reader learns about Data Cardinality, its applications, and ways to manipulate it. Software that can be used to manipulate tabular data includes Microsoft Access, Excel, ArcMaps, and many others.
Methods: In this type of project, the most important procedures are those involving manipulating data types to make them usable and performing tabular and spatial joins to bring information together in a way that allows both to be more pertinent to the project. Through the use of these and proper map making techniques, an analyst can represent materials from many disparate sources into one readable display.
Application & Reflection
Problem description: Joining various forms of data in order to build a bigger, more useful database of information can be applied in nearly countless ways. This concept is very useful for marketing companies that have gathered information from a number of databases but want to put this information together to build one large database where they can describe their customers. For instance, this may happen if Amazon bought out a smaller retail company and needed to bring its customers into the spreadsheets of the larger company.
Data needed: This situation with Amazon would require the company to have all the metadata it can have on these customers. It would then need like fields that could be the bridge to bring these different databases together.
Analysis procedures: This would first require the data to be stored in the same fashion (e.g. Textual data, Numerical data, etc.). Then it would require the analyst to look for duplicate entries (if Amazon and this smaller company had the same client) and find ways to combine them.
Additional Assignment Reflection
The more I use ArcMap and other GIS software the more I see the real life applicability it has for government and private sector organizations. Being able to use graphically display information that would normally just be a line of text within a table. While the numbers in these two displays are the exact same, the usage is very different. In order to really be able to interpret data and see it in a realistic tone, it needs to be displayed in an intuitive way with graphics and other labels that allow the people to fully grasp the data.
Results


This screen shot shows a spatial Join, brining spatial and numerical data together.
This screen shot shows a Select by Attributes where the data is being limited just to what is needed for the project.


This screen shot shows the jobs created in North Carolina by Senate districts.
This screen shot shows the jobs created in North Carolina by House districts.
World News

Local Traffic

Environmental News

Regional Weather
