Trade with an Edge
Harmonic Gartley Pattern
The Gartley pattern was first discovered by H.M.Gartley and described in his book "Profits in the Stock Market" in 1935. The book sold for $1500 - and had a limited distribution. It is sometimes called the Gartley "222" pattern - due to the page number of his book that it appears in.
Gartley didn't use Fibonacci ratios in those days, but instead used 1/3 and 2/3 ratios. Larry Pesavento and Scott Carney appear to be attributed with assigning Fibonacci ratios to the Gartley, with Scott Carney defining precise measurements for it.Along with the Bat Pattern, the Gartley is a Retracement pattern. That means the X point has some significance. Namely, the X-point can be a significant Support/Resistance (Demand/Supply) level - and also the pattern is invalidated if the D point exceeds the X point.
Gartley claimed that for over 30 years this pattern was profitable in 7 out of 10 cases.
This has been supported by systematic tests conducted by FxGroundworks recently, which show pattern success rates of around 90%
Harmonic Gartley Pattern Structure
 Bearish Gartley - and - Bullish Gartley
Key features to watch out for:
- Must have an AB=CD pattern that converges in the same area as the .786 Fibonacci on the XA, and also the 1.27 or 1.618 BC
- Pattern Symmetry - ideally the number of bars in the AB leg should be the same as the number of bars on the CD leg.
- The B point retracement ideally at .618 of the XA leg.
Generally, Fibonacci retracement ratios for the B point are .382 (for a small small correction), .618 (the preferred retracement) and .786 (large correction).
However, Scott Carney specifies that the precise XA retracements (Fibonacci retracement level from X to A) should be .618 to point B, and .786 to point D, for the most reliable results. As illustrated in the above picture.
***z-get-startedCarney-guide.shtml***Harmonic Gartley Pattern Trading Tips
The nice thing about the Gartley is that you don't need to try to identify the top or bottom of a trend.
That's because the Gartley is used to trade tests of highs and lows in the direction of a trend. So the ideal place to find a Gartley pattern is in a bullish or bearish channel.
When not to trade a Gartley
I never trade Gartley's if they are not in a channel. And also, I very rarely trade a Gartley pattern if it is the first one in a channel.
I prefer to let the channel trend get established with 3 or more touch points off the top and bottom trend lines of the channel first. (That's just in case it's a false start and not really the start of a trend).
And, of course, I would not trade a bearish Gartley in a bullish channel - that just would not make sense at all.
Example Gartley
In the example below the channel has already been established with at least 3 touch points.
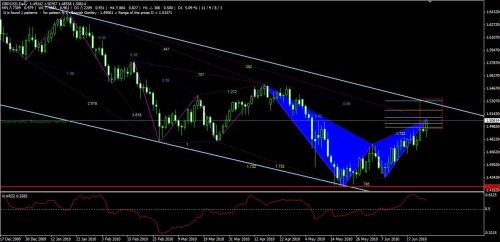 Bearish Gartley example
Pattern Failure
If the pattern fails, i.e. when price continues through the PRZ, it may push through Resistance at the X-level - in which case a new pattern is a possibility.Be sure to watch out for another pattern to form - such as a Crab Pattern with the D point at a new Support/Resistance level.
After all, a failed Gartley pattern is an opportunity for another pattern to develop.
Further readng on harmonic patterns.
The following pages have further details on harmonic patterns.
Harmonics Basics
- Trade with an Edge
- How Harmonics Work
- High Probability Trading
- Low Risk Trading
- Trading Leverage
- Trade Identification
- Scaling Into a Trade
- Trade Management


Trading Resources
Money Management
Learn how Adaptive Position Sizing can grow your account balance - exponentially.
Cash rebates on your trades.

Real-time harmonic alerts to pc and email. Free harmonics education videos and harmonic software. Harmonic traders chat room.

Certified Harmonic Training Webinar Series
Certified Harmonic Trading Educational Webinar Series
Over 15 hours of educational lessons narrated and presented by the originator of Harmonic Trading, Scott Carney.
Money Management
I use ForexSmartTools to run my forex trading business. Watch the video - see how they work

Further Reading
 Good Books for Harmonic Traders
![]()
Copyright © 2009-2010 Trade-Forex-Harmonic-Patterns.com. All rights reserved.