Trade with an Edge
Harmonic Butterfly Pattern
The Harmonic Butterfly Pattern is an extension harmonic pattern (that is - the D point exceeds the X point) and is used to trade highs and lows at key reversal points.
As an extension pattern, the CD leg extends towards a 1.272 to 1.618 Fibonacci extension of the XA leg. Note, that Fibonacci extension can even be as far as 2.618 - but beyond that then the pattern is invalid.
Systematic tests by FxGroundworks show Butterfly pattern success rates to be 87.4%-89.79%.
Harmonic Butterfly Pattern Structure
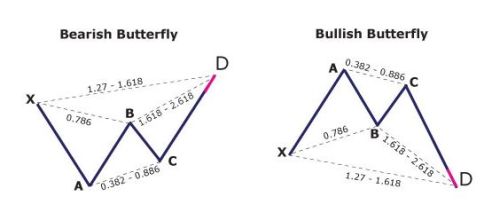
- B point must be a .786 Fibonacci extension of the XA leg
- D point should ideally be a 1.27 Fibonacci extension of the XA leg (for an early reversal ) or a 1.618. Scott Carney maintains the most critical number is the 1.27 XA leg.
- D point must not exceed the 2.618 extension of the XA leg.
- The Butterfly pattern must contain an AB=CD
Get Started with Harmonics. After you've browsed through these pages and got to know more about harmonic trading, you'll probably feel like giving them a try. Just go to "Get Started with Harmonics" for a step-by-step guide. It tells you precisely what to do - and how to do it, so you don't waste any time setting up and getting started.
Harmonic Butterfly Pattern Trading Tips
 Bullish Butterfly example
The great thing about this pattern is that, because it indicates a high probability of a reversal at the end of a trend, you can get into a new trend much earlier than most other traders.
In fact it's quite likely that most other traders will still be trading the continuation in the CD direction, while you are taking a "contrarian" view, and taking the opposite trade.
The key thing to bear in mind about the harmonic butterfly pattern is when it fails, it can fail quite dramatically in a continuation of the trend in the CD direction. So careful risk management in terms of a tight stop-loss is required.
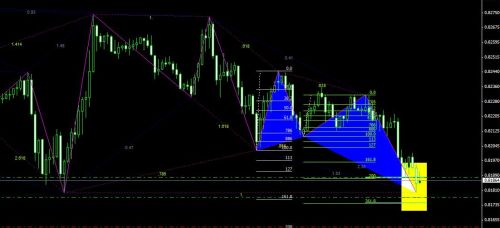
Here is a good example why a close Stop-Loss is absolutely necessary. This is a bullish butterfly pattern on the Eur-Gbp 30M chart. Price has just touched a Support zone at 0.8180.
The 1.618 XA leg is at the same level - and the 2.628 of the BC leg is just a few pips lower.
This is how I traded it:
- Entry at 0.8183
- Stop at 0.8163 - 20 pips away - placing it below the Support (0.8180), and 8 pips below the bottom of the PRZ. This is also below the 1.618 XA extension of the leg and the 2.618 Fibonacci extension of the BC leg.
- Target at 0.8230
This gives a risk/reward ratio of just over 1:3 (risking $1 to make $3).
 Bearish Gartley example
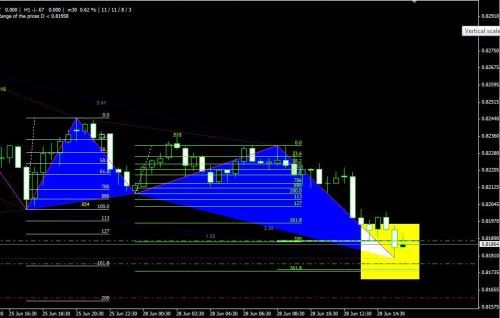
As the Butterfly is a test of an end of a trend, it's important to notice the momentum of price action on the CD leg, and watch out for strong momentum that could push through the PRZ and make the pattern invalid.
How the CD leg develops sometimes gives us a clue. If the CD leg is steeper than the AB leg, then a 1.618 XA extension is more likely than a 1.27 XA extension. Similarly, if there is a gap or unusually long candles in the CD leg we can also expect a 1.618 of the XA leg.
Generally speaking I only trade a harmonic butterfly pattern if there is a significant Support or Resistance zone near to the 1.27 or 1.618 Fibonacci XA extensions that I can use for placing a Stop.
Taking note of Price Action momentum and any close by Support/Resistance areas will help determine if we are dealing with a 1.27 extension of the XA leg or a 1.618 extension.
I don't trade a harmonic butterfly pattern if price is already past the 1.618 XA extension. If that happens it's likely to be a continuation of the trend in the CD direction, and therefore a reduced probability of a reversal.
I recommend the following pages for further details on harmonic patterns.
Harmonics Basics
- Trade with an Edge
- How Harmonics Work
- High Probability Trading
- Low Risk Trading
- Trading Leverage
- Trade Identification
- Scaling Into a Trade
- Trade Management


Trading Resources
Money Management
Learn how Adaptive Position Sizing can grow your account balance - exponentially.
Cash rebates on your trades.

Real-time harmonic alerts to pc and email. Free harmonics education videos and harmonic software. Harmonic traders chat room.

Certified Harmonic Training Webinar Series
Certified Harmonic Trading Educational Webinar Series
Over 15 hours of educational lessons narrated and presented by the originator of Harmonic Trading, Scott Carney.
Money Management
I use ForexSmartTools to run my forex trading business. Watch the video - see how they work

Further Reading
 Good Books for Harmonic Traders
![]()
Copyright © 2009-2010 Trade-Forex-Harmonic-Patterns.com. All rights reserved.