 |
 |
|
|
|
|
|
|
|
| <<Home | Lab 8 (Analyzing and Enhancing Images) | |||
|
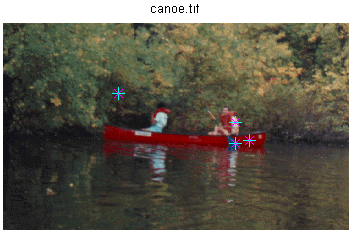
Pixel Selection Example 1 In this example, you call impixel and click on different points in the displayed image, and then press Return, Solution imshow canoe.tif vals = impixel Result
vlas = Intensity Profile Example 2 Plot the profile of 'debye1/tif' Solution imshow debye1.tif improfile Result
Intensity Profile Example 3 Plot the profile of 'flowers.tif' Solution imshow flowers.tif improfile Result
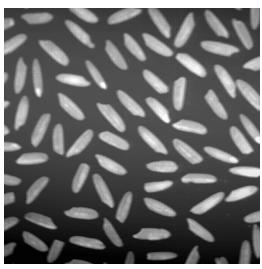
Image Histogram Example 4 Plot the histogram of 'rice.tif'. Solution i = imread('rice.tif'); imshow(i) figure, imhist(i,64) Result
Intensity Adjustment Example 5 Remape the image (rice.tif) data values to fill the entire intensity range [0,255] Solution i = imread('rice.tif'); j = imadjust(i,[0.15 0.9],[0 1]); imshow(j); figure, imhist(j,64) Result
Gamma Correction Example 6 The example below illustrates gamma correction Solution [x,map] = imread('forest.tif'); i = ind2gray(x,map); j = imadjust(i,[],[],0.5); imshow(i) figure, imshow(j) Result
Histogram Equalization Example 7 This example illustrates using "histeq" to adjust an intensity image. Solution i = imread('pout.tif'); j = histeq(i); imshow(i) figure, imshow(j) figure, imhist(i) figure, imhist(j) Result
Histogram Equalization Example 8 Plot above data to get the transformation curve.. Solution i = imread('pout.tif'); [j,t] = histeq(i); plot((0:255)/255,t); Result
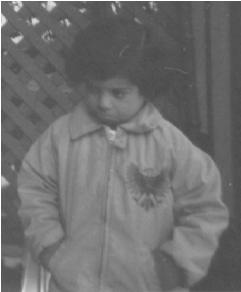
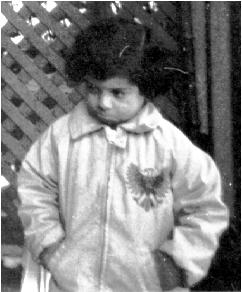
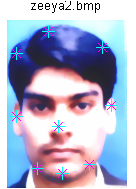
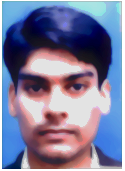
Task #1 1) Take your image, get the pixel values at various places especially center, top left and right corner, and bottom left and right corners. 2) Take profile along diagonal. And explain results. 3) Now make grayscale image and take profile along diagonal compare results with 2. 4) Take Histogram of your image and conclude results from it whether it's a good or bad contrast image. 5) If it is good contrast, make it bad contrast or vice versa. 6) Perform histogram equalization on camerman.tif and compare results with example shown in lab. 7) Perform histogram equalization on your image and conclude results w.r.t 4. Solution % part (1) imshow zeeya2.bmp;vals = impixel
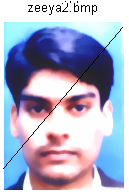
% part (2) imshow zeeya2.bmp; improfile;
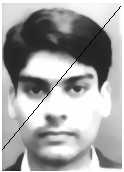
% part (3) i = imread('zeeya2.bmp'); j = rgb2gray(i); imshow(j) improfile;
% part (4) clear all i = imread('zeeya2.bmp'); imshow(i) figure, imhist(j)
% part (5 ) i = imread('zeeya2.bmp'); j = imadjust(i,[0.15 0.9],[0 1]); imshow(j); figure, imhist(j,64)
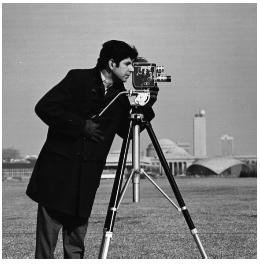
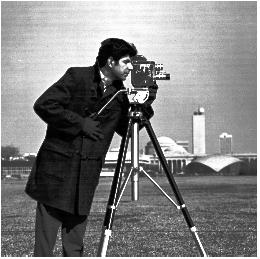
% part (6) i = imread('cameraman.tif'); imshow(i) j = histeq(i); figure, imshow(j) figure, imhist(i) figure, imhist(j)
% part (7) i = imread('zeeya2.bmp'); imshow(i) j = histeq(i); figure, imshow(j) figure, imhist(j) Result Part (1)
vals =
Part (2) Part (3) Part (4) Comments: We can say this image as low contrast image because histogram does not show values below 25. Part (5)
Part (6)
Part (7)
comments:- comparing with part four original picture looks good, histogram equalization is not suitable here. HELP IND2GRAY IND2GRAY Convert indexed image to intensity image.
I = IND2GRAY(X,MAP) converts the image X with
colormap MAPto an intensity image I. IND2GRAY removes the hue
and saturation information while retaining the luminance.
IMHIST
Class Support CV Lab 1 CV Lab2 CV Lab 3 CV Lab4 CV Lab 5 CV Lab 6 CV Lab7 CV Lab8 Other material |
||||
| <<Home | ||||
|
||||||