|
|
|
Interpolation methods
Task 1
Describe
above interpolation methods.
Solution
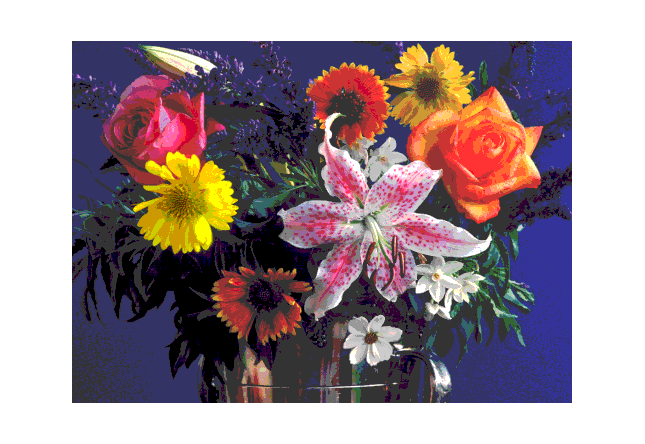
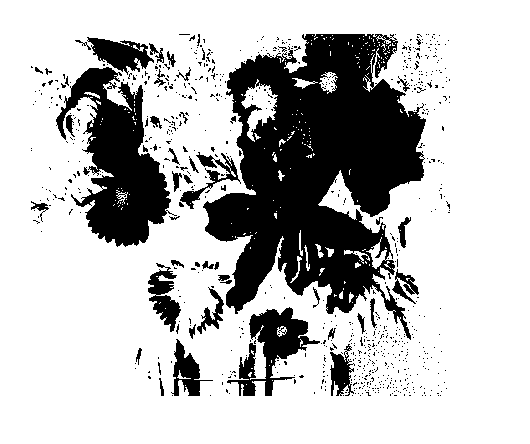
im = imread('flowers.tif');
imshow(im)
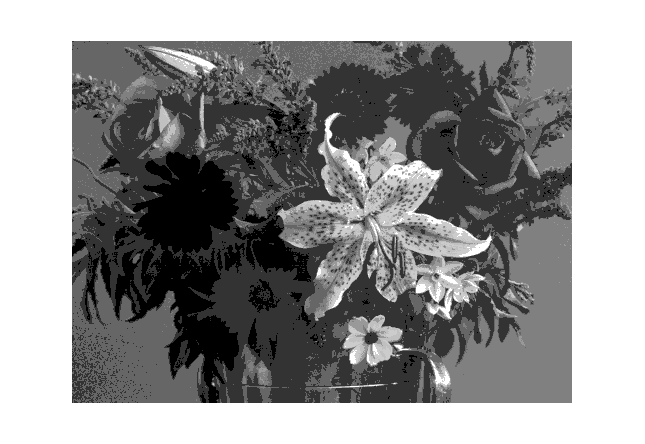
im1 = im(:,:,1);
figure, imshow(im1)
im2 = im(:,:,2);
figure, imshow(im2)
im3 = im(:,:,3);
figure, imshow(im3)
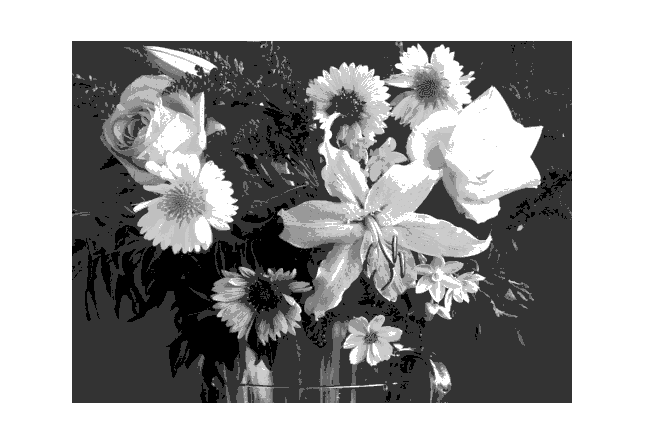
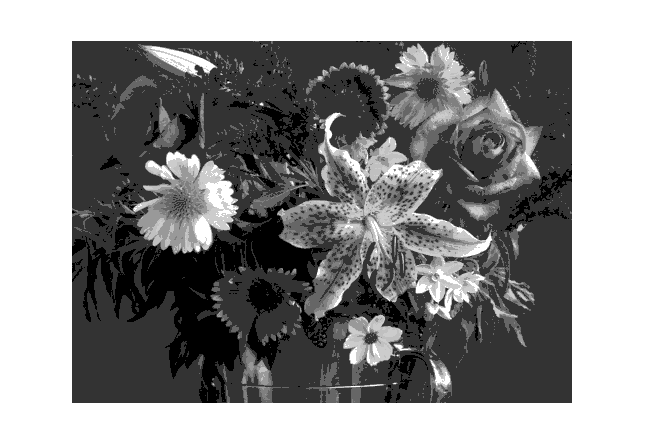
g = rgb2gray(im);
figure, imshow(g)
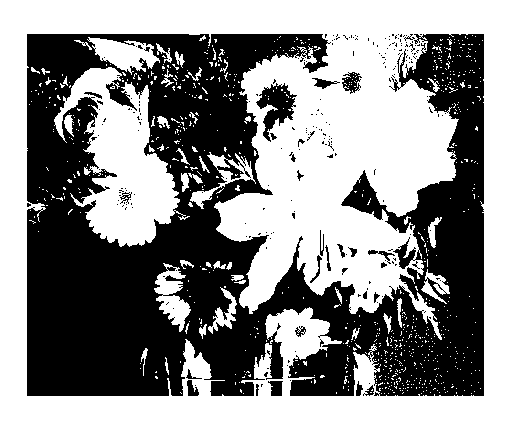
h = g > 73;
figure, imshow(h)
hn = ~h;
figure, imshow(hn)
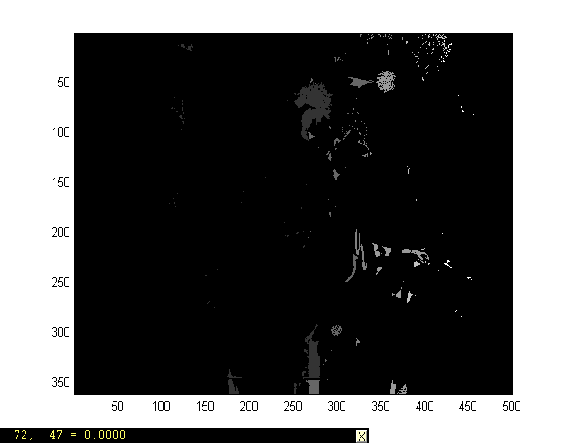
bwl = bwlabel(hn);
figure, imshow(bwl)
imagesc(bwl), colormap(gray), axis image
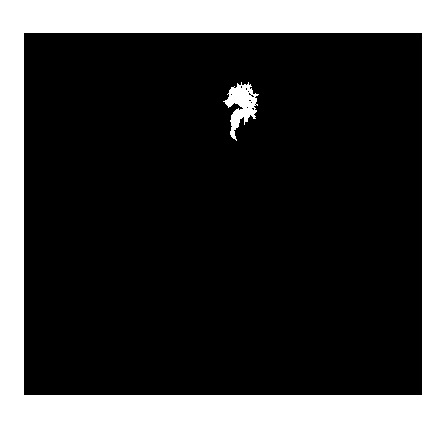
ob3 = bwl ==63
pixval on
figure, imshow(ob3)
Result
Note:
1) im1 = im(:,:,1), im2 =im (:,:,2)
and im3 =im (:,:,3) separated out red, green and blue
components of image.
2) g = rgb2gray(im) converted the RGB image to
gray scale image, which when threshold on 73 gives us binary
image.
3) The hn = ~h command negated the binary
image that is white to black and black to whitel
4) The bwl = bwlabel(hn) command enabled a
pixel location display when the mouse moved on the image.
5) The ob3 = bwl == 63 command only
showed the portion of the binary image where the pixel value
equals to 63.
HELP
BWLABEL
BWLABEL Label connected components in
binary image.
L = BWLABEL(BW,N) returns a matrix L, of the same size as BW,
containing labels for the connected components in BW. N can
have a value of either 4 or 8, where 4 specifies 4-connected
objects and 8 specifies 8-connected objects; if the argument
is omitted, it defaults to 8.
The elements of L are integer values greater than or equal to
0. The pixels labeled 0 are the background. The pixels labeled
1 make up one object, the pixels labeled 2 make up a second
object, and so on.
[L,NUM] = BWLABEL(BW,N) returns in NUM the number of connected
objects found in BW.
Class Support
The input image BW can be of class double or uint8. The output
matrix L is of class double.
Example
BW = [1 1 1 0 0 0 0 0
1 1 1 0
1 1 0 0
1 1 1 0
1 1 0 0
1 1 1 0
0 0 1 0
1 1 1 0
0 0 1 0
1 1 1 0
0 0 1 0
1 1 1 0
0 1 1 0
1 1 1 0
0 0 0 0];
L = bwlabel(BW,4);
[r,c] = find(L == 2);
RGB2GRAY
RGB2GRAY Convert RGB image or colormap to
grayscale.
RGB2GRAY converts RGB images to grayscale by eliminating the
hue and saturation information while retaining the luminance.
I = RGB2GRAY(RGB) converts the truecolor image RGB to the
grayscale intensity image I.
NEWMAP = RGB2GRAY(MAP) returns a grayscale colormap equivalent
to MAP.
Class Support
If the input is an RGB image, it can be of class uint8, uint16
or double; the output image I is of the same class as the
input image. If the input is a colormap, the input and
output colormaps are both of class double.
COLORMAP
COLORMAP Color look-up table.
COLORMAP(MAP) sets the current figure's colormap to MAP.
COLORMAP('default') sets the current figure's colormap to the
root's default, whose setting is JET.
MAP = COLORMAP retrieves the current colormap. The values are
in the range from 0 to 1.
A color map matrix may have any number of rows, but it must
have exactly 3 columns. Each row is interpreted as a color,
with the first element specifying the intensity of red light,
the second green, and the third blue. Color intensity
can be specified on the interval 0.0 to 1.0.
For example, [0 0 0] is black, [1 1 1] is white, [1 0 0]
is pure red, [.5 .5 .5] is gray, and [127/255 1 212/255] is
aquamarine.
Graphics objects that use pseudocolor -- SURFACE and PATCH
objects, which are created by the functions MESH, SURF, and
PCOLOR -- map a color matrix, C, whose values are in the range
[Cmin, Cmax], to an array of indices, k, in the range [1, m].
The values of Cmin and Cmax are either min(min(C)) and
max(max(C)), or are specified by CAXIS. The mapping is linear,
with Cmin mapping to index 1 and Cmax mapping to index m. The
indices are then used with the colormap to determine the color
associated with each matrix element. See CAXIS for details.
Type HELP GRAPH3D to see a number of useful colormaps.
COLORMAP is an M-file that sets the Colormap property of the
current figure.
IMAGESC
IMAGESC Scale data and display as image.
IMAGESC(...) is the same as IMAGE(...) except the data is
scaled to use the full colormap.
IMAGESC(...,CLIM) where CLIM = [CLOW CHIGH] can specify the
scaling.
CV
Lab 1 CV
Lab2
CV
Lab 3
CV Lab4
CV
Lab 5
CV
Lab 6
CV
Lab7 CV
Lab8
Other
material
|
|
|