 | ||||||
| Articles | Projects | Resume | Cartoons | Windsurfing | Paintings | Album |
Esquimalt Lagoon
State of the Ecosystem Report

Water Quality Analysis Project 1998
Waterose et. al.

Section 9. Results:
Results of Field Parameters Analysis
Results of Laboratory Parameters Analysis
Statistical Questions
Results of Surfacewater Creek Variables Analysis
Results of Groundwater Well Variables Analysis
Results of Hydrocarbon Analysis
Results of Field Parameters Analysis:
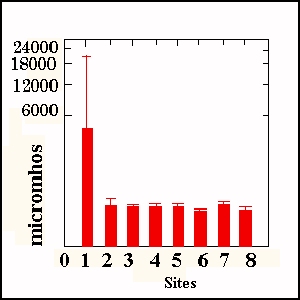
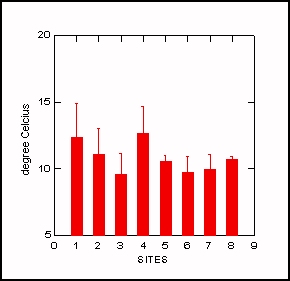
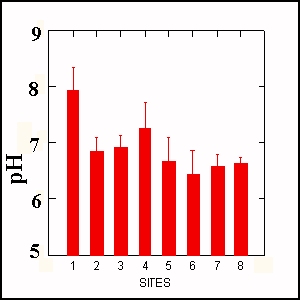
The results of the conductivity, temperature and pH analysis from each sample site are presented in Table 9.1. The data from each site is summarized in the following three graphs illustrated in Figure 9.1, Figure 9.2, and Figure 9.3. Each bar represents eight samplings, with duplicate samples taken each time. The error bars are two standard errors of the mean, i.e. at the ninety-five per cent confidence level.
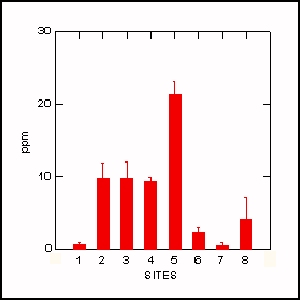
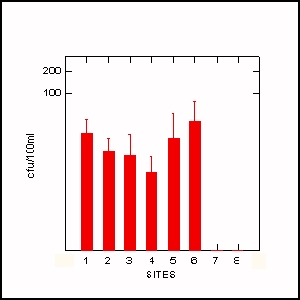
Results of Laboratory Parameters Analysis:
The laboratory analysis included nitrates and fecal coliforms. From each site, the duplicate samples were analyzed and a pair of values was obtained and recorded. The results are presented in Table 9.2 and Table 9.3. The following graphs, Figure 9.4 and Figure 9.5, summarize the mean levels of fecal coliforms and nitrates at each sampling site. Each bar represents sixteen samples from each site, and each bar represents two standard errors of the mean, i.e. at the ninety-five per cent confidence level.
Statistical Questions:
The purpose of this study is very broad in scope. To accommodate this, several questions have been established that lead towards a final conclusion.- Is there a significant difference in variables among surface water sampling locations?
- Does rainfall and the location of sampling sites affect levels of fecal coliforms?
- Do nitrate levels follow a similar pattern?
- Is there a significant difference in all measured parameters between sites two and three, upstream and downstream, on Colwood Creek?
- Is there a significant difference in nitrate and conductivity levels between the two groundwater sites? If yes, what is a possible cause?
Results of Surfacewater Creek Variables Analysis:
The null hypothesis is that the measured parameters do not differ significantly among all of the sampling sites. An ANOVA was used to test this hypothesis. The results of the analysis are summarized in Table 9.4.
Multivariate Test Statistics
Wilks' Lambda = 0.046
F-Statistic = 10.456, df = 20, 136, Prob = 0.000
Based on the multivariate test results, there are no significant differences, p less than 0.050, among all parameters at all test sites. However, with a ninety-five per cent confidence level, the univariate test shows that the fecal coliform counts and the nitrate levels at those sites vary significantly, with p less than 0.050.
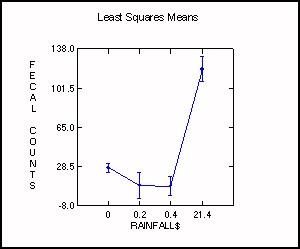
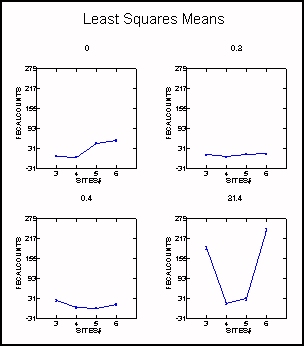
The Influence of Precipitation and Site Location upon Fecal Coliform Counts:
An ANOVA test was used to determine whether different precipitation levels would significantly affect the results at the different sampling sites. The null hypothesis is that fecal coliform counts from all surface water sampling sites at different levels of precipitation do not significantly differ. These results are summarized in Table 9.5.
The outcome of this test shows that, with a ninety-five per cent confidence level, the null hypothesis can be rejected. This is demonstrated by the fact that the probability values were all less than 0.050. Precipitation and the location of the sampling sites did have a significant influence on fecal coliform counts.
Higher levels of precipitation resulted in significantly higher fecal coliform counts. This is illustrated in Figure 9.6 below.
The Influence of Precipitation and Site Location upon Nitrates:
The influence of Precipitation and sampling location on nitrate levels was also analyzed using an ANOVA test. The null hypothesis was that there was no significant difference in nitrate levels with respect to precipitation and the sampling location. These results are summarized in Table 9.6 and Figures 9.9, 9.10, and 9.11.
Under the combined effects of precipitation and site location, this test shows that the level of nitrates is not significantly influenced by the precipitation level, at a confidence level of ninety-five percent, since the p value is greater than 0.050. This is illustrated in Figure 9.9 below.
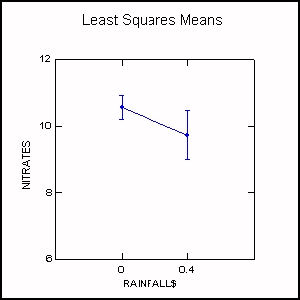
However, at less than the ninety-five per cent confidence level, the higher precipitation levels lead to slightly lower concentrations of nitrates as illustrated in Figure 9.10 below.
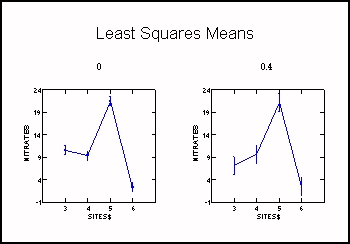
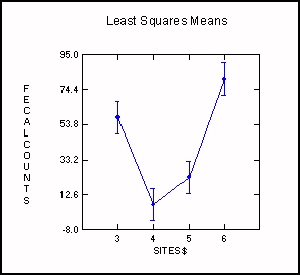
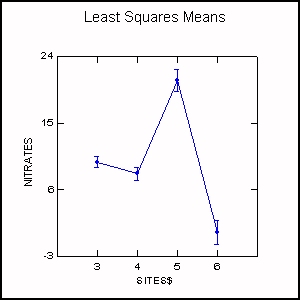
There is a significant difference in nitrate levels at the mouth of the four creeks studied, as p is less than 0.050. The nitrate levels of the four creeks are illustrated in Figure 9.11 below. Site five has the highest level of nitrates, and site six has the lowest level. Nitrate levels at sites three and four are similar and cannot be statistically differentiated from each other.
The Comparisons of Colwood Creek Upstream and Downstream:
A t-test was used to determine how the parameters changed between sites two and three, along Colwood Creek. The null hypothesis was that all parameters would not change between the upstream and downstream sampling sites. The factors are summarized in Table 9.7.
The Bonferroni adjusted probabilities for all the variables that were greater than 0.050. This indicated that the null hypothesis could not be rejected. That is, all variables did not change between the upstream and downstream sampling sites on Colwood Creek.
Results of Groundwater Well Variables Analysis:
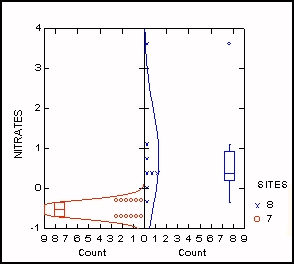
A t-test analysis was used to compare results of groundwater samples from sites seven and eight to identify any changes in nitrate levels and conductivity between the upstream and downstream locations. The null hypothesis was that there would be no difference in the levels of nitrates and conductivity between sites seven and eight. These results are summarized in Table 9.8.
Both the results of the nitrates and the conductivity analysis had probability values less than 0.050. This meant that the null hypothesis had to be rejected. In other words, there was a significant difference in the nitrate levels and conductivity between both groundwater sites.
The nitrate levels at site eight were higher than at site seven as illustrated in Figure 9.12 below.
Site eight had lower conductivity levels than site seven as illustrated in Figure 9.13 below.
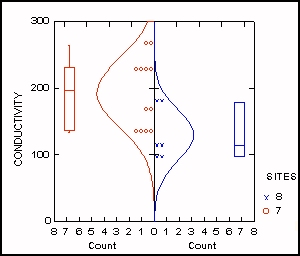
The results indicated a significant difference in nitrate and conductivity levels. Therefore the next test attempted to identify a cause for that difference. The possibilities were: precipitation, location, or both. The null hypothesis was that there would be no significant difference in the level of nitrates and conductivity, regardless of the amount of precipitation or sampling location. The results of this analysis are summarized in Table 9.9 and Table 9.10.
The results illustrate that both precipitation and the location of the groundwater wells influenced the level of nitrates. Their p-values are less than 0.050. Location, with p less than 0.050, and the combined effect of location and precipitation, with p less that 0.050, more significantly influenced conductivity than precipitation itself, with p greater than 0.050.
Results of Hydrocarbon Analysis:
The results of extractable petroleum hydrocarbon (EPH) sediments tests are tabulated in Table 9.11. A duplicate sample was taken at the site C (sample C1).The analysis is broken down into two categories: Light (LEPH), with ten to eighteen carbon atoms per molecule, and Heavy (HEPH), with nineteen to thirty-one carbon atoms per molecule.
The criteria for the thresholds of light and heavy extractable petroleum hydrocarbon Levels in British Columbia are summarized in Table 9.12 below. The threshold level for EPH, including LEPH and HEPH, is 1000 ppm. The levels in the sediment samples were less than 1000 ppm, therefore, while there are traces of anthropogenic petroleums hydrocarbons, these are not at levels that pose a significant risk.
Notes to Table 9.12:
- VPSs include volatile petroleum hydrocarbons except benzene, ethylbenzene, toluene, and xylene.
- LEPHs include (C10-18) hydrocarbons except PAHs under separate regulation.
- HEPHs include heavy (C19-C32) hydrocarbons except PAHs under separate regulation.
To Section 10. Discussion
Index:
- Introduction
- History and Land Use
- Geomorphology
- Nutrients and Coliforms
- Red Tides and Fish Kill
- Hydrocarbons
- Sample Procedure
- Analysis Procedure
- Results
- Discussion
- Future Study
- References
- Photo Album


 email Waterose
Please Sign My Guestbook
Please View My Guestbook

| Articles | Projects | Resume | Cartoons | Windsurfing | Paintings | Album |
 | ||||||