| Links: | |||||||||||||
| Financial Sector: | |||||||||||||
Manufacturing Sector: |
|||||||||||||
|
|||||||||||||
| University of Hong Kong | |||||||||||||
| HoMe | |||||||||||||
Manufacturing Industry in March 2001 in Hong Kong
|
|
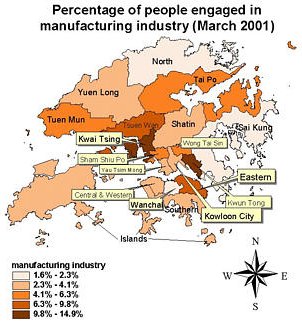
The
table,
chart and
Arcmap
above show the percentage and the distribution of people
who are engaged in manufacturing industry in Hong Kong. Additionally, the
concentration
of people engaged in manufacturing sector in 18 districts can also be seen
easily from the
Arc map.
In March 2001, Kwai Tsing have the highest number of people employed in with
near 33, 000
people. Kwun Tong is the second highest with more than 30, 000 people.
Whereas, the North
in Hong Kong Island have the lowest number of people employed with less than
4,000 people.
It is not surprising to find that Kwai Tsing and Kwun Tong have a number of
people employed
in manufacturing industry because many manufacturing buildings can be found
in these two
places. The containers port in Kwai Chung also favour the development of
manufacturing
in Kwai Tsing. In contrast, the North is mainly designed for residential
housing by the
government. Thus, it has the lowest concentration of people engaged in
manufacturing in
Hong Kong.