2004-2006 Election Fraud Analytics:
Response to the TruthIsAll FAQ
Updated: Mar. 29, 2009 by TruthIsAll
(* indicates recent update)
Summary Overview
Gore won by 3 million more votes than the 540,000 official total;
Florida uncounted votes by county
Smoking
Gun: The Final National Exit Poll
Voted in 2000 – preliminary, final, adjusted
- sensitivity analysis
The Democratic
Underground “Game” thread
Impossible/ feasible NEP weights, implausible vote shares, rBr
-defection rates - false recall
Implausible
Gore 2000 Voter Turnout/Defection scenarios required to match the recorded
vote.
State and
National Pre-Election Polls
The
2004 Election Model: Monte Carlo Electoral Vote Simulation
Final State polls- 18 National polls –undecided voters- EV win
probabilities - sensitivity analysis
18 Final Polls – Correlation of monthly polls vs. Bush approval rating
Average- weighted average- monthly/weekly projections - Zogby
battleground polls
State
Pre-election Polls vs. Exit Polls vs. Recorded Vote
State vs. NEP- Gender- Voted2k- True Vote Models
Interactive Election Simulation
Monte Carlo Polling Simulation
Conservative Scenario Analysis *
True Vote Sensitivity analysis based on two factors: Nader 2000 and New
voter share
Exit Poll MoE exceeded in 29 states for Bush
Battleground vs. Red states – Composite (12:22am) vs. WPE-adjusted exit
polls
Exit Poll
Response Optimization
Excel Solver – True Vote- 1250 precincts by partisanship, 5 location-size
groups, states by partisanship
State Deviations
by Voting Method
Deviations based on percentage voting machine/method mix applied to
WPE-based Exit Poll discrepancies
Demographic weights- vote shares- sensitivity analysis
Effect of changes in demographic vote shares on Kerry’s national vote
2000/2004 first-time and other new voters – 16m recorded Bush voter
increase from 2000
Base case - Bush vs. Gore 2000 voter turnout- sensitivity analysis -
probabilities
Implausible urban and suburban vote shares
2000-2004 Exit Poll analysis (Voted in 2000; Location-size)
Correlation with monthly Pre-election polls; weights and vote shares
adjusted to match the recorded vote
Weights and vote shares were adjusted to match the recorded vote
Party ID
*
Weights and vote shares were adjusted to match the recorded vote
Implausible increase in Bush’s share of women voters from 2000 to 2004
Did Kerry
Win More Than 360 Electoral Votes?
State adjustments: Gore 2000 uncounted votes, Kerry share of Nader and
new voters
True Vote Model- uncounted/ switched votes by state- electoral vote
effect
Reconciling
the Final 5 Million Vote Anomaly
Difference in vote share between the initial 117m and final 5m votes;
exit poll vs. late vote correlation
True
Vote Analysis: Models, Counties, Machines
County
Vote Database (2000-2004)
Database filtering for absolute and percent changes by state, county,
voting method
Florida
*
Ohio
*
Quantifying the risk- likely fraud contests- Democratic Tsunami –
Generic polls- projections
Generic
120-Poll Trend vs. 7:07pm and Final Exit Poll
Demographics- Linear Regression - NEP Timeline- probabilities
CBS reported state votes-Wikipedia vote count
Generic 120-Poll Trend vs. Final 10 Poll Average
Allocating undecided voters- Final 10 polls- probabilities
The Math: Probability and Statistics
Part II: Response to the TruthIsAll FAQ
A TruthIsAll (TIA) FAQ (Mark Lindeman)
The "Rules": Did They Favor Kerry?
Explaining the Exit Poll Discrepancies
_____________________________________________________________________
Part I: Analytic Summary
Introduction
Part I is a comprehensive
statistical analysis of the 2004 and 2006 elections. In 2000, Al Gore won by
several million more than his recorded 540,000 vote margin. In 2004, John Kerry
actually won by 8-10 million votes. In the 2006 midterms, a Democratic Tsunami
gave them control of congress, but the landslide was denied; they did much
better than the official results indicate. And the True Vote does not
include the disenfranchised, the great majority of whom are Democratic minority
voters.
Part II contains the original “TruthIsAll FAQ” with my responses included. The author of the FAQ, Mark Lindeman, has tried to debunk the work of independent analysts who maintain that pre-election and exit polls are powerful statistical evidence that Kerry won handily and that the 2006 Democratic landslide was denied.
Bush had a 48.5% average approval rating on Election Day. The Nov.1, 2004 Election Model, based on the final state and 18 national pre-election polls, projected Kerry as the 51.8-48.2% winner of the two-party vote. His expected 337 electoral vote was calculated as the average of a 5000 election-trial Monte Carlo simulation. The projection model was confirmed by the state and national exit polls. Science works by assuming that the explanation that best fits the data is correct - and is tested against new data, which either strengthens those assumptions or causes them to be rejected in favor of a better explanation.
Edison-Mitofsky provided four state exit poll measures. Kerry won the first three; Bush won the Final:
1) WPE 51.8-47.2% (unadjusted)
2) GEO 51.0-48.5% (adjusted to incoming recorded votes)
3) Composite 50.3-49.1% (12:22am-adjusted to pre-election polls)
4) Final 48.5-51.1% (matched to recorded vote)
WPE is the only unadjusted (“pristine”) measure. It was based on the average discrepancy between the exit poll result and recorded vote for all state precincts which were polled. Measures (2) and (3) are adjusted estimates which incorporate pre-election polls and recorded votes. The final state exit polls were forced to match the recorded votes, therefore implying ZERO election fraud. Why should we believe them? And why bother doing exit polls at all if they will just assume that the recorded vote count was the True Vote?
Some say that exit polls are not designed to predict the True Vote but to provide a demographic snapshot of the electorate. But if that’s the case, and the recorded vote count is corrupted, then so are the demographics.
Kerry also had a steady 51-48% lead throughout the National Exit Poll timeline: at 4pm (8349 respondents); 7:30pm (11027); 12:22am (13047) - after the polls closed. Of course, Bush won the Final NEP by 51-48% (13660 respondents) which was posted at 2pm the day after the election. The Final NEP was forced to match the Recorded Vote count with impossible weights and implausible vote shares, so why should we believe it?
A number of Excel models were developed to calculate the True Vote. They confirm massive documented evidence that the elections were severely compromised by a combination of uncounted and miscounted votes. Essential model inputs include state and national recorded votes, pre-election and exit polls, Census total votes cast and mortality rates. Links are provided for users who can enter their own assumptions and view a “sensitivity analysis” of resulting state and national vote shares and margins. The scenarios are displayed in numeric tables and charts.
The Election Calculator and Interactive Election Simulation models determined that Kerry probably did 1-2% better than the exit polls indicate.
The Election Calculator is an Excel model for analyzing 1988-2004 elections. Users can override the pre-set default assumptions for voter mortality, uncounted vote rates, prior election voter turnout and vote shares of prior and new voters. The base case scenario indicates that Kerry won by nearly 10 million votes with a 53.2-45.4% vote share. Interested readers can download the model, review the base case scenario and then enter their own assumptions.Sensitivity analysis tables provide an instant view of vote shares over a range of input assumption scenarios.
The Interactive 2004 Election Simulation Model (also Excel) enables users to run simulations based on state and national pre-election and exit polls.State exit poll vote shares are based on the following user options: 1) WPE, 2) Best GEO and 3) Composite (12:22am). The National Exit poll data includes the 12:22am update and the 2pm Final. The only pre-election model assumption is Kerry’s projected share of Undecided Voters. The only state exit poll inputs are the method (1, 2, or 3) and assumed cluster effect. A Monte Carlo simulation consisting of 200 election trials generates both the projected popular and expected electoral vote. The probability of Kerry winning the election is the percentage of trials in which Kerry received at least 270 EV. Additional model analysis includes National Exit Poll timeline, Gender vote, exit poll response optimizer, Census data and the Ohio exit poll.
In the 2006 midterms, a Democratic Tsunami gained 31 congressional seats. But they actually did much better than that. A regression trend analysis of 120 pre-election Generic polls (all won by the Democrats) projected they would win by 56-42% and gain over 40 seats. The 7pm National Exit Poll update (55 Dem-43% Rep) confirmed the pre-election trend. But the next day, the Final NEP was once again forced to match a corrupted vote count with implausible weights and vote shares. The Democratic margin was cut in half to 52-46%. The fraud resulted in the loss of 10-20 seats.
Mark has posted on the Democratic Underground as "On the Other Hand", on Daily KOS as “Hudson Valley Mark” and numerous other forums. The TruthIsAll.pdf contains Nov. 1 2004 Election Model reports, analysis, graphs, methodology, links. I have posted on Democratic Underground, Progressive Independent, Thom Hartmann, Mark C. Miller, Brad Blog, Buzz Flash, RFK Jr., Huffington Post, Democrats.com and the Smirking Chimp.
Summary Overview
Dec.12, 2000 is a day that will live in infamy. Bush needed the help of five right-wing Republicans on the Supreme Court to stop the recount in Florida and enable him to steal the election. There has been an ongoing controversy regarding the 2004 election. State and national pre-election and exit polls pointed to a Kerry victory. Those who claim that Bush won fair and square are relentless in their attempts to thrash polling analyses which suggest that fraud occurred. Since the media will not release tell-tale precinct-level data, analysts must rely on publicly available polling data. And they have determined that the polls provide powerful statistical evidence of fraud. “Voter fraud” has been shown to be a non-existent distraction from the evidence of massive “election fraud”. Voters don’t fix elections, corrupt officials do. The corporate media was quick to dismiss the statistical polling analyses and claims of election fraud by “spreadsheet-wielding Internet bloggers” as another left-wing conspiracy theory.
This is what Richard Morin , a Washington Post staff writer, wrote on Thursday, November 4, 2004:
“An Election Day filled with unexpected twists ended with a familiar question: What went wrong with the network exit polls? In two previous national elections, the exit polls had behaved badly. Premature calls by the networks in Florida led to a congressional investigation in 2000. Two years later, a computer meltdown resulted in no release of data on Election Day…. Results based on the first few rounds of interviewing are usually only approximations of the final vote. Printouts warn that estimates of each candidate's support are unreliable and not for on-air use.….That is why the early leaks anger Joe Lenski of Edison Media Research, which conducted Tuesday's exit poll with Mitofsky International for the National Election Pool, a consortium of the major television networks and the Associated Press…. After the survey is completed and the votes are counted, the exit poll results are adjusted to reflect the actual vote, which in theory improves the accuracy of all the exit poll results, including the breakdown of the vote by age, gender and other characteristics”.
The media never considered the possibility that the votes may have been miscounted and that the exit polls were essentially correct. They just took it for granted that the vote count was accurate (i.e. the election was fraud-free). After all, isn’t that why the exit poll results are always adjusted to match the vote count? Of course, they never did an analysis which would have shown that the adjusted Final NEP weights were impossible and that the adjusted vote shares were implausible. And they would have come to the same conclusion as the spreadsheet-wielding bloggers: the election was stolen.
A dwindling number of naysayers continue to argue that the exhaustive statistical analysis of 2004 pre-election and exit polls by a number of independent researchers does not provide convincing evidence that the election was stolen. Their “case” consists of faith-based theories, factual avoidance, misstatements and misrepresentations. And they cannot reconcile the many statistical anomalies which all point to massive fraud. Some of their “explanations” include the following: Kerry voters were more likely to respond to exit pollsters; exit poll interviewers sought out Kerry voters; over 7% of returning Gore voters told the exit pollsters that they voted for Bush in 2000; pre-election and exit polls are not pure random samples; exit polls are not designed to detect fraud in the United States; early exit poll results overstated Kerry’s vote; women voted early and Republicans voted late; Gore voters defected to Bush at twice the rate that Bush voters defected to Kerry. None are supported by factual data and all have been refuted.
Uncounted Votes
In every election, millions of mostly Democratic votes are never counted – and are a significant contribution to the exit poll discrepancies. According to the 2000 Census, approximately 5 million votes were never counted. Since they were from heavily democratic minority districts, if Gore won 75% his true margin was close to 3 million votes - not the 540,000 recorded. And that does not include the very real possibility that a certain percentage of recorded Gore votes were switched to Bush. The 2000 election was not even close, although the media would like us to believe it was. Only the 5-4 Supreme Court decision was close. Consider the Florida 2000 fiasco. Bush “won” by 537 “official” votes – before the recount was aborted. But 185,000 spoiled (under and over-punched) ballots were never counted. Since approximately 65% of them were intended for Gore, he actually won the state by at least 60,000 votes.
According to the U.S.
Census, 125.7 million votes were cast in 2004. The recorded vote was
122.3m and 3.4m were uncounted. The Census survey margin
of error is 0.30%. Therefore there is a 97.5% probability that at least 125
million cast votes. According to detailed information provided by investigative
reporter Greg
Palast, 3.006m votes cast were never counted. They were comprised of
1.389m spoiled ballots, 1.091m provisional and .0.526m absentee. The 0.40
million (0.31%) discrepancy between the Census and Palast matches the Census
MoE.
First-time Voters
They claimed that the vaunted 2004 Republican GOTV campaign brought Bush millions of new Christian fundamentalist votes. But they failed to note that since 1992, according to the National Exit Poll, the Democrats won first-time voters by a 14% average margin. Ruy Teixeira wrote about it in The Emerging Democratic Majority. Furthermore, the Democrats had a remarkable voter registration and GOTV effort. In the strongest Democratic areas, the pace of new registration was 60 percent higher than in 2000, while it was just 12 percent higher in the heaviest Republican areas.
Bush Approval
They dismissed the significance of the Bush 48.5% approval rating on Election Day. But historically, incumbents with approval below 50% lost re-election (Ford, Carter, Bush I) while incumbents above 50% won (Eisenhower, Johnson, Nixon, Reagan, Clinton). The near-perfect 0.87 correlation between Bush’s monthly approval rating and average national poll is further evidence. The correlation was confirmed when Kerry won the 12:22am National Exit Poll by 51-48%. The Final Exit Poll forced a bogus 53% Bush approval weighting to in order to match the vote count.
The Urban Legend
They can’t explain The Urban Legend myth: How did Bush gain vote share in heavily Democratic urban locations, yet lose share in highly Republican small towns and rural areas? An analysis of the 2000 and 2004 NEP location-size demographic shows a 9% increase in the Bush share of the heavily Democratic urban vote and a 3% decline in share of the heavily Republican small town and rural voter. And how did he manage a 3% increase in the suburbs which has been trending Democratic in recent elections?
The Final 5 Million Votes
They can’t explain these anomalies in the recorded state vote shares: 1) the strong correlation between the state exit polls and late vote shares (Kerry led in both), 2) the small discrepancies between the exit polls and the late vote shares, and 3) the consistent pattern of a higher Kerry share of late votes compared to his initial share. But it’s further evidence that the "pristine" exit polls were close to the true vote. Bush won 51.0% of the initial 117.28m votes; Kerry won 53.0% of the final 5.0m. Kerry exceeded his initial vote share in 38 states, including 15 of 19 in the battleground. A false impression was created early that Bush was winning as the first reported votes came in from the East. But even as the recorded votes were being reported on TV, state and national exit polls showed that Kerry was winning the popular and electoral vote. The vote-rigging apparently ended before the final 5m were recorded; Bush had already “won” the electoral vote and held a 3.5m lead in the popular vote. After the final 5m votes were recorded, his “mandate” declined by 0.5m to the official total of 62.04-59.03m.
Weighted Average State Vote shares
They claimed that Bush led in the pre-election state and national polls. But they forgot to calculate the national vote as a weighted average (based on the voting population) of the state poll shares. State polling data shows that Kerry led the weighted average from July to Election Day except for a brief period in September. Bush led the unweighted average. Kerry also led the national pre-election polls. In both poll sets, before undecided voter allocation, Kerry led by less than 1% nationally. But he led by 3% in the battleground states.
Vote Share Projection and Electoral Vote Simulation
They disputed the fact that the Nov.1, 2004 Election Model projections were accurate and that the final pre-election polls matched the exit polls. But assuming that Kerry captured 67-75% of the undecided vote, the pre-election state (Kerry 47.9 - Bush 46.9%) and national polls (Kerry 47.2 - Bush 46.9%) closely matched the 12:22aam National Exit Poll (50.8 -48.2%). The state and national models projected Kerry as the winner by 51-48%, matching the 12:22am NEP and the weighted average state exit polls (51.8-47.2%). The Monte Carlo Electoral Vote Simulation (5000 election trials) forecast that Kerry would win 320-337 electoral votes, assuming that he captured 60-75% of the undecided vote. Pollsters Harris, Zogby and the National Exit Poll said he won the undecided vote by 60-75%. The pre-election projections were also confirmed by the state and national exit polls in the Interactive Election Simulation Model.
Undecided Voters
They rejected the evidence that late undecided voters virtually always break for the challenger. But world-class pollsters Zogby and Harris, who have a combined 60 years of experience, indicated that late polling showed that Kerry won 67-75% of undecided voters. The National Exit Poll also reported that Kerry won a clear majority of undecided voters. This was not unusual; historical evidence indicates that undecided voters break for the challenger over 80% of the time - especially when the incumbent is unpopular. Bush had a 48.5% average approval rating on Election Day. The final Zogby polls in nine battleground states had Kerry leading by a 50-45% average. He was projected to win all nine by 53-46% - but won only five by 50-49%. The margin of error was exceeded in six of the nine states, a 1 in 52 million probability. This is what the Gallup poll said about undecided voters: “In the final USA TODAY/CNN/GALLUP poll before the election, President Bush held a 49-47 edge over Sen. John Kerry when the undecided voters were not allocated to a particular candidate. When Gallup, using a statistical model that assumes that 9 of 10 of those voters would support Kerry, allocated the voters,
the poll ended as a dead heat with
each candidate garnering 49%. The Gallup
allocation formula is based on analyses of previous
presidential races involving an
incumbent”.
Randomly-selected National Exit Poll samples
They declared that exit polls were not true random samples. But Edison-Mitofsky state in the notes to the National Exit Poll and in the NEP Methods Statement that respondents were randomly-selected with a 1% overall margin of error. And the pre-election polls all provide a margin of error based on the number of respondents.
National Exit Poll Timeline
They forgot about the Law of Large Numbers. Kerry led the National Exit Poll by 51-48% at 4pm (8349 respondents), 7:30pm (11027) and 12:22am (13047). But Bush won the 2pm Final NEP (13660) by 51-48% through the use of impossible weights and implausible vote shares which were required in order to match the recorded vote.
Matching the Exit Polls to the Recorded Vote
They dismissed the accuracy of the early exit polls. But it’s standard operating procedure that the final exit polls are always fixed to match the recorded vote even if it means using impossible weights and implausible vote shares. This implies that the recorded vote was fraud-free – not exactly a reality-based assumption. Preliminary state and national exit polls are “contaminated” when they are forced to match a corrupt vote count.
The Gender Vote
They need to explain how sharply increased his share of Democratic women voters while his share of Republican males declined? One would normally expect to see a positive correlation in the Demographic Trend between the two groups. But to believe that Bush won by the 62-59m recorded vote, one must believe that his “mandate” was provided by women who in 2000 either a) did not vote, b) voted for Gore, or c) voted for Nader. According to the NEP, Kerry won New voters by 57-41%, Gore voters by 91-8% and Nader voters by 64-17%. So why should you believe it?
Democratic Exit Poll Bias?
They noted a built-in Democratic bias in the exit polls. But they did not account for uncounted and switched votes. Exit polls overstate the recorded Democratic vote in every election. Part of the discrepancy is due to uncounted votes in heavily Democratic minority districts. In addition, solid documented evidence exists of direct vote-switching directly at DREs and on central tabulators where touch-screen, optical scanner, lever and punched card votes are counted. Republicans manufacture the voting machines which can easily be hacked.
Margin of Error
They said that the margin of error
used in calculating the probabilities
of the exit poll discrepancies was too low. But even assuming a 60%“cluster
effect”, the probabilities were still near zero. The WPE-adjusted state
exit polls discrepancies exceeded the
margin of error in 24 states for Bush. The Composite (12:22am)
discrepancies exceeded the margin of error in 16 states - all in favor of Bush.
Not a single state deviated beyond the MoE for
Kerry. Assuming a zero cluster effect, the probability that the MoE would be exceeded in 16 states by Bush is 1 in 19 trillion. A probability sensitivity analysis gave Kerry a 98% probability of winning a popular vote majority - assuming a 50% cluster effect.
Regions and Time Zones
They cannot explain why the margin of error was exceeded (using the average state WPE) in 29 states for Bush and in just one for Kerry. All 21 Eastern Time Zone states red-shifted to Bush and 14 exceeded the MoE. But the probability that the exit poll margin of error would be exceeded in 29 states is ZERO.
Red-shift vs. Blue-shift
They overlooked the fact that 41 states switched to Bush from the final pre-election polls to the recorded vote. But none of the 10 states which switched to Kerry was a battleground state. Forty-three states red-shifted to Bush from the 12:22am exit polls. Oregon was the only battleground state which shifted to Kerry – by less than one percent. It’s also the only state in which voting is done by mail. Was this all just a coincidence, a case of bad polling or an indication that fraud occurred?
They neglected to ask why six of the eight states which deviated to Kerry from the exit polls were strong Bush states: TN (1.63), TX (1.65), SD (1.67), ND (2.51), KS (2.37) and MT (0.22). The exit poll discrepancies (shown in parenthesis) were all within the exit poll margin of error. But only two competitive states deviated to Kerry: OR (0.75) and HI (1.25). Is it just a coincidence that Oregon is the only state which votes exclusively by mail (100% paper ballots), and that any discrepancy in that state would be small and could favor either Bush or Kerry? And Hawaii is not exactly a critical state.
They agreed that the vote-rich battleground states would decide the election. But was it just a coincidence that six deep-red states deviated to Kerry and not a single blue state? Or was it because Bushco did not want to explain a 50-state red-shift? Did they disregard the six states knowing that Kerry would not come close to winning them? Instead they focused on thwarting a nationwide blue-shift in competitive states. The beast was in the East, the rest were in the West.
Voter Mortality
They suggested that up to one million more Gore 2000 voters died than Bush voters had a major impact on the Bush “mandate”. They cited Gore’s 51-47% advantage in the Final NEP for the 60+ age group and calculated a 1.15% annual voter mortality rate (4.60% over the four years between elections). Therefore, approximately 5m of the 110.8m who cast votes in 2000 died prior to Nov 2004. But Gore’s 51% share of 5m is 2.55m; the Bush 47% share is 2.35m; the 0.20m difference is inconsequential. The Election Calculator showed Kerry winning by 10m votes with 53.5% of the popular vote.
Implausible Party ID Weights
They need to explain why the Party ID mix changed from a 3-5% Democratic edge over the last 4 elections to an even 37/37 split in the Final National Exit poll. The 12:22am NEP update had a Party ID mix of 38% Democrats, 35% Republicans and 27% Independents; corresponding Kerry vote shares were 91%, 7% and 52%. In the Final NEP (which was forced to match the recorded vote) the mix was changed to 37/37/26 with Kerry vote shares of 89%, 6% and 49%, respectively. The adjustments turned Kerry's 51-48% win into a 51-48% loss. But the changes to the weights and vote shares left footprints which exposed the fraud. A Pew study shows that the Democrats have held a steady 4-5 point Party ID advantage in the four presidential elections since 1992. And the 1992-2004 Final National Exit polls indicate that the Democratic candidate won first-time voters by an average 14% margin. It’s only logical to conclude that a solid majority of first-timers were Democrats. So why should we believe the net 3% red-shift in weights in the Final NEP?
Reluctant Bush Responders
They hypothesized that Bush voters were reluctant to respond to exit pollsters. But the rBr theory was contradicted by the 2004 Final Exit Poll. In the Final, Bush 2000 voters comprised 43% of the respondents, compared to 37% for Gore voters. And rBr was also contradicted by a linear regression analysis: exit poll non-response rates increased going from the strongest Bush states to the strongest Kerry states, which suggests that non-responders were Kerry voters. So they had to come up with another explanation. It was a perfect Hobson’s choice. If they believed the final Exit Poll (which Bush won by 51-48%), they would have to accept the weights which indicated that Bush voters were over-represented.
But then they could not claim the rBr theory.
Impossible Voted 2000 Weights
They claimed that it was standard operating procedure to re-weight the exit polls based on the recorded vote. But the Final NEP “Voted in 2000” weights (Bush 43/Gore 37%) were mathematically impossible. Bush 2000 voters could not have comprised 43% of the 122.3m votes recorded in 2004, since 43% of 122.3 is 52.6m- and Bush only had 50.5m votes in 2000. The 43/37 weights were irrelevant and misleading since they were mathematically impossible. Furthermore, since approximately 1.8m Bush 2000 voters died prior to the 2004 election, the maximum number who could have voted in 2004 was 48.7m - assuming an impossible 100% turnout. This physical, incontrovertible mathematical fact totally confounded the naysayers. And the longer they tried to refute the facts, the sillier they looked.
“The Game”
They finally agreed in the Democratic Underground Game thread that the Final NEP Bush/Gore weights were impossible and came up with a new set of feasible weights. But they had to compensate for the change to feasible weights in order to match the recorded vote by inflating the Bush vote shares to implausible levels. This was necessary even though the shares were previously inflated in the Final with impossible weights in order to match the recorded vote. It was a feeble, last-ditch Hail Mary pass to justify the Bush “mandate”. They had to deal with an inconvenient truth: the Final National Exit Poll inflated the Bush tally by more than 4 million votes. But even though the weights were mathematically impossible, the exit-pollsters had no choice but to use them hoping that no one would notice. And so they lost the “Game”. Their use of implausible vote shares meant that they could not come up with one believable Bush win scenario.
To match the recorded vote, they were forced to make the following implausible assumptions:
1) 14.6% of Gore 2000 voters defected to Bush.
The 12:22am NEP reported that 8% defected; it was changed to 10% in the 2pm Final.
The probability of a 6.6% discrepancy is ZERO.
2) Kerry won 52.9% of those who did not vote (DNV) in 2000.
The NEP reported a 57-41%
spread; it was changed to 54-45% in the Final.
3) 7.2% of Bush 2000 voters defected to Kerry.
The NEP reported that 10% defected; it was changed to 9% in the Final.
False Recall
They knew that every theory they had proposed to explain the exit poll discrepancies was refuted. So they were forced to suggest “false recall” as a last-ditch explanation and cited a post-election NES 600-sample survey to account for the impossible Final 43/37% Bush/Gore weights. This was the basis for their claim that 14.6% of Gore 2000 voters defected to Bush in 2004. They implied that approximately 6.6% of Gore 2000 voters (8.6% higher than the 12:22am NEP defection rate) misrepresented their vote and told the exit pollsters they voted for Bush in 2000. The reason: a long-term bandwagon effect: Gore voters wanted to associate with the “winner”.
But “false recall” is not a plausible explanation since a) Gore won by 540,000 votes, b) according to the pristine 12:22am NEP, Kerry captured 91% of Gore voters and 10% of Bush voters, c) Bush had a 48.5% approval rating on Election Day 2004, d) false recall is not applicable to pre-election polls and e) the pre-election polls matched the exit polls. Why would Gore voters want to be associated with Bush? Even if returning Gore voters lied about their vote in 2000, it’s irrelevant. What is relevant is a) their factual 2000 recorded Gore vote and b) that 91% said they just voted for Kerry. We use this factual data to compute feasible and plausible weights by adjusting the 2000 recorded vote for mortality and estimated 2004 turnout.
They also need to explain how the “false recall” hypothesis applies to other demographics. In the 12:22am NEP, 13047respondents were asked who they just voted for: Kerry won the Gender demographic by 50.78-48.22%. But only 3200 of the 13047 respondents were asked how they voted in 2000. But Kerry won the other 10,000 respondents (who were not asked who they voted for) by 51-48%. This totally contradicts the “false recall” argument. Why would 10,000 respondents tell the exit pollsters that they just voted for Kerry if they wanted to be associated with Bush?
Model Assumptions
They maintain that the base case assumptions in the True Vote Model are not feasible and plausible. But the assumptions were based on feasible weights applied to plausible 12:22am NEP vote shares. The model determined that Kerry won by 66.1 - 58.4mm (52.6 - 46.4%). Applying the weights to the 2pm Final NEP (which used inflated Bush vote shares to match the vote count) Kerry was still the winner by 3.4 million (51.2 - 48.4%). The True Vote Model input consists of the following: 1) feasible “Voted 2000” weights (ratio of Kerry, Bush, Nader/other and new voters). The 2000 recorded vote was reduced by 3.5% for mortality and 95% turnout of 2000 voters in 2004; 2) 12:22am NEP vote shares; 3) 3.4m uncounted votes: 125.7m reported by the 2004 Census Bureau less 122.3mm recorded; 4) 2.6mm (75%) of the uncounted votes were for Kerry; historically, the majority of uncounted votes have been in Democratic minority districts.
Switched Votes
The True Vote model also determined that 4.5m (6.8%) of Kerry’s true vote must have been switched to Bush. The simple formula is
True Vote = Recorded + Uncounted + Switched. Kerry’s True Vote was 66.1m, his recorded vote 59.0m and 2.6m were uncounted. The model also concluded that Kerry won 336 electoral votes. This result matched the Nov.1 Election Model which used Monte Carlo Simulation to calculate Kerry’s expected electoral vote.
The Election Incident
Reporting System (EIRS)
According to the 2004 EIRS, 86 of 88 touch screen vote switching incidents were from Kerry to Bush, a 1 in 79 sextillion probability.
Sixteen Million New Bush Voters?
They failed to explain how Bush found 16m new voters (DNV2k) to reach 62m in 2004. He had 50.5m votes in 2000. But only 46m returned to vote in 2004. Approximately 2m Bush voters died and an estimated 2.5m did not vote, assuming a 95% turnout. According to the 12:22am National Exit Poll, Bush won 41% of 26.3m new voters. The 19% discrepancy was 11 times the 1.72% margin of error. The probability of the discrepancy is ZERO. It’s important to note that a solid majority of new voters were Democrats and Independents who gave Bush an approval rating much lower than his total 48.5% average on Election Day 2004.
They need to explain how Kerry lost the popular vote in 2004, even though he won a solid 57-41% share of new (DNV2k) voters. Of the DNV2k voters, Kerry won first-time voters by 55-43% and other new voters by 61-37%. Gore won the popular vote in 2000 even though Bush captured new (DNV96) voters by 52-44%. But this is quite strange, especially since Gore won first-timers (52-43%) and Bush won others (71-26%). How could there have been such a wide discrepancy in vote share between first-timers and others? Did Bush really win 71% of other new voters?
Plausible Scenarios of 2000 Voter Turnout and Share of New 2004 Voters
They belittled a comprehensive sensitivity analysis which indicated that Kerry won all plausible scenarios of voter turnout and new voter share. But assuming 12:22am NEP vote shares and 100% Bush 2000 voter turnout, Gore voter turnout had to be 73% for Bush to tie Kerry and 64% to match the recorded 62-59m vote.
Implausible Vote Shares
They need to explain these implausible changes in Bush NEP vote shares from 2000 to 2004:
-The Bush share of females increased by 4.2% while his share of males decreased by 0.2%
-His share of white females increased by 5.0% while his share of white males decreased by 0.9%
-His share of non-white females increased by 4.0% while his share of non-white males increased by only 0.76%
-His share of female independents increased by 1.8% while his share of male independents decreased by 5.6%
Didn’t females vote 54-45% for Kerry? Didn’t over 90% of blacks vote for him? Weren’t independents for Kerry by 52-44%?
Why would independent males defect to Kerry at triple the rate that independent females defected to Bush? Didn’t Nader voters break 3-1 for Kerry?
The “Swing” vs. “Red-shift” argument
They claimed that the raw exit poll data which have not been made public indicates that there was no tendency for Bush to do better in 2004 relative to 2000 (“swing”) than he did in the 2004 exit poll (“red-shift”). They presented their analysis in a swing vs. red-shift scatter chart and concluded from the flat regression line that the exit poll discrepancies did not indicate fraud. But they did not consider the following factors: According to the 2004 National Exit Poll, Kerry won 71% of returning Nader voters compared to 21% for Bush. A similar split would have increased Gore’s margin by 1.4mm. Assuming that 75% of approximately 5 million uncounted votes were for Gore, his margin increases by another 2.5 million. When added to his recorded 540,000 vote margin, Gore’s adjusted margin becomes 4.5 million.
And that does not consider the effects of vote-switching. We know a lot more about vote-switching than we did in 2000. It’s very likely that Gore votes were switched to Bush. But assuming zero vote-switching, Gore’s adjusted, true margin was close to 4.5 million: 2.5m uncounted + 1.4m Nader + 0.54m recorded. They never normalized the 2-party state vote shares in calculating “swing”. Actual adjusted swing was 3.9%, recorded swing 2.0%; red-shift 4.1%. An adjusted swing vs. red-shift bar graph displays the deviations. Another scatter chart shows that adjusted swing exceeded 4% in 18 states while red-shift exceeded 4% in only 4 states. The naysayer swing vs. red-shift argument is just another ruse meant to divert, confuse and mislead.
Ohio
They
argued that the Final Ohio exit poll does not indicate fraud. But they
ignored the massive documented evidence of uncounted and switched votes, and
voter disenfranchisement. Two election workers were convicted of rigging the
recount.
Kerry won the 12:22am Ohio exit poll (Gender demographic, 1963 respondents) by 52.1-47.9%.
But the exit poll unadjusted method (WPE provided by Mitofsky) indicates that he won 54.2-45.4%.
Somehow, Bush won the 2:06pm Final (2020 respondents) by 50.94-49.06%.
In the Final, vote shares and weights were changed in favor of Bush to match the miscounted Ohio recorded vote. This was just like the final NEP in which vote shares and weights were changed from the 12:22am update in order to match the miscounted National vote.
Two models confirmed that Kerry won Ohio. The first was based on 12:22am NEP vote shares with weights adjusted to the Ohio 2000 recorded vote. Kerry was the 51.74-48.26% winner, within 0.32% of the exit poll. The second was based on uncounted (3%) and switched vote (6.15%) assumptions applied to the recorded vote. Kerry was the 52.6-47.4% winner. An exhaustive statistical study of actual ballots in Ohio’s Cuyahoga County (Cleveland) indicated that 6.15% of Kerry’s votes were switched.
Using the original 12:22am Ohio exit poll weights for the following demographics, it would have been necessary to inflate the Bush vote shares to implausible levels to match the recorded vote. So the weights were changed in favor of Bush to minimize the change:
First-time voters
Of the 14% who were first-time voters, 55% were for Kerry. Are we to believe that he won just 47% of the other 86%?
When Decided
Of the 21% who decided in the month prior to the election, 62% voted for Kerry. Are we to believe that he won just 45% of the 79% who decided earlier? Did Bush lead by 10% in any of the early polls?
Party ID
The weights changed from 38D/35R to 35D/40R, a 7.9% shift. With the original weights, Bush needed 17% of Democrats to match the recorded vote. He had 8%.
Ideology
Liberal/Conservative weights changed from 21/32 to 19/34, a 9.5% shift. With the original weights, Bush needed 23% of Liberals to match the recorded vote. He had 13%.
Voted for Senate
Democratic/Republican weights changed from 43/57 to 36/64, a 16.3% shift. With the original weights, Bush needed 14% of those who voted for the Democratic candidate. He had 7%.
Florida
They ignored Florida’s implausible vote count by machine type and party registration. In 2000, Bush supposedly “won” by 547 official votes. Given Gore’s 70% share of 180,000 uncounted under/over votes, Gore won by at least 60,000 votes. In 2004, Bush supposedly “won” by 52-47%, a 368,000 vote margin. The final Zogby pre-election poll had Kerry winning by 50-47%. Kerry led the WPE-adjusted exit poll by 50.9-48.3%. Dan Rather's voting machine expose showed that poor-quality paper used in punch card machines was a major cause of election fraud in heavily Democratic precincts, thus illustrating a previously unknown method used to hack mechanical voting machines, whether punch card or lever.
The Democrats had a 41- 37% registration advantage in Touch Screen (TS) counties and a 42-39% edge in Optical Scan (OS) counties. Kerry won the TS counties (3.86mm votes) by 51-47%, but Bush won the OS counties (3.43mm votes) by a whopping 57-42%. Kerry’s low vote shares in the three most heavily populated (and Democratic) TS counties (Palm Beach, Broward, Dade) are highly suspect. Florida voter registration by party is the same in TS and OS counties, so we aren’t comparing apples and oranges. The TS county vote share matched the 12:22am NEP to within 0.43% for Bush and 0.31% for Kerry. The OS county share deviated by 9.0% for Bush (307,000 votes) while the Kerry discrepancy was -8.1% (278,000).
Several models indicate that Kerry won Florida. The first was based on voting machine type (optical scanners and touch screens) and used 2004 NEP “Party ID” vote shares with party registration percentage weights. Kerry won by 50.7-47.7% (closely matching the exit poll) – a 221,000 vote margin. The second was based on uncounted (1%) and switched vote (6.9%) assumptions applied to the 2004 recorded vote. Kerry won by an identical 221,000 votes. In a third calculation based on 12:22am NEP vote shares with weights adjusted based on the Florida 2000 recorded vote, Kerry was a 52.6-46.7% winner. In a fourth calculation, based on uncounted (3%) and switched vote (7%) assumptions applied to the recorded vote, Kerry was a 51.3-48.2% winner. Assuming that Kerry won 70,000 of 96,000 Nader 2000 votes (based on his 71% NEP share), he had a built-in 100,000 vote advantage on Election Day … assuming all the votes would be counted. Given a 1.0% margin of error, the probability is 1 in 12.7 trillion that Kerry's total TS county vote share would exceed his total Florida share by 4.2%.
New York
They cherry-picked the final NY
pre-election poll in a feeble attempt to prove that the pre-election polls
didn’t match the exits. Kerry won the final pre-election poll by 59-40%. The
recorded vote was 58.5-40.2%. But they cannot explain how Kerry won 66% of
the final 497,000 votes recorded. They claimed that the NY pre-election
poll was correct and that the WPE-adjusted exit poll (Kerry 64.1- Bush 34.4-
Other 1.5) was wrong. The Exit Poll MoE is 2.6% for 1452 respondents
(3.2% if a 30% cluster effect is assumed).
They claimed that the NY
pre-election poll matched an accurate recorded vote. Their proof: Lever voting
machines have a low 1% spoilage rate. But they cannot provide evidence that ALL
the votes were counted accurately in ALL the precincts and they failed to
consider absentee and provisional ballots. Historical evidence indicates that
Lever machines are vulnerable to rigging. Dan
Rather's voting machine expose
was a clear example. In Florida 2000, poor-quality paper used in punch
card machines was a major cause of election fraud in heavily Democratic
precincts, illustrating a previously unknown method used to hack mechanical
voting machines, whether punch card or lever.
They failed to consider the NY 2000 vote: Gore 60.2 - Bush 35.2 - Nader 3.6. Their argument implies that the 2004 recorded vote was fraud-free and that 100% of returning Nader 2000 voters defected to Bush - clearly an impossible scenario. In fact, according to the 12:22am NEP, Kerry won Nader voters by 71-21% and 10% of Bush voters defected to Kerry while just 8% of Gore voters defected to Bush. Adjusting the NEP weights based on the NY 2000 recorded vote and assuming 12:22am NEP vote shares, Kerry won by 63.6-35.1%.
They ignored the theoretical margin of error. It’s well-known that exit polls are more accurate than pre-election polls. There was a 5.1% discrepancy between Kerry's NY pre-election (59%) and exit poll (64.1%). Since the MoE is 4% for a typical 600-sample pre-election state poll, there was a 95% probability that Kerry's True vote was in the 55-63% range. The NY exit poll 3.2% MoE (30% cluster effect) implies there was a 95% chance that Kerry's True vote was in the 60.8-67.2% range which would fall within the MoE of both the NY pre-election and exit poll. On the other hand, the weighted average of 51 state pre-election polls (adjusted for undecided voters) matched the National Exit Poll to within 1%. Once again, it’s the Law of Large Numbers taking effect.
They
failed to consider that Kerry’s vote share was 10% higher in NY than
nationally. The Election Calculator, which accounts for voter mortality,
turnout and uncounted votes, determined that Kerry won by 64.0-34.5%. The assumptions were as follows: Gore and Kerry won
75% of the uncounted
votes (5%
of total cast); Kerry won 94% of Gore voters, 12% of Bush voters, 61% of new
(DNV2k) voters and 68% of returning Nader/other voters. A sensitivity analysis
shows that if Kerry won 90-98% of returning Gore voters and 57-65% of DNV2k,
his NY vote share ranged from 61.3 to 66.7%.
They
implied there was zero fraud in claiming that the recorded vote was the true
vote. An analysis of the effects of
uncounted and switched votes indicates that Kerry won by 63-36%. If 2% of
total votes cast were uncounted (75% to Kerry), then 7% of Kerry votes were
switched to Bush. The uncounted vote assumption is lower than the 2.74%
national average (NY uses lever voting machines).
Exit Poll Response: Four matching models
Four independent mathematical methods applied to three distinct sets of precinct, national and location-size exit poll data each produced the identical result. The USCV simulation; 1250 precincts by partisanship; location-size; NEP Voted in 2000 were in near-perfect confirmation.
The Exit Poll Optimizer employed the Excel Solver algorithm to obtain a feasible solution for the 2-party vote (Kerry 52.15-Bush 47.85%). The data constraints included the recorded vote (Bush 51.24-Kerry 48.76%), response rates and within precinct error (WPE) categorized into five partisanship groupings: Strong Bush, Bush, Even, Kerry, Strong Kerry.
The Optimizer confirmed the USCV
simulation. Both models analyzed summary exit poll data for 1250 precincts
supplied by Edison-Mitofsky and in so doing, debunked the reluctant Bush responder
(rBr) hypothesis. The Optimizer also exactly matched the 12:22am
National Exit Poll “Voted in 2000” demographic two-party result: Kerry 52.15-
Bush 47.85%. The identical result was obtained by running the Optimizer
for five NEP location-size category groupings (Big Cities, Small Cities,
Suburban, Small Towns and Rural, given the WPE for each category.
The 2006 Midterms
Except for the notorious 2006 FL-13 congressional race in which 18,000 mostly Democratic votes were mysteriously missing, the evidence of massive fraud in the midterm elections is hardly mentioned in the corporate media. But a Pew 2006 Election Analysis describes voting “anomalies” and computer “glitches” that occurred in virtually every state. The fraud probably cost the Democrats 10-20 congressional seats.
The 2006 National Exit Poll “How Voted in 2004” weights were changed from 47 Bush / 45 Kerry at 7pm on Election Day to 49/43 in the Final NEP at 1pm on the following day. Once again, just like in 2004, the exit pollsters had to match the vote count by expanding the weight spread from 2% to 6%! This had a major effect in cutting the Democratic margin in half - from 55-43% to 52-46%. As noted earlier, the 2004 12:22am NEP “How Voted in 2000” Bush/Gore 41/39 weights were changed to 43/37 in the 2pm Final, turning a 51-48% Kerry victory into a 51-48% loss.
If plausible 49 Kerry/ 46 Bush weights (based on the 2004 NEP) are used, the TRUE Democratic margin becomes 56.7-42.1%, exactly matching the 120 pre-election Generic Poll trend line. Was this just a coincidence or another confirmation that the pre-election polls matched the
7pm National Exit Poll? You decide.
_______________________________________________________________________________________________________________
The 2000 Election: Starting Point of the
Analysis
In every election, millions of votes are never counted. They represent a significant component of the exit poll discrepancies. According to the 2000 Census, 110.8m votes were cast but only 105.4m recorded, leaving 5.4m uncounted. Most were from heavily democratic minority districts. Assuming that 75% were Gore votes, his true margin was close to 3 million, not the 540,000 recorded. But that doesn’t include likely vote-switching to Bush on DREs and optical scanners. And don’t forget the millions of disenfranchised Democrats who never even got to the voting booth. Gore’s 540,000 “official” vote margin is a long-running media myth.
The 2000 election wasn’t even close, although the media would like us to believe it was. Only the 5-4 Supreme Court decision was close. Consider the Florida fiasco. Bush “won” by 537 “official” votes before the Supreme Court aborted the recount - and 175,010 spoiled (under-punched and over-punched) ballots were never counted. Since approximately 75% were intended for Gore, he probably won Florida by more than 80,000 votes. The spoiled punched cards in Florida were just the tip of the national iceberg.
The headline in nearly every newspaper after the National Opinion Research
Center's (NORC) recount implied that Bush actually received more
votes in Florida than Gore. Not true. Under any scenario where all of the votes
are counted, Gore won. The only scenarios where Bush won were those where
significant numbers of votes were simply not counted. The AP said : "Under
any standard that tabulated all disputed votes statewide, however, Gore erased
Bush's advantage and emerged with a tiny lead that ranged from 42 to 171
votes."
Gore's won by over 46,000 if 110,000 over-votes were counted, of which 75,000
were for Gore and a minor candidate and
just 29,000 for
Bush. Many of the over-votes were entirely legal. They weren't counted because
a voter may have punched in Gore's name and written it down to be
certain the counter got the message. If
Florida's counties had error-checking machines in the precincts to
prevent over-votes, Gore would have won easily.
The media consortium paid practically no attention to these ballots. Why? To
conceal evidence that Florida's voters preferred Gore.
The Associated Press report states, "In the review of all the state's
disputed ballots, Gore edged ahead under all six scenarios for counting all
under-votes and over-votes statewide."
Gore won under all scenarios. If all legal votes had been counted, Al
Gore would be President.
The media deliberately mislead the public. There may have been illegalities
committed by a number of state and national government officials. But it’s
"Get over it, it’s time to move on”.
2000 Recorded Vote (mil)
Gore
Bush Other
51.00 50.46
3.96
48.4% 47.9%
3.7%
Exit Poll:
Gore Bush
Other
49.4% 47.1% 3.5%
Gore Bush
Other
55.81 51.65 3.34
50.4% 46.6% 3.0%
Assumptions:
Uncounted Votes
Gore
Bush Other
75%
20% 5%
4.04
1.08 0.279
1996 Annual Mortality
Total Voters
1.24%
Clinton share
50%
1996 Voter Turnout in
2000
Clinton
96%
Dole
96%
Perot
96%
1996
Voted Recorded Unctd
Cast Deaths Alive
Clinton
47.40 6.54 53.94
2.60 51.34
Dole 39.20
1.75 40.94
2.10 38.84
Perot 9.676
0.44 10.11
0.50 9.61
Total 96.28
8.73 105.00 5.21
99.79
2000 Calculated (NEP vote
shares)
Turnout Voted Weight Gore Bush
Other
DNV
- 15.00
13.5% 52%
43% 5%
Clinton 96%
49.29 44.5%
82% 15% 3%
Dole
96% 37.29 33.7%
8% 91% 1%
Perot 96%
9.23 8.3%
50% 42% 8%
Total 95.80
110.8 100% 50.37% 46.62% 3.01%
55.81
51.65 3.34
Sensitivity Analysis
1
Gore
Share of New voters
48.0% 50.0% 52.0%
54.0% 56.0%
Gore%
Clinton Gore National Vote Share
86%
51.6% 51.9% 52.1%
52.4% 52.7%
84%
50.7% 51.0% 51.3%
51.5% 51.8%
82%
49.8% 50.1% 50.4%
50.6% 50.9%
80%
48.9% 49.2% 49.5%
49.8% 50.0%
78%
48.0% 48.3% 48.6%
48.9% 49.1%
Margin
(mil)
86% 6.9
7.5 8.1
8.7 9.3
84% 4.9
5.5 6.1
6.7 7.3
82% 3.0
3.6 4.2
4.8 5.4
80% 1.0
1.6 2.2
2.8 3.4
78%
(1.0) (0.4) 0.2
0.8 1.4
Sensitivity Analysis
2
Clinton Voter Turnout in
2000
92.0% 94.0% 96.0%
98.0% 100.0%
Clinton%
Unctd96
Gore National Vote Share
95%
50.9% 51.2% 51.5%
51.8% 52.1%
85%
50.4% 50.7% 50.9%
51.2% 51.5%
75%
49.8% 50.1% 50.4%
50.6% 50.9%
65%
49.3% 49.5% 49.8%
50.1% 50.4%
55%
48.7% 49.0% 49.3%
49.5% 49.8%
Margin
(mil)
95% 5.4
6.1 6.7
7.3 7.9
85% 4.2
4.8 5.4
6.0 6.6
75% 3.0
3.6 4.2
4.8 5.3
65% 1.7
2.3 2.9
3.5 4.1
55% 0.5
1.1 1.6
2.2 2.8
______________________________________________________________
Florida 2000 Uncounted
Votes by County
Bush was leading by 537 votes when the recount was aborted by the Supreme Court. A full count of 175,010 spoiled ballots indicated that Gore won Florida by a minimum of 80,000 votes. Of the spoiled ballots, 54% were in black districts where Gore won 91% of the vote. Assuming the other 46% were evenly split between Gore and Bush, then a simple calculation shows that approximately 126,000 (72%) were Gore votes. In addition, thousands of Gore voters mistakenly voted for Buchanan in Palm Beach County, due to the infamous “Butterfly” ballot. Buchanan's vote share was 0.80% in PBC and 0.25% in the other counties.
Final Recorded
Vote
Gore 2,912,253
Bush 2,912,790
Nader 97,488
Buchanan 17,021
Other
23,558
Total
5,963,110
County
Recorded
Vote
County
Precincts Total Gore
Bush Buchanan
Nader Other Gore
Bush Buchanan
Nader
Totals
5884 5963
2912 2913
17 97
24 48.83% 48.85%
0.29% 1.63%
Alachua
53
86 47
34 0
3
1 55.2%
39.8% 0.3%
3.8%
Baker
8
8
2
6 0
0
0 29.3%
68.8% 0.9%
0.6%
Bay
47
59 19
39
0
1 0
32.1% 65.7%
0.4% 1.4%
Bradford
21
9
3
5 0
0
0 35.5%
62.4% 0.7%
1.0%
Brevard
177
218 97
115 1
4
1 44.6%
52.7% 0.3%
2.0%
Broward
618
573 387
177 1
7
2 67.4%
30.9% 0.1%
1.2%
Calhoun
13
5
2
3 0
0
0 41.7%
55.5% 1.7%
0.8%
Charlotte
63
67 30
35
0 1
0 44.3%
53.0% 0.3%
2.2%
Citrus
35
57 26
30 0
1
0 44.6%
52.0% 0.5%
2.4%
Clay
51
57 15
42 0
1
0 25.5%
72.8% 0.3%
1.0%
Collier
96
92 30
60 0
1
0 32.5%
65.6% 0.1%
1.5%
Columbia
31
19
7
11 0
0
0 38.1%
59.2% 0.5%
1.4%
Miami-Dade
614
625 329
290 1
5
1 52.6%
46.3% 0.1%
0.9%
DeSoto
15
8
3
4
0
0
0 42.5%
54.5% 0.5%
2.0%
Dixie
11
5
2
3 0
0
0 39.1%
57.8% 0.6%
1.6%
Duval
268
265 108
152 1
3
1 40.8%
57.5% 0.2%
1.0%
Escambia
108
117 41
73
1 2
0 35.1%
62.6% 0.4%
1.5%
Flagler
27
27 14
13 0
0
0 51.3%
46.5% 0.3%
1.6%
Franklin
8
5
2
2 0
0
0 44.1%
52.8% 0.7%
1.8%
Gadsden
16
15 10
5 0
0
0 66.1%
32.4% 0.3%
0.9%
Gilchrist
10
5
2
3 0
0
0 35.4%
61.2% 0.5%
1.8%
Glades
13
3
1
2 0
0
0 42.9%
54.7% 0.3%
1.7%
Gulf
14
6
2
4 0
0
0 39.0%
57.8% 1.2%
1.4%
Hamilton
8
4
2
2 0
0
0 43.4%
54.1% 0.6%
0.9%
Hardee
12
6
2
4
0
0
0 37.5%
60.4% 0.5%
1.2%
Hendry
22
8
3
5 0
0
0 39.8%
58.3% 0.3%
1.3%
Hernando
51
65 33
31
0
2
0 50.1%
47.0% 0.4%
2.3%
Highlands
28
35 14
20
0 1
0 40.3%
57.5% 0.4%
1.6%
Hillsboro
320
360 170
181 1 7
2 47.1%
50.2% 0.2%
2.1%
Holmes
16
7
2
5 0
0
0 29.4%
67.8% 1.0%
1.3%
Indian River
41 50
20 29
0 1
0 39.8%
57.7% 0.2%
1.9%
Jackson
27
16
7
9 0
0
0 42.1%
56.1% 0.6%
0.8%
Jefferson
13
6
3
2 0
0
0 53.9%
43.9% 0.5%
1.3%
Lafayette
5
3
1
2 0
0
0 31.5%
66.7% 0.4%
1.0%
Lake
86
89 37
50 0
1
0 41.3%
56.5% 0.3%
1.6%
Lee
150
184 74
106 0
4 1
39.9% 57.6%
0.2% 1.9%
Leon
95
103 61
39 0
2
0 59.6%
37.9% 0.3%
1.9%
Levy
21
13 5
7
0
0
0 42.4%
53.9% 0.5%
2.2%
Liberty
8
2
1
1 0
0
0 42.2%
54.6% 1.6%
0.8%
Madison
11
6
3
3 0
0
0 48.9%
49.3% 0.5%
0.9%
Manatee
135
110 49
58
0 2
0 44.6%
52.6% 0.2%
2.3%
Marion
96
103 45
55 1
2
1 43.4%
53.6% 0.5%
1.8%
Martin
40
62 27
34 0
1
0 42.9%
54.8% 0.2%
1.8%
Monroe
33
34 16
16 0
1
0 48.7%
47.4% 0.1%
3.2%
Nassau
21
24
7
16 0
0
0 29.2%
69.0% 0.4%
1.1%
Okaloosa
48
71 17
52
0 1
0 24.0%
73.7% 0.4%
1.4%
Okeechobee
18 10
5
5
0
0
0 46.6%
51.3% 0.4%
1.3%
Orange
232
280 140
135 0
4
1 50.1%
48.1% 0.0%
1.4%
Osceola
66
56 28
26
0
1
0 50.6%
47.1% 0.3%
1.3%
Palm Beach
531
433 270
153 3
6
2 62.3%
35.3% 0.8%
1.3%
Pasco
132
143 70
69 1
3
1 48.7%
48.0% 0.4%
2.4%
Pinellas
345
398 201
185 1
10
2 50.3%
46.4% 0.3%
2.5%
Polk
163
169 75
90 1
2
1 44.6%
53.6% 0.3%
1.2%
Putnam
50
26 12
13 0
0
0 46.2%
51.3% 0.6%
1.4%
St. Johns
57
61 20
40
0 1
0 32.1%
65.1% 0.4%
2.0%
St. Lucie
78
78 42
35
0 1
0 53.3%
44.5% 0.2%
1.8%
Santa Rosa
36
50 13
36
0 1
0 25.4%
72.1% 0.6%
1.4%
Sarasota
142
161 73
83
0
4 1
45.3% 51.6%
0.2% 2.5%
Seminole
133
138 59
76
0 2
1 43.0%
55.0% 0.1%
1.4%
Sumter
24
22 10
12
0
0
0 43.3%
54.5% 0.5%
1.4%
Suwannee
16
12
4
8 0
0
0 32.8%
64.4% 0.9%
1.4%
Taylor
14
7
3
4 0
0
0 38.9%
59.6% 0.4%
0.9%
Union
11
4
1
2 0
0
0 36.8%
61.0% 0.9%
0.9%
Volusia
172
184 97
82
0 3
1 53.0%
44.8% 0.3%
1.6%
Wakulla
12
9
4
5 0
0
0 44.7%
52.5% 0.5%
1.7%
Walton
33
18
6
12 0
0
0 30.8%
66.5% 0.7%
1.4%
Washington
15
8
3
5
0
0
0 34.9%
62.3% 1.1%
1.2%
Uncounted
Votes (thousands:
Votes
Share
Gore 126.3
72.1%
Bush
45.0 25.7
Nader
2.6 1.5
Buchanan 0.5 0.3
Other
0.7 0.4
Total 175.0 (2.85% of 6138k)
Unctd Adj
Unctd% Adjusted Count (total votes
cast) Adjusted Vote Share
County
Total
Total Adj Gore
Bush Buch Nader
Other Gore Bush
Totals
175
6138 2.85%
3039 2958
18 100
23 49.51% 48.19%
Alachua
0.33
86 0.38%
48
34 0.3 3.2
0.8 55.3% 39.8%
Baker
0.14
8 1.69%
2
6 0.1
0.1 0.0
30.1% 68.1%
Bay
0.66
59 1.11%
19
39 0.2 0.8
0.2 32.5% 65.3%
Bradford
0.73
9 7.80%
4
6 0.1
0.1 0.0
38.3% 59.6%
Brevard
1.03
219 0.47%
98 115
0.6 4.5 0.9
44.7% 52.6%
Broward
14.61
588 2.48%
397 181 0.8
7.3 1.7
67.5% 30.8%
Calhoun
0.08
5 1.49%
2
3 0.1
0.0 0.0
42.1% 55.1%
Charlotte
3.16
70 4.51%
32
36 0.2 1.5
0.2 45.6% 51.7%
Citrus
0.22
57 0.38%
26
30 0.3 1.4
0.3 44.7% 51.9%
Clay
0.15 58
0.27% 15 42
0.2 0.6 0.2
25.6% 72.6%
Collier
3.18
95 3.34%
32
61 0.1 1.4
0.3 33.8% 64.3%
Columbia
0.69
19 3.61%
8
11 0.1 0.3
0.2 39.3% 58.0%
Miami-Dade
28.60
654 4.37%
349 297 0.6
5.8 1.3
53.4% 45.4%
DeSoto
0.70
9 8.24%
4
4 0.0
0.2 0.0
45.0% 52.2%
Dixie
0.33
5 6.64%
2
3 0.0
0.1 0.0
41.3% 55.7%
Duval
26.91
292 9.23%
127 159 0.7
3.2 1.4
43.7% 54.5%
Escambia
4.37
121 3.61%
44
74 0.5 1.8
0.5 36.4% 61.3%
Flagler
0.06
27 0.23%
14
13 0.1 0.4
0.1 51.3% 46.5%
Franklin
0.42
5 8.28%
2
3 0.0
0.1 0.0
46.4% 50.6%
Gadsden
2.07
17 12.3%
11
5 0.0
0.2 0.1
66.8% 31.5%
Gilchrist
0.29
6 5.07%
2
3 0.0
0.1 0.1
37.3% 59.4%
Glades
0.37
4 9.98%
2
2 0.0
0.1 0.0
45.8% 51.8%
Gulf
0.41 7
6.27% 3
4 0.1
0.1 0.0
41.1% 55.8%
Hamilton
0.39
4 8.94%
2
2 0.0
0.0 0.0
46.0% 51.6%
Hardee
0.41
7 6.14%
3
4 0.0
0.1 0.0 39.7%
58.3%
Hendry
0.80
9 8.95%
4
5 0.0
0.1 0.0
42.7% 55.4%
Hernando
0.25
65 0.38%
33
31 0.2 1.5
0.2 50.1% 46.9%
Highlands
1.01
36 2.79%
15
20 0.1 0.6
0.1 41.2% 56.6%
Hillsboro
9.17
369 2.48%
176 183 0.9
7.6 1.7
47.7% 49.6%
Holmes
0.14
8 1.84%
2
5 0.1
0.1 0.0
30.2% 67.0%
Indian River
1.94 52
3.76% 21
29 0.1 1.0
0.2 41.1% 56.5%
Jackson
1.16
17 6.63%
8
9 0.1
0.2 0.1
44.1% 54.0%
Jefferson
0.57
6 9.22%
3
3 0.0
0.1 0.0
55.6% 42.2%
Lafayette
0.17
3 6.39%
1
2 0.0
0.0 0.0
34.1% 64.0%
Lake
3.61
92 3.92%
39
51 0.3 1.5
0.3 42.5% 55.2%
Lee
4.57
189 2.42%
77 107
0.3 3.7 0.8
40.7% 56.8%
Leon
0.18
103 0.18%
62
39 0.3 1.9
0.4 59.6% 37.9%
Levy
0.76
13 5.64%
6
7 0.1
0.3 0.1
44.1% 52.3%
Liberty
0.19
3 7.24%
1
1 0.0
0.0 0.0
44.4% 52.6%
Madison
0.48
7 7.23%
3
3 0.0
0.1 0.0
50.6% 47.6%
Manatee
1.41
112 1.26%
50
58 0.3 2.5
0.3 45.0% 52.2%
Marion
3.35
106 3.15%
47
56 0.6 1.9
0.8 44.3% 52.7%
Martin
0.61
63 0.97%
27
34 0.1 1.1
0.2 43.2% 54.5%
Monroe
0.18
34 0.53%
17
16 0.0 1.1
0.2 48.8% 47.3%
Nassau
1.58
25 6.28%
8
17 0.1 0.3
0.1 31.9% 66.3%
Okaloosa
0.77
71 1.07%
17
52 0.3 1.0
0.4 24.5% 73.2%
Okeechobee
0.86
11 8.01%
5
5 0.0 0.1
0.0 48.6% 49.3%
Orange
2.40
278 0.86%
142 135 0.0
3.9 1.1
50.3% 47.9%
Osceola
1.68
57 2.94%
29
27 0.1 0.8
0.4 51.3% 46.5%
Palm Beach
29.70
457 6.49%
291 161 3.5
6.0 1.6
62.9% 34.7%
Pasco
3.92
147 2.67%
72
70 0.6 3.5
0.6 49.4% 47.5%
Pinellas
8.49
407 2.09%
207 187 1.0
10.1 2.0
50.8% 46.0%
Polk
0.90
170 0.53%
76
91 0.5 2.1
0.5 44.7% 53.4%
Putnam
0.17
26 0.64%
12
13 0.1 0.4
0.1 46.3% 51.1%
St. Johns
3.24 64
5.06% 22
40 0.2 1.3
0.3 34.1% 63.1%
St. Lucie
0.34
78 0.43%
42
35 0.1 1.4
0.2 53.4% 44.4%
Santa Rosa
0.37
51 0.72%
13
36 0.3 0.7
0.2 25.8% 71.8%
Sarasota
0.56 162
0.35% 73
83 0.3 4.1
0.6 45.4% 51.5%
Seminole
0.65 138
0.47% 60
76 0.2 2.0
0.6 43.1% 54.8%
Sumter
0.76
23 3.31%
10
12 0.1 0.3
0.1 44.2% 53.5%
Suwannee
0.73 13
5.56% 5
8 0.1
0.2 0.1
34.9% 62.2%
Taylor
0.60
7 8.09%
3
4 0.0
0.1 0.0
41.6% 56.8%
Union
0.26
4 6.32%
2
2 0.0
0.0 0.0
39.0% 58.8%
Volusia
0.50
184 0.27%
98
82 0.5 2.9
0.6 53.0% 44.8%
Wakulla
0.42
9 4.68%
4
5 0.0
0.2 0.0
46.0% 51.3%
Walton
0.22
19 1.18%
6
12 0.1 0.3
0.1 31.3% 66.0%
Washington
0.33
8 3.94%
3 5
0.1 0.1 0.0
36.4% 60.8%
______________________________________________________________
2000 Recorded State Vote
(in thousands)
State
Gore Bush
Nader Other Total
Weight
Total
51,004 50,460 2,883
1,070 105,417
100%
Alabama
696
944 18
14 1,673
1.59%
Alaska
79 167
29 10
286 0.27%
Arizona
685
782 46
21 1,534
1.46%
Arkansas
423
473 13
13 922
0.87%
California
5,861 4,567
419 119
10,966 10.40%
Colorado
738
884 91
28 1,741
1.65%
Connecticut
816 561
64 18
1,460 1.38%
Delaware
180
137 8
2 328
0.31%
D.
C.
172 18
11
1 202
0.19%
Florida
2,912
2,913 97
41 5,963
5.66%
Georgia
1,116
1,420 13
47 2,597
2.46%
Hawaii
205
138 22
3 368
0.35%
Idaho
139 337
12 14
502 0.48%
Illinois
2,589
2,019 104
30 4,742
4.50%
Indiana
902
1,246 19
33 2,199
2.09%
Iowa
639 634
29 13
1,316 1.25%
Kansas
399
622 36
15 1,072
1.02%
Kentucky
639
872 23
10 1,544
1.46%
Louisiana
792 928
20 25
1,766 1.67%
Maine
320 287
37
8 652
0.62%
Maryland
1,146
814 54
12 2,025
1.92%
Massachusetts
1,616 879
174 34
2,703 2.56%
Michigan
2,170
1,953 84
25 4,233
4.02%
Minnesota
1,168 1,110
127 34
2,439 2.31%
Mississippi
405 573
8
9 995
0.94%
Missouri
1,111
1,190 39
20 2,360
2.24%
Montana
137
240 24
9 411
0.39%
Nebraska
232
434 25
7 697
0.66%
Nevada
280
302 15
12 609
0.58%
New Hampshire
266 274
22
7 569
0.54%
New
Jersey 1,789
1,284 95
20 3,187
3.02%
New
Mexico 287
286 21
4 599
0.57%
New York
4,108 2,403
244
67
6,823 6.47%
North Carolina
1,258 1,631
0
22 2,911
2.76%
North Dakota
95 175
9
9 288
0.27%
Ohio
2,186 2,351
118 50
4,705 4.46%
Oklahoma
474
744 0
16 1,234
1.17%
Oregon
720
714 77
23 1,534
1.46%
Pennsylvania
2,486 2,281 103
43 4,913
4.66%
Rhode Island
250 131
25
4 409
0.39%
South Carolina
566 786
20 11
1,384 1.31%
South Dakota
119 191
0
7 316
0.30%
Tennessee
982 1,062
20 13
2,076 1.97%
Texas
2,434 3,800
138 36
6,408 6.08%
Utah
203 515
36 17
771 0.73%
Vermont
149
120 20
5 294
0.28%
Virginia
1,217
1,437 59
25 2,739
2.60%
Washington
1,248 1,109
103 29
2,489 2.36%
West Virginia
295 336
11
5 648
0.61%
Wisconsin
1,243 1,237
94 24
2,599 2.47%
Wyoming
60 148
5
5 218
0.21%
2000 Recorded Vote vs. Exit Poll
Recorded
Exit
Poll 2-party
State
Gore Bush
Nader Other
WPE Gore Gore
Total
48.38% 47.87% 2.73%
1.02% -2.01 49.39% 51.31%
Alabama
41.6%
56.5% 1.1%
0.8% -5.5
44.3% 45.2%
Alaska
27.7%
58.6% 10.1%
3.6% 27.7% 32.1%
Arizona
44.7%
51.0% 3.0%
1.4% 44.7% 46.7%
Arkansas
45.9%
51.3% 1.5%
1.4% -3.2
47.5% 48.8%
California
53.4% 41.7%
3.8% 1.1%
-3.8 55.3% ; 58.2%
Colorado
42.4%
50.8% 5.3%
1.6% -5.6
45.2% 48.5%
Connecticut 55.9% 38.4%
4.4% 1.2%
-0.9 56.4% ; 59.7%
Delaware
55.0%
41.9% 2.5%
0.6% -7.1
58.5% 60.4%
D.
C. 85.2%
9.0% 5.2%
0.7% 85.2% 90.5%
Florida
48.8%
48.8% 1.6%
0.7% -0.6
49.1% 50.3%
Georgia
43.0%
54.7% 0.5%
1.8% -5.6
45.8% 46.9%
Hawaii
55.8%
37.5% 5.9%
0.9% 55.8% 59.8%
Idaho 27.6% 67.2%
2.5% 2.7%
2.5 26.4% 27.8%
Illinois
54.6%
42.6% 2.2%
0.6% -6.4
57.8% 59.5%
Indiana
41.0%
56.6% 0.8%
1.5% -3.6
42.8% 43.8%
Iowa 48.5% 48.2%
2.2% 1.0%
3.0 47.0% 48.6%
Kansas
37.2%
58.0% 3.4%
1.4% -4.4
39.4% 41.4%
Kentucky
41.4%
56.5% 1.5%
0.6% 4.4
39.2% 40.0%
Louisiana 44.9% 52.6%
1.2% 1.4%
-0.6 45.2% ; 46.4%
Maine 49.1% 44.0%
5.7% 1.2%
-2.1 50.1% ; 53.9%
Maryland
56.6%
40.2% 2.7%
0.6% -4.3
58.7% 60.7%
Massachusetts
59.8% 32.5%
6.4% 1.3%
-4.3 62.0% ; 67.1%
Michigan
51.3% 46.1%
2.0% 0.6%
-2.2 52.4% ; 53.8%
Minnesota 47.9% 45.5%
5.2% 1.4%
0.5 47.7% 51.0%
Mississippi 40.7% 57.6%
0.8% 0.9%
-3.2 42.3% ; 43.0%
Missouri
47.1%
50.4% 1.6%
0.9% 1.8
46.2% 47.4%
Montana
33.4%
58.4% 5.9%
2.3% 3.2
31.8% 34.6%
Nebraska
33.3%
62.2% 3.5%
1.0% -4.1
35.3% 37.0%
Nevada
46.0% 49.5%
2.5% 2.0%
-6.0 49.0% ; 51.3%
New Hampshire
46.8% 48.1% 3.9%
1.2% -2.4
48.0% 50.6%
New
Jersey 56.1%
40.3% 3.0%
0.6% -0.4
56.3% 58.4%
New
Mexico 47.9%
47.8% 3.6%
0.7% 5.1
45.4% 47.4%
New York
60.2% 35.2%
3.6% 1.0%
-3.3 61.9% ; 64.8%
North Carolina
43.2% 56.0% 0.0%
0.8% -9.8 48.1%
48.5%
North Dakota
33.1% 60.7% 3.3%
3.0% 2.0
32.1% 34.2%
Ohio
46.5% 50.0% 2.5%
1.1% -1.0
47.0% 48.7%
Oklahoma
38.4%
60.3% 0.0%
1.3%
4.7 36.1% 36.5%
Oregon
47.0% 46.5%
5.0%
1.5% na 47.0%
50.2%
Pennsylvania
50.6% 46.4% 2.1%
0.9% -0.8
51.0% 52.6%
Rhode Island
61.0% 31.9% 6.1% 1.0%
-0.4 61.2% ; 65.9%
South Carolina
40.9% 56.8% 1.5%
0.8% -3.5
42.7% 43.6%
South Dakota
37.6% 60.3% 0.0%
2.1% -0.9
38.0% 38.8%
Tennessee
47.3% 51.1% 1.0%
0.6% 2.2
46.2% 46.9%
Texas
38.0% 59.3% 2.2%
0.6% -0.4
38.2% 39.2%
Utah
26.3% 66.8% 4.7%
2.2% 1.0
25.8% 27.7%
Vermont
50.6% 40.7%
6.9% 1.7%
0.4 50.4% 55.2%
Virginia
44.4% 52.5%
2.2% 0.9%
-2.0 45.4% ; 46.9%
Washington
50.1% 44.6% 4.1%
1.2% -3.7
52.0% 54.9%
West Virginia
45.6% 51.9% 1.6%
0.8% 4.5
43.3% 44.5%
Wisconsin
47.8% 47.6% 3.6%
0.9% 2.4
46.6% 48.9%
Wyoming
27.7% 67.8%
2.1% 2.4%
-1.0 28.2% ; 29.5%
________________________________________________________________________________________
Smoking Gun: The Final National Exit
Poll
The Final 2004 National Exit Poll (NEP) is the smoking gun of election fraud. The NEP has always been matched to the recorded vote on the assumption that it is accurate. But in every election millions of votes are cast but never counted-and most of them are Democratic. Therefore, it is immediately obvious that the recorded vote did not reflect the true vote. Uncounted votes are a combination of spoiled, absentee and provisional ballots. Florida 2000 and Ohio 2004 are obvious examples. In addition to these uncounted votes, we will show that millions of votes must have been switched from Kerry to Bush.
The Final NEP was forced to match the recorded vote by adjusting the “How Voted in 2000” weights to Bush 43/Gore 37%. The Bush 43% weighting is impossible since it implies that 52.59mm of the recorded 2004 total of 122.3m voted for Bush in 2000. But this is 2.13m more than
his 50.46mm recorded vote. And it’s 3.9m more than the 48.7mm Bush 2000 voters who were living in 2004. Furthermore, since some Bush 2000 voters did not vote in 2004, his true weighting had to be lower than 39.8%.
If we assume a 95% turnout (46.27mm) of Bush 2000 voters in 2004, the Bush weighting is reduced to a feasible 37.8% (46.27/122.3). Since impossible weights were required in order to match the recorded vote, the only logical conclusion is that the recorded vote must also have been impossible. The weights become Bush 37.0/Kerry 37.4% when they are calculated based on the Census 2004 total of 125.7 million votes cast (assuming a 95% turnout and 3.0% mortality rate).
Other (third-party) shares of both new (DNV2k) and Gore voters declined to near zero in the Final, reducing the vote from 1.2 to 0.50 million. The recorded third-party vote was 1.23mm (1.0%). This discrepancy accounts for the difference between the (62.0-59.0 million) recorded vote and the Final NEP (62.5-59.3).
Kerry won the 12:22am National Exit Poll (13047 respondents) by a 4.6mm vote margin.
Bush won the 2:04pm Final National Exit Poll (13660 respondents) by a 3.2mm margin.
Final recorded
vote count
Kerry
Bush Other
48.27%
50.73% 1.01%
59.03
62.04 1.23
National
Exit Poll
12:22am (13047 respondents)
2pm Final (13660
respondents)
Voted2k
Weight Kerry Bush
Other Weight
Kerry Bush Other
DNV2k
17% 57%
41% 2%
17% 54%
45% 1%
Gore
39% 91%
8% 1%
37% 90% 10%
0%
Bush
41% 10%
90% 0%
43% 9%
91% 0%
Other
3% 71%
21% 8%
3% 71%
21% 8%
Share
100% 51.41% 47.62%
0.97% 100% 48.48%
51.11% 0.41%
Votes
122.3 62.87 58.24
1.19 122.3 59.29
62.50 0.50
_________________________________________________________
Election Calculator Model
Assumptions:
1) 1222am NEP: (13047 respondents)
2) 2000 voter turnout in 2004: 95%
3) Census: 125.7m votes cast in 2004 vs. 122.3m recorded; 3.4m (2.74%) uncounted
4) Census: 110.8m votes cast in 2000 vs. 105.4m recorded; 5.4m (4.86%) uncounted
5) Annual voter mortality: 1.22% (4.88% over 4 years)
2000
Recorded
Voted
Recd Unctd
Cast Died Alive
Gore
51.00 4.04 55.04
2.72 52.32
Bush
50.46 1.08 51.53
2.48 49.06
Other
3.96 0.27
4.23 0.21 4.02
Total
105.42 5.38 110.8
5.41 105.39
2004 Calculated
Turnout
Voted Weight Kerry Bush
Other
DNV
- &nnbsp;25.61 20.4%
57% 41% 2%
Gore
95% 49.70
39.5% 91%
8% 1%
Bush
95% 46.60
37.1% 10%
90% 0%
Other
95% 3.82
3.0% 64% 17%
19%
Total
100.1 125.7 100%
53.23% 45.39% 1.38%
66.94 57.07
1.74
Input assumptions: impact on vote shares
2000
Voter
Weights
Gore Bush Turnout
Mort Unctd
Kerry
1- Final NEP
37%
43% -
- &nbbsp; -
48.48%
2- 1222am NEP
39%
41% -
- &nbbsp;
- &nbbsp; 51.40%
Election Calculation Model
3- 2000 Voter Turnout
39.6% 39.2%
95% 0%
0% 52.26%
4- 2004 Unctd
Votes 38.5%
38.1% 95%
0% 2.74%
52.39%
5- 2000 Unctd
Votes 41.6%
38.9% 95%
0% 4.86%
53.06%
6- Voter
Mortality 39.5%
37.1% 95%
4.88% -
53.23%
___________________________________________________________________________________________________
The Democratic Underground “Game” Thread
In order to match the recorded vote in the Final National Exit Poll ”How Voted in 2000” category, the exit pollsters had to 1) use impossible Bush 43/ Gore 37 weights and 2) increase the Bush vote shares from the 12:22am NEP which Kerry won by 51.4-47.6%. Lindeman was challenged to provide a mathematically feasible and plausible Bush win scenario. It took him several months before he responded to the challenge in the famous Democratic Underground Game Thread.
In order to comply with the rules of the “game” by using feasible weights, Mark presented a spreadsheet to hypothesize how Bush achieved his 3 million vote “mandate”. He used feasible weights based on the recorded 2000 and 2004 vote, annual 0.87% mortality rate and estimated 95% turnout of 2000 voters. But Mark inflated the Bush vote shares over the Final NEP shares in order to match the recorded vote. Although the weightings were feasible, the inflated vote shares were implausible. He had no choice but to increase the already-inflated Bush vote shares even further beyond the corresponding 12:22am NEP timeline.
Mark’s implausible Bush win scenario was based on the following assumptions:
1) One in 7 (14.63%) Gore 2000 voters defected to Bush in 2004.
The 12:22am NEP reported 8% (10% in the 2pm Final).
2) Kerry won just 52.90% of DNV (new voters and others who did not vote in 2000).
The NEP reported 57% (54% in the Final).
3) Just 7.20% of Bush 2000 voters defected to Kerry.
The NEP reported 10% (9% in the Final).
On the other hand, the TIA True Vote model used feasible weights and plausible vote shares and calculated that Kerry won by a 52.6-46.4% - a 7.7 million vote landslide. The assumptions: 1) Only Gore, Bush and Nader 2000 voters still living could vote in 2004 (it took a while for the naysayers to see this), 2) 12:22am NEP vote shares, 3) 0.87% annual mortality, 4) 95% turnout of Gore, Bush and other 2000 voters, 5) 125.74m total votes cast (Census).
The mortality rate and 2000 voter turnout assumptions have minimal effect on the national vote share. Kerry wins easily regardless of the assumptions used. The 125.7m Census estimate does not change the NEP vote shares, but it provides a more accurate estimate of the True Vote count than the 122.3m recorded vote.
TIA True Vote Model
Lindeman
“Game” Model
Pct Kerry
Bush Other
Pct Kerry
Bush Other
DNV
21.49% 57%
41%
2%
21.72% 52.90% 46.50% 0.60%
Gore
38.23% 91%
8%
1%
37.84% 84.83% 14.63% 0.54%
Bush
37.83% 10%
90%
0%
37.44% 7.20% 92.31% 0.49%
Other
2.45% 71%
21%
8%
3.00% 65.90% 18.10% 16.00%
Share 100.00%
52.56% 46.43%
1.01%
100.00% 48.26% 50.74% 1.00%
Votes Kerry Bush
Other
Votes Kerry Bush
Other
DNV
27.02 15.40 11.08
0.54
26.56 14.05 12.35 0.16
Gore
48.07 43.74 3.85
0.48
46.28 39.26 6.77
0.25
Bush
47.57 4.76 42.81
0.00
45.79 3.30 42.27
0.22
Other
3.08 2.19
0.65
0.25
3.67 2.42 0.66
0.59
Total
125.74 66.09 58.38
1.27
122.30 59.02 62.05 1.22
Which scenario are we to believe: the implausible 14.63% Gore defection rate or the mathematically impossible 43 Bush/ 37 Gore weights? Was the exit poll match to the recorded vote based on a) plausible 37.84 Gore/ 37.44% Bush weights and an implausible 14.63% Gore defection rate, or b) impossible NEP 43 Bush/ 37% Gore weights and a plausible (8-10%) Gore defection rate?
Lindeman had to replace the debunked reluctant Bush responder (rBr) hypothesis with “false recall”. He cited a post-election NES 600-sample survey to account for the impossible Final Bush/Gore weights. He wanted to have it both ways: On the one hand, he said the 43/37 weights were legitimate exit poll samples in which Gore voters lied; on the other hand, he contradicted his Bush win scenario by using feasible weights applied to the implausible 14.6% Gore defection rate. But it was a very weak argument because it implied that approximately 6.6% of Gore voters (8.6% over the 12:22am NEP defection rate) misrepresented their vote when they told the exit pollsters they voted for Bush in 2000. The reason: a long-term bandwagon effect: Gore voters wanted to associate with the “winner”.
But “false recall” is not a plausible explanation since a) Gore won by 540,000 votes, b) according to the pristine 12:22am NEP, Kerry captured 91% of Gore voters and 10% of Bush voters, c) Bush had a 48.5% approval rating on Election Day, d) false recall is not applicable to pre-election polls and e) the pre-election polls matched the exit polls.
Why would Gore voters want to be associated with Bush? Even if returning Gore voters lied about their vote in 2000, it’s irrelevant. What is relevant is a) their factual 2000 recorded Gore vote and b) that 91% said they just voted for Kerry. We use this factual data to compute feasible and plausible weights by adjusting the 2000 recorded vote for mortality and estimated 2004 turnout.
False recall cannot be used as an explanation to explain the other demographic weightings. In the 12:22am NEP, 13047respondents were asked whom they had just voted for – and Kerry won. But only 3200 respondents were asked how they voted in 2000. Kerry must have also won the 10,000 who were not asked how they voted in 2000. This fact alone totally contradicts the “false recall” argument. Why would respondents lie to the exit pollsters and claim to have voted for Kerry if they voted for Bush? Did they also lie about their gender? Kerry won the Gender demographic by 50.78-48.22%.
GENDER
Weight Kerry Bush Other
Male
46% 47%
52% 1%
Female
54% 54%
45% 1%
Share
100% 50.78% 48.22% 1.00%
Votes
122.3 62.10 58.97 1.22
The 2000 and 2004 recorded vote and annual mortality rate are historical demographic facts. They are necessary and sufficient to determine the maximum number of Bush and Gore voters who could have voted in 2004. We already know the maximum: they are the Gore, Bush and Nader 2000 voters still alive to vote in 2004. But the maximum mathematically feasible weights must be reduced by 2000 voter turnout to obtain realistic, plausible weights. The weights are multiplied by the corresponding individual exit poll vote shares to calculate the national share. Therefore, the only exit poll response which matters is the answer to the question: Who did you vote for in 2004? It follows that even if "false recall" were a factor, it is irrelevant. Voters did not falsely recall who they voted forjust five minutes earlier. What would be their motivation to lie? Survey responses are confidential.
The probabilities of the Lindeman vote share deviations from the 12:22am NEP are near zero.
Voted
NEP Share Deviation
MoE Probability
DNV2k 57%
52.90% 4.10% 1.72%
1 in 629,000
Gore
91% 84.83% 6.17%
0.99% ZERO
Bush
10% 7.20% 2.80%
1.04% 1 in 15 million
DNV2k
Probability Calculation
StDev = sqrt (0.57 *
0.43/3200) = 0.0088
MoE = 1.96 *
StDev = 1.96 * 0.0088 = 1.72%
Z-score = Dev / StDev
= .041 / 0.0088 = 4.67
Probability = NORMDIST
(Share, NEP, StDev, true)
Prob (DNV2k) = NORMDIST
(.529, .57, 0.0088, true) = 1 in 629,000
Prob (Gore) = NORMDIST
(.848, .91, 0.0051, true) = ZERO
Prob (Bush) = NORMDIST
(.720, .10, 0.0053, true) = 1 in 15 million
___________________________________________________________________________
Implausible Gore Voter Defection
Bush required 21% of Gore voters in order to match his 2004 vote share
This analysis shows that for Bush to obtain his 3 million "mandate", he needed 21% of former Gore voters. According to the Final NEP (which was forced to match the recorded vote), he had 10%.
These are the facts:
There were 105.42m recorded votes in 2000.
Gore won by 51.00-50.46m or 48.4-47.9% (3.95m for Nader/other).
There were 122.3m recorded votes in 2004.
Bush won by 62.04-59.03m or 50.7-48.3% (1.22m for Nader/other).
These are the assumptions:
Of the 105.4m who voted in 2000, approximately
1) 5.3m died (1.25% annual voter mortality)
2) 5.0m did not return to vote in 2004 (95% turnout)
There were
approximately 95.1m returning 2000 voters in 2004.
Assuming an equal 95% turnout of 2000 voters in 2004, 46.0m were former Gore, 45.5m Bush and 3.6m Nader/other voters. According to the Census Bureau, 125.7m votes were cast in 2004 (3.4m were uncounted).
There were
approximately 30.6 million new voters in 2004!
According to the 12:22am National Exit Poll:
1) Kerry won 57% (17.4m) of new voters;
Bush won 41% (12.5m)
2) Kerry won 64% (2.3m) of returning Nader/others;
Bush won 17% (0.6m)
3) Kerry won 10% (4.6m) of returning Bush voters;
Bush won 90% (41.0m) of returning Bush voters.
4) Kerry won 91% (41.9m) of returning Gore voters;
Bush won 8% (3.7m) of returning Gore voters
If you believe that
the vote shares for 1,2,3 above are accurate, and that Bush did in fact win by
3 million votes, then you must also believe that Bush won 9.7m of 46.0m (21%)
Gore voters.
Approximately 3200 of 13047 respondents were asked how they voted in 2000. The
exit poll vote discrepancy was 13% (21-8%). Assuming a 30% "cluster
effect", the margin of error is 2.3%. The probability of a 13% vote
discrepancy is ZERO.
So why would you believe that 21% of Gore voters defected to
Bush while only 10% of Bush voters defected to Kerry?
On the other hand, if you believe that
the vote shares in 4) are also accurate and that Bush won just 8% of returning
Gore voters, then you must believe that Kerry won the True Vote by over 8
million.
The True Vote is calculated as:Kerry = 91% of Gore + 10% of Bush +57% of New +64% of Other (Nader et al)Bush = 90% of Bush + 8% of Gore +41% of New +17% of Other Kerry = 66.2m (52.6%) = 41.9 + 4.6 + 17.4 +2.3 Bush = 57.8m (46.0%) = 41.0 + 3.7 + 12.5 +0.6 _________________________________________________________ Assumptions:12:22am NEP with adjusted Gore vote shares Feasible weights based on 1.25% annual voter mortality and 95% turnout of 2000 voters in 2004. Census total votes cast: 125.7m Vote share Votes (mil) Turnout Voted Mix Kerry Bush Other Kerry Bush Other DNV na 30.6 24.3% 57% 41% 2% 17.4 12.5 0.6 Gore 95% 46.0 36.6% 78% 21% 1% 35.9 9.7 0.5 Bush 95% 45.5 36.2% 10% 90% 0% 4.6 41.0 0.0 Other 95% 3.6 2.8% 64% 17% 19% 2.3 0.6 0.7 Total 100.1 125.7 100% 47.9% 50.7% 1.4% 60.2 63.8 1.8 Calculation of the True VoteAssumptions:Same as above but use actual 12:22am NEP vote shares Kerry wins by 8.4m votes Vote share Votes (mil) Turnout Voted Mix Kerry Bush Other Kerry Bush Other DNV na 30.6 24.3% 57% 41% 2% 17.4 12.5 0.6 Gore 95% 46.0 36.6% 91% 8% 1% 41.9 3.7 0.5 Bush 95% 45.5 36.2% 10% 90% 0% 4.6 41.0 0.0 Other 95% 3.6 2.8% 64% 17% 19% 2.3 0.6 0.7 Total 100.15 125.7 100% 52.6% 46.0% 1.4% 66.2 57.8 1.8 Sensitivity Analysis Calculate Kerry's vote share over a range of new and returning Gore vote shares. The True Vote scenario is the most-likely base case. Kerry Kerry Share of New voters (DNV in 2000) %Gore 53.0% 55.0% 57.0% 59.0% 61.0% Kerry Vote share95% 53.1% 53.6% 54.1% 54.6% 55.1%93% 52.4% 52.9% 53.4% 53.8% 54.3%91% 51.7% 52.1% 52.6% 53.1% 53.6%89% 50.9% 51.4% 51.9% 52.4% 52.9%87% 50.2% 50.7% 51.2% 51.6% 52.1% Kerry Margin (millions) 95% 9.6 10.8 12.1 13.3 14.5 93% 7.8 9.0 10.2 11.4 12.7 91% 5.9 7.1 8.4 9.6 10.8 89% 4.1 5.3 6.5 7.7 9.0 87% 2.2 3.5 4.7 5.9 7.1 _________________________________________________________ 2004 National Exit Poll (12:22am Composite)(13047 respondents) 122.3m recorded votes Kerry wins by 4.5m votes Vote share Votes (mil) Voted Mix Kerry Bush Other Kerry Bush OtherDNV 20.8 17% 57% 41% 2% 11.9 8.5 0.4 Gore 47.7 39% 91% 8% 1% 43.4 3.8 0.5 Bush 50.1 41% 10% 90% 0% 5.0 45.1 0.0 Other 3.7 3% 64% 17% 19% 2.3 0.6 0.7 Total 122.3 100% 51.2% 47.5% 1.3% 62.6 58.1 1.6 ______________________________________________________________ 2004 Final Exit Poll (forced to match the recorded vote)(13660 respondents) Bush wins by 2.8m votes Vote share Votes (mil) Voted Mix Kerry Bush Other Kerry Bush OtherDNV 20.8 17% 54% 45% 1% 11.2 9.4 0.2 Gore 45.3 37% 90% 9% 1% 40.7 4.1 0.5 Bush 52.6 43% 9% 91% 0% 4.7 47.9 0.0 Other 3.7 3% 71% 21% 8% 2.6 0.8 0.3 Total 122.3 100% 48.5% 50.7% 0.8% 59.3 62.1 1.0
___________________________________________________________________________
Implausible Gore 2000 Voter Turnout in 2004 Required
to Match the Recorded Vote
To believe that Bush
won by 3 million votes in 2004, you must also believe that 60% of Gore voters
returned to the polls as opposed to 95% of Bush voters.
Objective:
Determine Gore 2000 voter turnout in 2004 required to match the recorded
vote.
Data
2000 recorded vote: 105.4m
2004 recorded vote: 122.3m
2004 Census total votes cast: 125.7m
2004 National Exit Poll (12:22am Composite)
Assumptions
1.25% Annual voter mortality
95% turnout of Bush 2000 voters in 2004
Conclusions
To match the recorded 2004 vote, you must
believe that only 60% of Gore 2000 voters turned out to vote .You must believe
that 29 million Gore voters and 45 million Bush voters returned to vote in
2004. A 16 million excess of returning Bush voters is implausible. Therefore,
so is the official vote. But saying the official vote is “ implausible” is an
understatement. The official election results are bogus. Kerry did not lose by
3 million votes. He won by 8-10 million votes. And that is plausible if you
just crunch the numbers. Read on.
Maximum number of 2000 voters who could have voted in 2004
2000 Voted Died Alive
Gore 51.00 2.53 48.47
Bush 50.46 2.54 47.91
Other 3.96 0.20 3.76
Total 105.42
5.27 100.15
Implausible Scenario
60% Gore voter turnout
Bush wins by 3.3 million votes
Turnout Voted Mix Kerry Bush Other
DNV
- 47.6 37.8% 57% 41% 2%
Gore 60% 29.0 23.1% 91% 9% 0%
Bush 95% 45.5 36.2% 10% 90% 0%
Other 95% 3.6 2.8% 64% 17% 19%
Total
78.2 125.7 100% 48.1% 50.7% 1.2%
125.7 60.4 63.7 1.6
Plausible “True Vote” Scenario
95% Gore voter turnout
Kerry wins by 8.0 million votes
Turnout Voted Mix Kerry Bush Other
DNV -
30.6 24.3% 57% 41% 2%
Gore 95% 46.0 36.6% 91% 9% 0%
Bush 95% 45.5 36.2% 10% 90% 0%
Other 95% 3.6 2.8% 64% 17% 19%
Total 95.1 125.7 100% 52.6% 46.4% 1.0%
125.7 66.2 58.2 1.3
Sensitivity Analysis
Kerry
wins all scenarios in which Gore voter turnout is 76% or greater.
Scenario I: 95% Bush 2000 voter turnout vs. 76% Gore voter turnout
Kerry wins by 1.8m - a 50.1% share.
Scenario II: 99% Bush vs. 92% Gore turnout
Kerry wins by 5.1m - a 51.5% share.
Scenario III: 95% Bush vs. 92% Gore turnout
Kerry wins by 7.0m votes - a 52.2% vote
share.
Scenario IV: 91% Bush vs. 92% Gore turnout
Kerry wins by 8.8m - a 53.0% share.
Bush2k Gore Voter Turnout in 2004
Voter 60.0% 68.0% 76.0% 84.0% 92.0%
Turnout
in'04
Kerry National Vote
91% 48.8% 49.8% 50.9% 51.9% 53.0%
93% 48.4% 49.5% 50.5% 51.6% 52.6%
95% 48.0% 49.1% 50.1% 51.2% 52.2%
97% 47.7% 48.7% 49.8% 50.8% 51.9%
99% 47.3% 48.4% 49.4% 50.5% 51.5%
Kerry Margin (millions)
91% (1.4) 1.1 3.7 6.2 8.8
93% (2.4) 0.2 2.8 5.3 7.9
95% (3.3) (0.7) 1.8 4.4 7.0
97% (4.2) (1.6) 0.9 3.5 6.0
99% (5.1) (2.6) 0.0 2.6 5.1
Sensitivity Analysis I
Weights based on adjusted 2000 recorded
vote / 2004 recorded vote
Adjusted 2000 recorded vote: reduce by
3.5% mortality; assume 95% turnout
Kerry wins by 52.6-46.4% (66.1-58.4
million).
Voted2k
Votes Weight Kerry
Bush Other
DNV
27.02 21.49% 57%
41% 2%
Gore
48.08 38.23% 91%
8% 1%
Bush
47.56 37.82% 10%
90% 0%
Other
3.08 2.46%
71% 21%
8%
Share
Total 100.0% 52.56% 46.43%
1.0%
Votes
125.74 125.74 66.09
58.38 1.27
Gore
for
DNV2k for
Kerry
Kerry
51.0% 52.0% 53.0%
54.0% 55.0% 56.0% 57.0%
Kerry Vote Share
85%
49.0% 49.2% 49.4%
49.6% 49.8% 50.1% 50.3%
86%
49.4% 49.6% 49.8%
50.0% 50.2% 50.4% 50.7%
87%
49.7% 50.0% 50.2%
50.4% 50.6% 50.8% 51.0%
88%
50.1% 50.3% 50.6%
50.8% 51.0% 51.2% 51.4%
89%
50.5% 50.7% 50.9%
51.2% 51.4% 51.6% 51.8%
90%
50.9% 51.1% 51.3%
51.5% 51.8% 52.0% 52.2%
91%
51.3% 51.5% 51.7%
51.9% 52.1% 52.3% 52.56%
Gore
for
Bush 2000 voters for
Kerry
Kerry
7.0% 7.5%
8.0% 8.5%
9.0% 9.5% 10.0%
Kerry Vote Share
85%
49.1% 49.3% 49.5%
49.7% 49.9% 50.1% 50.3%
86%
49.5% 49.7% 49.9%
50.1% 50.3% 50.5% 50.7%
87%
49.9% 50.1% 50.3%
50.5% 50.7% 50.8% 51.0%
88%
50.3% 50.5% 50.7%
50.9% 51.0% 51.2% 51.4%
89%
50.7% 50.9% 51.0%
51.2% 51.4% 51.6% 51.8%
90%
51.0% 51.2% 51.4% 51.6%
51.8% 52.0% 52.2%
91%
51.4% 51.6% 51.8%
52.0% 52.2% 52.4% 52.56%
___________________________________________________________________________
Sensitivity Analysis II
Weights based on adjusted 2000 recorded
vote / 2004 total votes cast
Adjusted 2000 recorded vote: reduce by
3% mortality; assume 95% turnout
Kerry wins by 52.7-46.3% (66.2-58.2
million).
Voted2k
Votes Weight Kerry
Bush Other
DNV 29.22
23.24% 57%
41% 2%
Gore
47.00 37.38%
91% 8% 1%
Bush
46.50 36.98%
10% 90% 0%
Other
3.02 2.40%
71% 21% 8%
Total
100%
52.66% 46.31% 1.03%
125.74 125.74 66.22
58.22 1.30
Gore
for
DNV2k for
Kerry
Kerry
51.0% 52.0% 53.0%
54.0% 55.0% 56.0% 57.0%
Kerry
Vote Share
85%
49.0% 49.3% 49.5%
49.7% 50.0% 50.2% 50.4%
86%
49.4% 49.6% 49.9%
50.1% 50.3% 50.6% 50.8%
87%
49.8% 50.0% 50.2%
50.5% 50.7% 50.9% 51.2%
88%
50.1% 50.4% 50.6%
50.8% 51.1% 51.3% 51.5%
89%
50.5% 50.8% 51.0%
51.2% 51.5% 51.7% 51.9%
90%
50.9% 51.1% 51.4%
51.6% 51.8% 52.1% 52.3%
91%
51.3% 51.5% 51.7%
52.0% 52.2% 52.4% 52.66%
Gore
for
Bush 2000 voters
for Kerry
Kerry
6.0% 7.0%
8.0% 9.0%
10.0% 11.0% 12.0%
Kerry
Vote Share
85%
48.9% 49.3% 49.7%
50.1% 50.4% 50.8% 51.2%
86%
49.3% 49.7% 50.1%
50.4% 50.8% 51.2% 51.5%
87%
49.7% 50.1% 50.4%
50.8% 51.2% 51.5% 51.9%
88%
50.1% 50.4% 50.8%
51.2% 51.5% 51.9% 52.3%
89%
50.4% 50.8% 51.2% 51.5%
51.9% 52.3% 52.7%
90%
50.8% 51.2% 51.6%
51.9% 52.3% 52.7% 53.0%
91%
51.2% 51.6% 51.9%
52.3% 52.66% 53.0% 53.4%
___________________________________________________________________________
Sensitivity Analysis III – Uncounted and
Switched Vote Rates
Uncounted Votes: 3.45mm (2.74%) of 125.74mm cast
Uncounted share: Kerry 75%/ Bush 24%/ Other 1%
Switched-votes:
4.49mm (6.8%) of 66.1mm Kerry total votes cast
Base case: True Vote = Recorded + Uncounted + Switched
Kerry Bush
Other
Total
Kerry Bush Other
Recorded
59.03 62.04 1.23
122.30
48.27% 50.73% 1.00%
Uncounted 2.58
0.83 0.03
3.45
2.06% 0.66% 0.03%
Cast
61.61
62.87 1.26
125.74
49.00% 50.00% 1.00%
Switched
4.49 -4.49
0.00
0.00
3.57% -3.57% 0.00%
True
66.10 58.38 1.26
125.74
52.57% 46.43% 1.00%
Exit Poll 65.13
59.35
0.88
125.74
51.80% 47.20% 1.00%
Unctd
Switched
Kerry
Dem%
0.0% 1.0%
2.0% 3.0%
4.0% 5.0%
6.0% 7.0%
0%
48.3% 48.7% 49.2%
49.7% 50.2% 50.7%
51.2% 51.6%
1%
48.5% 49.0% 49.5%
50.0% 50.5% 51.0%
51.4% 51.9%
2%
48.8% 49.3% 49.8%
50.3% 50.8% 51.2%
51.7% 52.2%
3%
49.1% 49.6% 50.0%
50.5% 51.0% 51.5% 52.0%
52.5%
4%
49.3% 49.8% 50.3%
50.8% 51.3% 51.8%
52.3% 52.8%
5%
49.6% 50.1% 50.6%
51.1% 51.6% 52.1%
52.6% 53.1%
___________________________________________________________________________________________________
State and National
Pre-election Polls
The Election Model: Monte Carlo
Electoral Vote Simulation
The final state (weighted) pre-election poll averages were Kerry 47.88–
Bush 46.89%. The average of 18 national polls was nearly identical: 47.17-
46.89%. Assuming that Kerry would capture 75% of the undecided vote, the 2004 Election Model
Monte Carlo Simulation determined that that Kerry would win 337
electoral votes. His 2-party vote share was projected to be 51.8% with a 99.8%
EV win probability.
These graphs depict the 2004 projection trend:
Independent National Pollsters Monthly Average Trend
National State–weighted average Trend
Electoral and National Vote Projection Trend
Kerry Electoral Vote Frequency Histogram
___________________________________________________________________________________________________
National Pre-election Monthly Polling
Trend
http://www.pollingreport.com/wh04gen.htm
In the Nov.1 Election Model, Kerry led the final 18 national pre-election polls by 47.17-46.89%. Nine polls were registered voter (RV) and 9 were likely voter (LV). Kerry led in 11, Bush in 6. The final Election Day Zogby and Harris LV polls were not included in the Nov.1 election model. Both had Kerry winning by 50-47%. But that was before the allocation of undecided voters which Harris and Zogby said were breaking 2-1 to 4-1 for Kerry.
According to the 12:22am National Exit Poll (NEP) , Kerry won the 6% of voters who decided on Election Day by 53-40%; he won the 10% who decided in the final month by 60-38%. There is no doubt that Kerry won a solid majority of late undecided voters. The Election Model included a sensitivity analysis based on 5 undecided voter scenarios in which Kerry was projected to win 60, 67, 75, 80 and 87% of the undecided vote.
The following 2004 National Pre-election Polls Monthly Trend of projections assumes that 75% of undecided voters break for Kerry. Kerry led the pre-election poll average every month except for January and September. There was a near-perfect 0.87 statistical correlation between the Bush average monthly approval rating and polling share.
The Bush 48.5% average approval rating on Election Day is a key indicator of fraud, based on the following correlation analysis of pre-election national polls and the mysterious divergence of National Exit Poll approval weights from the average.
There was a near-perfect 0.87 statistical correlation between Bush’s average monthly approval rating and his average national pre-election poll.
Bush approval ratings
Date
Nwk Fox
CNN Pew
Harris CBS
ABC Time
NBC AP
Zogby Mean
Jan-04
50 58
60 56
na 50
58 54
54 56 49
54.4
Feb-04
48 48
51 48
51 50 50
54 na
47
na 49.5
Mar-04
48 48
49 46
na 51 50
na 50
48
na 48.8
Apr-04
49 50
52 48
48 46 51
49 na
48
47 48.6
May-04
42 48
47 44
na 41 47
46 47
48
42 45.2
Jun-04
na 48
49 48
50 42 47
na 45
48
46 47.0
Jul-04
48 47
47 46
na 45 50
50 48
50
49 47.8
Aug-04
45 51
51 46
48 46
50 51
47 49
44 48.0
Sep-04
48 50
52 46
45 48 50
53 47
54
47 49.1
Oct-04
46 49 46
44 na
49 53
53 49
47
49 48.5
National Pre-election polls vs. Bush approval
Average monthly pre-election polling
Jan Feb
Mar April
May June
July Aug Sept
Oct
Kerry
40.78 47.80 47.58
46.31 46.86 46.64
47.47 47.40 44.33 47.17
Bush
51.56 46.10 44.83
45.62 44.71 45.71
45.20 45.40 48.28 46.89
Average monthly approval
54.4 49.5 48.8
48.6 45.2
47.0 47.8 48.0
49.1 48.5
Projections (75% of undecided to Kerry)
Kerry
45.78 51.62 52.52
51.62 52.43 51.62 52.22
52.05 49.12 50.88
Bush
53.22 47.38 46.48
47.38 46.57 47.38
46.78 46.95 49.88 48.12
Other
1.00 1.00
1.00 1.00
1.00 1.00
1.00 1.00
1.00 1.00
2-party
Kerry
46.53 52.38 53.27
52.37 53.18 52.38
52.97 52.80 49.88 51.63
Bush
53.47 47.62 46.73
47.63 46.82 47.62
47.03 47.20 50.12 48.37
National Pre-election polls
and Kerry projected vote
TIPP
Kerry
na 44
45 40
43 43
46 44
46 44
Bush
na 41
43 44
42 44
43 44
45 45
Proj
na 54.5
53.3 51.3
53.5 52.0
53.5 52.3
52.0 51.5
ABC
Kerry
na 52
53 48
49 53
47 49
45 48
Bush
na 43
44 49
47 45
49 48
51 47
Proj
na 55.0
54.5 49.5
51.3 53.8
49.3 50.5
47.3 51.0
AP
Kerry
37 na
45 44
43 43
45 48
42 49
Bush
54 na
46 45
46 46
49 45
51 46
Proj
43.0 na
51.0 51.5
50.5 50.5
48.8 52.5
46.5 52.0
NWK
Kerry
41 50 48
50 46
46 51
52 45
45
Bush
52 45
45 43
45 45
45 44
50 48
Proj
45.5 53.0
52.5 54.5
52.0 52.0
53.3 54.3
48.0 49.5
ARG
Kerry
47 48
50 50
47 48
49 49
46 49
Bush
46 46
43 44
44 46
45 46
47 48
Proj
51.5 51.8
54.5 53.8
53.0 51.8
52.8 52.0
50.5 50.5
NBC
Kerry
35 na
43 43
42 44
45 45
46 47
Bush
54 na
46 46
46 45
47 47
49 48
Proj
42.5 na
50.5 50.5
50.3 51.5
50.3 50.3
49.0 50.0
FOX
Kerry
32 43
44 42
42 42
42 45
43 48
Bush
54 47
44 43
42 48
43 44
45 45
Proj
41.8 49.8
52.3 52.5
53.3 48.8
52.5 52.5
51.3 52.5
CBS
Kerry
48 47
48 48
49 45
49 45
41 46
Bush
43 46
43 43
41 44
44 44
49 47
Proj
54.0 51.5
54.0 54.0
55.8 52.5 53.5
52.5 47.8 50.5
Gallup
Kerry
43 48
52 46
49 48
51 48
44 48
Bush
55 49
44 51
47 49
44 47
52 46
Proj
43.8 49.5
54.3 47.5
51.3 49.5
54.0 51.0
46.3 51.8
Pew
Kerry
41 47
48 47
50 46
46 47
40 46
Bush
52 47
44 46
45 48
44 45
48 45
Proj
45.5 50.8
53.3 51.5
53.0 49.8
52.8 52.3
48.3 52.0
LAT
Kerry
na na
na 49
49 51
48 46
43 48
Bush
na na
na 46
46 44
46 49
47 47
Proj
na na
na 52.0
52.0 54.0 51.8
49.0 49.8 51.0
Zogby
Kerry
na na
48 47
47 44
48 50
44 47
Bush
na na
46 44
42 42
43 43
47 48
Proj
na na
51.8 53.0
54.5 53.8
54.0 54.5
50.0 50.0
TIME
Kerry
43 48
na na
51 51
50 46
44 46
Bush
54 50
na na
46 46
45 46
48 51
Proj
44.5 48.8
na na
52.5 52.5
53.0 51.3
49.3 47.5
Dem
Corp
Kerry
na 51
47 48
49 49
50 52
49 48
Bush
na 47
50 49
47 48
47 45
49 47
Proj
na 51.8
48.5 49.5
51.3 50.5
51.5 53.5
49.8 51.0
Marist
Kerry
na na
na na
na na
45 45
45 49
Bush
na na
na na
na na
44 44
47 48
Proj
na na
na na
na na
52.5 52.5
50.3 50.5
Harris
Kerry na
na na
na na
na na
na 46
48
Bush
na na
na na
na na
na na
48 47
Proj
na na
na na
na na
na na 49.8
51.0
Economist
Kerry
na na
na na
na na
na na
46 49
Bush
na na
na na
na na
na na
46 45
Proj
na na
na na
na na
na na
51.3 52.8
ICR
Kerry
na na
na na
na na
na na
43 44
Bush
na na
na na
na na
na na
50 46
Proj
na na
na na
na na
na na
47.5 50.8
Date Poll Size Type KERRY BUSH
November
2 Harris
1509 LV 48 47
2 Zogby
1200 LV 47 48
1 Marist
1166 LV 49 48
1 Econ
2903 RV 49 45
1 TIPP
1284 LV 44 45
1 CBS
1125 RV 46 47
October
31 FOX
1400 RV 48 45
31 DemCor 1018 LV 48 47
31 Gallup 1866 RV 48 46
31 NBC
1014 LV 47 48
31 ABC
3511 RV 48 47
30 ARG
1258 LV 49 48
30 Pew
2408 RV 46 45
29 Nwk
1005 RV 45 48
26 ICR
817 RV 44 46
24 LAT
1698 RV 48 47
21 Time
803 LV 46 51
20 AP
976 LV 49 46
__________________________________________________________________________________________________
State
Pre-election Polling Trend
The Election Model Monte Carlo Simulation forecast was updated during
the four months leading up to the election as new state polling data was
introduced. The projections below assume that Kerry, running against the
unpopular Bush, would win 60-75% of undecided voters (UVA).
7-Sep
7-Oct 1-Nov
Final
Kerry
Bush Kerry
Bush Kerry Bush
Before UVA:
Unweighted
Average
43.94 47.65 46.84
46.86 45.70 47.60
Weighted
Average
45.54 46.45 47.97
46.66 47.88
46.89
Projection (75% UVA):
2-party vote
51.54
48.46 51.99 48.01
51.80 48.20
Total vote (Other 1%)
50.79
48.21 51.24 47.76
51.05 47.95
Projection (60% UVA):
2-party
vote
50.71 49.29 51.10
48.90 51.02 48.98
Total vote (Other
1%)
50.21 48.79 50.60
48.40 50.52 48.48
State
Date Pollster
Kerry Bush Kerry
Bush Kerry Bush
AL
Oct 27 Survey USA
34 54
40 56
39 57
AK
Sep 11 ARG
33
56 39
55 30
57
AZ
Oct 26 Rasmussen
42 45
47 50
45 50
AR
Oct 29 Mason-Dixon
47 48
47 47
48 48
CA
Oct 27 Field Poll
50 42
51 43
49 42
CO
Oct 30 Zogby
47 47
49 48
47 48
CT
Oct 28 Research 2000
45 38
47 38
52 42
DE
Sep 25 W Chester U
55 42
45 38
45 38
DC
Sep 13 ARG
86
9
78 11
78 11
FL
Oct 30 Zogby
44
48
50 48
50 47
GA
Oct 29 Zogby
38
55
42 53
42 52
HI
Oct 20 SMS Res
48 41
51 41 45
45
ID
Sep 10 ARG
25
55 30
59 30
59
IL
Oct 29 Survey USA
52 38
55 38
54 42
IN
Oct 29 Survey USA
40 52
40 53
39 58
IA
Oct 30 Zogby
47 47
51 44
50 44
KS
Oct 27 Survey USA
36 56
35 57
37 60
KY
Oct 20 Bluegrass
39 56
38 53
39 56
LA
Oct 22 SE LA U
36
52 42
50 40
48
ME
Oct 21 Zogby
49
44
42 39
50 39
MD
Oct 29 Survey USA
53 42
48 45
54 43
MA
Oct 5 Merrimack
56 30
64 27
64 27
MI
Oct 30 Zogby
48
44
52 42
52 45
MN
Oct 30 Zogby
46
46
53 44
52 44
MS
Sep 17 ARG
30
61 42
51 42
51
MO
Oct 29 Mason-Dixon
45 49
49 50
44 49
MT
Oct 20 Mason-Dixon
33 53
36 54
36 57
NE
Oct 20 RKM Research 33
62
30 61
32 61
NV
Oct 29 Survey USA
48 46
48 47
49 49
NH
Oct 30 ARG
51
43 51
44 47
47
NJ
Oct 29 Survey USA
50 46
50 45
50 42
NM
Oct 30
ARG
42 45
55 43
49 49
NY
Oct 28 Survey USA
56 37
53 41
57 39
NC
Oct 26 Mason-Dixon
45 51
47 50
47 50
ND
Oct 19 Minn St U
33 61
33 62
35 55
OH
Oct 30 Zogby
42 48
48 47
50 47
OK
Oct 24 Wilson Res 38
57 29
52 28
61
OR
Oct 29 Mason-Dixon
54 43
55 44
50 44
PA
Oct 30 Zogby
46
47 52
46 50
45
RI
Oct 27 Survey USA
49 25
55 37
56 36
SC
Oct 24 Survey USA
42 53
37 55
42 55
SD
Oct 24 McLaughlin
40 54
40 52
42 52
TN
Oct 21 Mason-Dixon
50 48
48 50
48 50
TX
Oct 28 Survey USA
33 57
37 58
37 59
UT
Oct 28 Dan Jones
22 67
27 64
24 69
VT
Oct 12 Research2k
51 36
50 40
53 40
VA
Oct 29 Survey USA
45 49
47 50
47 51
WA
Oct 27 Strat Vision
48 43
54 44
52 44
WV
Oct 29 Mason-Dixon
42 49
44 50
46 49
WI
Oct 30 Zogby
49 45
51 48
51 44
WY
Sep 11 ARG
28
68 29
65 29
65
___________________________________________________________________
Weekly Average Trend
Although Bush led in the unweighted average, Kerry led the weighted average trend (based on the 1992-2000 average state vote) from July to Election Day, except for the first two weeks in September. The projections assume Kerry would win 75% of the undecided vote.
Poll
Unweighted
Weighted
2-party Projected
Date
Kerry Bush
Kerry
Bush Kerry Bush
Kerry Bush
2-Jul
43.5 46.5
45.4 44.6
50.5 49.5
52.2 46.8
10-Jul
43.8 46.7
45.8 44.9
50.5 49.5
52.0 47.0
17-Jul
44.5 46.5
46.5 44.3
51.2 48.8
52.6 46.4
24-Jul
44.2 46.1
45.6 43.6
51.1 48.9
52.9 46.1
2-Aug
44.4 46.5
46.3 44.6
50.9 49.1
52.3 46.7
10-Aug
44.3 46.4
46.4 44.3
51.2 48.8
52.7 46.3
18-Aug
44.1 46.4
46.2 44.3
51.0 49.0
52.6 46.4
26-Aug
45.2 47.5
47.2 46.6
50.3 49.7
51.1 47.9
7-Sep
43.9 47.6
45.5 46.5
49.5 50.5
50.8 48.2
14-Sep
43.7 48.4
45.6 47.3
49.1 50.9
50.2 48.8
22-Sep
45.0 48.7
47.3 47.1 50.1
49.9 50.8 48.2
29-Sep
44.1 47.6
46.0 45.5
50.3 49.7
51.7 47.3
7-Oct
45.7 47.6
47.9 46.7
50.7 49.3
51.2 47.8
14-Oct
45.4 47.9
47.3 46.7
50.3 49.7
51.0 48.0
21-Oct
46.0 48.1
48.4 46.4
51.1 48.9
51.5 47.5
28-Oct
45.4 47.4
47.1 45.9
50.7 49.3
51.6 47.4
1-Nov
45.55 48.28 47.88
46.89 50.52 49.48
51.05 47.95
___________________________________________________________________
Pre-election Battleground
State Polls
Final pre-election Zogby polls for
nine battleground states were included in the Election Model Monte Carlo
simulation forecast. Kerry was leading in 8 of the 9 states by an average
of 50.2-44.8%. The base case assumption was that he would capture 75% of
the undecided (UVA) vote and win all 9 states by a 53.7-45.9% margin. The
conservative assumption was that he would capture 55% UVA and win 8 states by
52.7-46.8%. He won just 4 by 50.1- 49.4%. The margin of error was
exceeded in 7 states, a 1 in 4.7 billion probability.
75% UVA 55%
UVA
Zogby Oct. 31
Poll
Projection Projection
Recorded 75%
UVA
State
Kerry Bush Kerry
Bush Kerry
Bush Kerry
Bush Dev Prob
CO
47 48
50.3 49.1
49.4 50.0 47.4
52.1 2.97 3.27%
FL
50 47
51.9 47.6
51.4 48.2
47.3 52.3
4.65 0.20%
IA
50 44
54.2 45.4
53.1 46.5 49.5
50.1 4.73 0.17%
ME
50 39
57.6 41.5
55.6 43.6
54.1 45.1
3.54 1.42%
MI
52 45
53.9 45.6
53.4 46.1 51.5
48.0 2.40 6.83%
MN
52 44
54.5 44.8
53.8 45.5
51.5 47.9
3.08 2.82%
OH
50 47
52.3 47.8
51.7 48.4 48.9
51.1 3.30 2.03%
PA
50 45
53.8 46.3
52.8 47.3
51.3 48.7
2.48 6.18%
WI
51 44
54.3 45.1
53.5 46.0 49.9
49.6 4.43 0.30%
Mean 50.2
44.8 53.7
45.9 52.7
46.8 50.1
49.5 3.51 2.58%
Probability
of average deviation (in parenthesis):
Sample
MoE 75% UVA
(3.51%) 55% UVA (2.58%)
1000
3.16% 1 in 68
1 in 19
6000 1.29% 1
in 20 million 1 in 25
thousand
9000
1.05% 1 in 30 billion 1 in 1.5
million
Comparison of Zogby pre-election polls and
unadjusted exit polls
The 9-poll projection average was
within 0.5% of the exit poll average.
Average
of 9 Battleground states
Poll
Kerry Bush
Zogby
50.2 44.8 (final pre-election polls)
Projection 53.7 45.9 (75%
undecided to Kerry)
Exit (WPE) 53.2 45.8
Zogby Poll
Projection Exit Poll
Recorded
St
Kerry Bush
Kerry Bush Kerry Bush
Kerry Bush
CO
47 48 50.3
49.1 50.1 48.6
47.4 52.1
FL
50 47 51.9
47.6 50.9
48.3 47.3 52.3
IA
50 44 54.2
45.4 50.7
48.4 49.5 50.1
ME
50 39 57.6
41.5 55.5
42.7 54.1 45.1
MI
52 45 53.9
45.6 54.4
44.7 51.5 48.0
MN
52 44 54.5
44.8 55.7
43.0 51.5 47.9
OH
50 47 52.3
47.8 54.2
45.4 48.9 51.1
PA
50 45 53.8
46.3 55.3
44.0 51.3
48.7
WI
51 44 54.3
45.1 52.0
47.0 49.9 49.6
Average 50.2
44.8 53.7
45.9 53.2
45.8 50.1
49.5
___________________________________________________________________________________________________
State Exit Polls
Pre-election Projections vs. Exit Polls vs.
Recorded Vote
The pre-election 2004 Election Model predicted that Kerry would win 337 EV based on the final state pre-election polls, assuming that he captured 75% of undecided voters. The post-election True Vote Model determined that Kerry actually won 336 electoral votes. This was based on 12:22am National Exit Poll, assuming 95% turnout of 2000 voters and a 75% Kerry share of 3.4mm uncounted votes (2004 Census).
The actual recorded state vote shares consistently understated Kerry’s pre-election and 12:22am exit poll shares. But aggregate weighted pre-election state and national poll projections matched the 12:22am exit polls. If, as the naysayers claim, the exit polls were biased for Kerry, do they also suggest that the close match between pre-election and exit polls imply that the pre-election polls were biased as well?
Final
NEP
Recorded
2-party
Kerry Bush Kerry
Bush Kerry Bush
47.78 51.22 48.27 50.73
48.76 51.24
UVA: percentage of undecided allocated
to Kerry
2-party: 0.75% of 3rd party to Kerry,
0.25% to
Bush
Final Poll
Projection 2-party
Kerry Bush Kerry
Bush Kerry Bush
PRE-ELECTION
75%
UVA
National
47.17
46.89 50.88 48.12
51.63 48.37
State
47.88 46.89 51.05
47.95 51.80 48.20
60% UVA
National
47.17
46.89 50.13 48.87
50.88 49.12
State
47.88 46.89 50.42
48.58 51.17 48.83
EXIT POLLS
NEP
Gender 50.78
48.22 50.78 48.22
51.53 48.47
NEP Voted 2k
51.41 47.59 51.41
47.59 52.16 47.84
State (Gender) 50.33
48.88 50.33
48.88 50.92 49.08
State (WPE)
51.81 48.19 51.81
48.19 52.51 47.49
MODELS
Optimizer
1 51.62 47.37
51.62 47.37 52.15 47.85
(1250 precincts grouped by partisanship)
Optimizer
2 51.62 47.37
51.62 47.37 52.15 47.85
(Big City, Small City, Suburban, Small Town, Rural)
Optimizer
3 51.77 47.21
51.77 47.21 52.30 47.70
(States grouped by partisanship)
True
Vote 52.57
46.43 52.57 46.43
53.32 46.68
Calculator
53.45 45.50 53.45
45.50 54.15 45.85
Optimizer: 1250 E-M precinct WPE, partisanship response rates
True Vote: 2000 recorded voter turnout, 0.87% mortality, 95% turnout
Calculator: 2000 Census voter turnout, 1.22% voter mortality, 95% turnout
_____________________________________________________________________
Interactive Election Simulation
State pre-election projections and exit poll simulations vs. the recorded vote
The 2004 Election Simulation Model contains worksheets for 1) state pre-election and exit polls, 2) 18 national pre-election polls, 3) 12:22am National Exit Poll, 4) “How Voted in 2000” demographic sensitivity analysis, 5) state and precinct exit poll response optimization analysis; 6) Gender vote analysis;
7) Ohio exit poll and 8) Census 2004 vote data.
The key assumptions are user-entered. Pre-election: undecided voter allocation; Exit Poll: “cluster” effect.
Sample Simulation
Input Assumptions:
Undecided to Kerry:
75.0%
Exit Poll Cluster Effect:
30%
Exit Poll Data based on: Edison-Mitofsky
WPE
Kerry Electoral
Vote:
Mean:
338
Median: 336
Maximum: 364
Minimum: 302
Win Prob: 100%
Pre Exit
Kerry Bush Kerry
Bush Kerry Kerry
Kerry -Exceed MoE- Vote Discrepancy
MoE MoE
Pre Pre Exit
Exit PreSim ExitSim
Recorded Pre Exit Pre
Exit Diff
Wtd Avg 3.92 3.17
47.69 47.02 51.81
47.19 50.77 51.85
48.28 19
23 (2.5) (3.6)
(1.1)
EV
AL
9 3.91
4.64 39
57 42.5 56.8
43.6 40.6
36.9 AL
- (6..7)
(3.8) 2.9
AK
3 3.88
4.14 30
57 40.3 56.3
39.3 44.1
35.6 -
AK (3.7) (8.5)
(4.8)
AR
6 3.96
2.95 45
50 44.8 54.1
48.9 45.9
44.6 AR
- (4..4)
(1.4) 3.0
AZ
10 3.96
3.40 46
48 46.7 52.6
51.1 45.3
44.4 AZ
- (6..7)
(0.9) 5.7
CA
55 3.93
2.89 49
42 59.8 38.9
56.3 59.6
54.4 -
CA (1.8) (5.1)
(3.3)
CO
9 3.96
2.54 47
48 50.1 48.6
52.6 50.4
47.1 CO
CO (5.5) (3.4)
2.2
CT
7 3.93
4.25 52
42 62.2 36.1
52.1 62.4
54.3 -
CT 2.2
8.1) (10.3)
DE
3 3.91
4.53 45
38 61.3 37.8
60.2 61.9
53.4 DE
DE (6.9) (8.5)
(1.6)
DC
3 2.73
2.50 78
11 90.9 7.6
85.7 90.8
89.4 DC
- 3..8
1.4) (5.1)
FL
27 3.96
2.39 50
47 50.9
48.3 51.7
51.6 47.1
FL
FL (4.5) (4.5)
0.0
GA
15 3.95
3.22 42
52 42.5 56.9
45.0 43.3
41.4 -
- (3..6)
(1.9) 1.8
HI
4 3.96
5.69 45
45 56.4 42.9
49.4 56.3
54.0 HI
- 4..6
2.3) (6.9)
ID
4 3.85
5.08 30
59 30.8
67.9 36.2
28.7 30.3
ID - (6.0) 1.6 7.5
IL
21 3.92
3.38 54
42 57.0 42.3
54.8 57.8
54.8 -
- 0..0
(3.0) (3.0)
IN
11 3.90
4.12 39
58 40.0
59.2 39.1
41.1 39.3
- &nbbsp;
- 0..1
(1.8) (1.9)
IA
7 3.94
2.55 50
44 50.7
48.4 54.6
51.1 49.3
IA -
(5.3) (1.8) 3.4
KS
6 3.87
4.74 37
60 37.5 61.2
36.2 38.6
36.6 -
- &nbbsp; 0.4
(2.0) (2.4)
KY
8 3.92
3.89 39
56 39.6
59.6 42.4
38.5 39.7
- &nbbsp;
- (22.7) 1.2
3.9
LA
9 3.96
3.10 40
48 44.1 54.8
47.8 42.9
42.3 LA
- (55.5)
(0.6) 4.9
ME
4 3.91
2.86 50
39 55.5 42.7
55.5 53.9
53.6 -
- (11.9)
(0.3) 1.6
MD
10 3.93
3.99 54
43 60.0 38.9
53.3 63.3
56.0 -
MD 2.7
(7.3) (10.0)
MA
12 3.60
4.03 64
27 64.8 33.9
70.3 64.4
62.1 MA
- &nbbsp; (8.2)
(2.3) 5.8
MI
17 3.95
2.57 52
45 54.4 44.7
54.6 53.3
51.2 -
- &nbbsp; (3.3)
(2.1) 1.3
MN
10 3.94
2.72 52
44 55.7 43.0
48.7 55.2 51.2
- &nbbsp;
MN 2.5
(4.0) (6.6)
MS
6 3.95
4.47 42
51 45.8 53.4
47.0 47.1
40.2 MS
MS (6.8)
(6.9) (0.1)
MO
11 3.96
2.74 44
49 49.0 50.4
47.2 50.6
46.1 -
MO (1.1)
(4.5) (3.4)
MT
3 3.90
4.92 36
57 37.7 60.0
39.0 35.8
38.6 -
- &nbbsp; (0.4) 2.8
3.2
NE
5 3.83
4.38 32
61 36.7 61.8
39.3 35.6
32.7 NE
- &nbbsp; (6.5)
(2.8) 3.7
NV
5 3.96
2.77 49
49 52.9
45.4 45.2
53.1 48.1
- &nbbsp; NV
2.8 (5.0) (7.9)
NH
4 3.96
2.94 47
47 57.0 42.1
53.8 57.0
50.4 -
NH (3.5)
(6.7) (3.2)
NJ
15 3.93
3.24 50
42 57.8 41.4
56.1 56.6
52.9 -
NJ (3.2)
(3.7) (0.5)
NM
5 3.96
2.88 49
49 52.9
45.9 47.4
52.4 49.0
- &nbbsp;
NM 1.6
(3.3) (4.9)
NY
31 3.88
3.21 57
39 64.1 34.4
60.9 64.9
58.4 -
NY (2.5)
(6.5) (4.0)
NC
15 3.96
2.73 47
50 49.2 50.4
47.6 48.9
43.6 NC
NC (4.0)
(5.3) (1.4)
ND
3 3.92
4.72 35
55 32.9 65.5
41.0 36.3
35.5 ND - (5.5)
(0.8) 4.7
OH
20 3.96
2.87 50
47 54.2 45.4
52.2 54.9
48.7 -
OH (3.5)
(6.2) (2.8)
OK
7 3.81
3.09 28
61 33.5 66.5
38.0 30.9
34.4 -
OK (3.6) 3.5
7.1
OR
7 3.94
3.90 50
44 51.3 47.2
52.3 52.1
51.6 -
- &nbbsp; (0.7)
(0.5) 0.2
PA
21 3.95
2.89 50
45 55.3 44.0
54.0 56.6
51.0 -
PA (3.1)
(5.6) (2.5)
RI
4 3.84
4.29 56
36 61.8
36.3 63.4
59.0 59.6
- &nbbsp;
- &nbbsp; (3.8) 0.6
4.4
SC
8 3.93
3.05 42
55 45.9 53.0
41.0 44.9
41.0 -
SC (0.0)
(3.9) (3.9)
SD
3 3.95
3.19 42
52 36.3 62.0
43.3 34.6
38.4 SD
SD (4.9) 3.8
8.7
TN
11 3.96
2.98 47
50 42.8
56.5 45.7
42.7 42.5
- &nbbsp; - (3.2)
(0.2) 3.0
TX
34 3.88
3.01 37
59 40.6 58.7
36.7 39.4
38.2 -
- &nbbsp; 1.5
(1.2) (2.7)
UT
5 3.60
4.13 24
69 29.2
68.3 31.9 30.1
26.0 UT
- &nbbsp; (5.8)
(4.1) 1.7
VT
3 3.91
4.62 53
40 66.4
31.3 55.9
71.3 59.2
- &nbbsp;
VT
3.3 (12.1) (15.4)
VA
13 3.96
3.37 47
51 49.4 49.7
49.2 48.6
45.6 -
- &nbbsp; (3.7) (3.0) 0.6
WA
11 3.94
2.75 52
44 57.0 41.4
55.8 57.1
52.9 -
WA (2.9) (4.3) (1.3)
WV
5 3.96
3.06 45
49 40.3 59.0
45.6 41.9
43.2 - -
(2.4) 1.3 3.8
WI
10 3.94
2.70 51
44 52.0 47.0
51.8 50.7
49.8 -
- &nbbsp; (2.1)
(1.0) 1.1
WY
3 3.74
4.55 29
65 31.2 66.7
33.0 32.8
29.1 WY
- &nbbsp; (3.9)
(3.6) 0.3
___________________________________________________________
State Exit
Poll Measures: WPE, GEO, Composite
Edison-Mitofsky provided 3 state exit poll estimates in their Jan. 2005
report. Bush won the recorded vote share 50.73-48.27% with 286 electoral votes.
WPE (Within Precinct Error) is difference between the average precinct
exit poll margin and the recorded vote margin – after removing “outliers” which
most likely lowered the average Kerry share. Kerry’s weighted average national
vote share was 51.81%.
His electoral vote was 324.
BEST GEO is the estimate made at close-of-poll, weighted by sample, but
not by results or pre-election estimates. Kerry’s weighted average
national vote share was 51.02%. His electoral vote was 301.
COMPOSITE (12:22am) is the estimate after adjustment to pre-election
estimates. Kerry’s weighted average national vote share was 50.28%.
His electoral vote was 288.
WPE (WPD) is the difference between the official recorded vote margin
and exit poll margin and represents the “pristine” raw exit poll
results. E-M did not provide the corresponding state exit poll vote
shares, but these can be calculated by applying the WPE to the official
recorded vote.
Based on the WPE measure, Kerry was a 51.8-47.2% winner.
The 2004 Election Model projected Kerry as the winner of the 2-party
vote by 51.8 - 48.2%.
Example: Calculation of the unadjusted Ohio
exit poll vote shares
Ohio recorded (official) vote:
B = 50.8% = Bush official state vote share
K = 48.7% = Kerry official state vote share
BM = 2.1% = Bush official margin
WPE = 10.9% = Within Precinct Error
Bush exit poll margin:
BEM = BM – WPE = 2.1% - 10.9% = - 8.8%
Calculate exit poll shares:
KP = Kerry = K + 0.5* WPE
BP = Bush = B - 0.5* WPE
KP = 48.7 + 5.45 = 54.15%
BP = 50.8 - 5.45 = 45.35%
This graph displays linear regressions of WPE, GEO and Composite exit poll discrepancies.
* WPE results differ substantially from the Recorded Vote and the Composite (12:22am) exit poll.
Estimate RECORDED
WPE
BEST
GEO
COMPOSITE
Electoral Vote 251-286
324-214
301-237
288-250
State Kerry
Bush
Margin
Kerry Bush
Margin
Kerry Bush Margin
Kerry
Bush Margin
WtdAvg 48.27 50.73
-2.46 p;
51.81 47.19
4.63
51.02 48.49 2.53
50.28
49.10 1.17
AL* 36.8
62.5
-25.6 p;
42.5 56.8
-14.3 p;
42.0 57.5
-15.5 &nbssp;
40.6 58.7 -18.1
AK* 35.5
61.1
-25.5 p;
40.3 56.3 -15.9
41.2 57.4
-16.2 &nbssp;
39.0 58.8 -19.8
AZ
44.4 54.9
-10.5 p;
46.7 52.6
-5.9 ;
46.5 53.5
-7.0 p;
46.8 53.2 -6.4
AR
44.5 54.3
-9.8 ;
44.8 54.1
-9.3 ;
46.8 52.4
-5.6 p;
47.0 52.2 -5.2
CA* 54.3
44.4
9.9
59.8 38.9
20.8
56.5 43.5
13.0
56.5 43.5 13.0
CO* 47.0
51.7
-4.7 ;
50.1 48.6
1.4
47.0 52.5
-5.5 p;
47.7 51.4 -3.7
CT* 54.3
43.9
10.4
62.2 36.1
26.1
59.3 39.6
19.7
58.1 40.5 17.6
DE* 53.3
45.8
7.6
61.3 37.8
23.5
61.5 37.9
23.6
57.7 41.2 16.5
DC
89.2 9.3
79.8
90.9 7.6 83.2
91.1 8.1
83.0
90.2 8.4 81.8
FL* 47.1
52.1
-5.0 ;
50.9 48.3
2.6
49.2 50.3
-1.1 p;
49.3 50.1 -0.8
GA
41.4 58.0
-16.6 p;
42.5 56.9
-14.4 p;
43.5 56.5 -13.0
43.0
57.1 -14.1
HI
54.0 45.3
8.7
56.4 42.9 13.4
56.5 43.4
13.1
53.6 46.4 7.2
ID
30.3 68.4
-38.1 p;
30.8 67.9
-37.1 p;
30.9 69.1
-38.2 &nbssp;
31.6 68.3 -36.7
IL* 54.8
44.5
10.3
57.0 42.3
14.7
57.5 42.6
14.9
57.0 42.9 14.1
IN
39.3 59.9
-20.7 p;
40.0 59.2
-19.2 p;
40.5 59.6
-19.1 &nbssp;
41.3 58.8 -17.5
IA* 49.2
49.9
-0.7 ; 50.7
48.4
2.3
50.0 49.0
1.0
50.0 49.0 1.0
KS
36.6 62.0
-25.4 p;
37.5 61.2
-23.7 p;
36.6 62.8
-26.2 &nbssp;
34.4 64.6 -30.2
KY
39.7 59.6
-19.9 p;
39.6 59.6
-20.0 p;
40.6 58.6
-18.0 &nbssp;
40.9 58.3 -17.4
LA
42.2 56.7
-14.5 p;
44.1 54.8
-10.7 p;
43.2 56.3
-13.1 &nbssp;
44.3 54.8 -10.5
ME* 53.6
44.6
9.0
55.5 42.7
12.8
54.3 44.6
9.7
53.9
44.4 9.5
MD* 55.9
42.9
13.0
60.0 38.9
21.1
59.4 39.7
19.7
56.6 42.5 14.1
MA* 61.9
36.8
25.2
64.8 33.9
31.0
66.3 33.6
32.7
65.7 34.2 31.5
MI* 51.2
47.8
3.4
54.4 44.7 9.7
51.8 47.3
4.5
51.9
47.1 4.8
MN* 51.1
47.6
3.5
55.7 43.0
12.8
56.7 42.4
14.3
53.7 44.9 8.8
MS* 40.2
59.0
-18.9 p;
45.8 53.4
-7.6 ;
46.2 53.2
-7.0 p;
43.4 56.0 -12.6
MO* 46.1
53.3
-7.2 ;
49.0 50.4
-1.4 ;
47.8 52.2
-4.4 p;
47.8 52.1 -4.3
MT
38.6 59.1
-20.5 p;
37.7 60.0
-22.3 p;
37.8 59.9
-22.1 &nbssp;
37.2 60.0 -22.8
NE* 32.7
65.9
-33.2 p;
36.7 61.8
-25.1 p;
37.5 61.7
-24.2 &nbssp;
36.1 62.6 -26.5
NV* 47.9
50.5 -2.6
52.9 45.4
7.5
49.3 47.9 1.4
48.9
48.3 0.6
NH* 50.2
48.9
1.4
57.0 42.1
15.0
57.1 42.1
15.0
55.1 43.9 11.2
NJ* 52.9
46.2
6.7
57.8 41.4
16.4
58.4 40.2
18.2
55.3 42.8 12.5
NM* 49.0
49.8
-0.8 ;
52.9 45.9
7.0
51.7 47.5
4.2
50.8
48.0 2.8
NY* 58.4
40.1
18.3
64.1 34.4
29.7
65.1 33.8
31.3
63.1 35.5 27.6
NC* 43.6
56.0
-12.4 p;
49.2 50.4
-1.1 ;
48.2 51.8
-3.6 p;
48.1 51.9 -3.8
ND
35.5 62.9
-27.4 p;
32.9 65.5
-32.6 p;
32.3 66.7 -34.4
33.3
64.9 -31.6
OH* 48.7
50.8
-2.1 ;
54.2 45.4
8.8
53.2 46.7
6.5
51.7
48.3 3.4
OK
34.4 65.6
-31.1 p;
33.5 66.5
-33.0 p;
34.1 65.8
-31.7 &nbssp;
34.6 65.4 -30.8
OR
51.3 47.2
4.2
51.3 47.2 4.2
51.3 47.2
4.2
51.3
47.19 4.2
PA* 50.9
48.4
2.5
55.3 44.0
11.3
56.9 43.1
13.8
54.2 45.7 8.5
RI* 59.4
38.7
20.8
61.8 36.3
25.5
62.4 36.3
26.1
63.2 34.9 28.3
SC* 40.9
58.0
-17.1 p;
45.9 53.0
-7.1 ;
46.4 52.4
-6.0 p;
45.1 53.8 -8.7
SD
38.4 59.9
-21.5 p;
36.3 62.0
-25.7 p;
34.9 63.2
-28.3 &nbssp;
36.8 61.5 -24.7
TN
42.5 56.8
-14.3 p;
42.8 56.5
-13.8 p;
40.3 58.5
-18.2 &nbssp;
41.3 57.6 -16.3
TX* 38.2
61.1
-22.9 p;
40.6 58.7
-18.1 p;
36.5 63.5
-27.0 &nbssp;
37.1 62.9 -25.8
UT* 26.0
71.5
-45.5 p;
29.2 68.3
-39.1 p;
29.9 69.2
-39.3 &nbssp;
29.9 68.3 -38.4
VT* 58.9
38.8
20.1
66.4 31.3
35.1
67.0 30.4
36.6
64.5 32.8 31.7
VA
45.5 53.7
-8.2 ;
49.4 49.7
-0.3 ;
50.2 49.7 0.5
48.0
51.9 -3.9
WA* 52.8
45.6
7.2
57.0 41.4
15.6
54.9 44.2
10.7
54.1 44.6 9.5
WV
43.2 56.1
-12.9 p;
40.3 59.0
-18.7 p;
41.6 57.4
-15.8 &nbssp;
44.9 54.2 -9.3
WI* 49.7
49.3
0.4
52.0 47.0 5.1
52.5 46.8
5.7
49.6
49.2 0.4
WY
29.1 68.9
-39.8 p;
31.2 66.7 -35.5
34.5 63.6
-29.1 &nbssp;
31.6 66.4 -34.8
_____________________________________________________________________
Monte Carlo Polling Simulation
This is a sample run from the Monte Carlo Polling Simulation model using the WPE measure.
Cluster
10%
20% 30%
40% 50%
60% 70%
80% 90%
States > MoE 25
24 24
22 20
17 16
15 15
Prob: 1 in zero
zero zero
zero 750tr 257tr
19tr 1tr 1tr
Assuming a 30% cluster effect (CE), N = 24 states exceeding the MoE for Bush
Prob = 1 - BINOMDIST (N-1, 51, 0.025, TRUE)
Prob
= 1 – BINOMDIST (23, 51, 0.025, TRUE) = ZERO
Assuming a 70% cluster effect, N=16 states. The probability is 1 in 19
trillion.
Kerry
Kerry Exit
Poll Recorded
Dev Favor Exceed
EV EV
WPE MoE Win Prob
Kerry Bush Kerry
Bush Prob Bush MoE
Total 335
7.1 30% CE
- 511.8
47.2 48.3
50.7 -
44 24
AL
9 -
11.3 4.64% 0.1%
42.5 56.8
36.9 62.5
0.9% Bush yes
AK
3
- &nbbsp; 9.6
4.14% 0.0%
40.3 56.3
35.6 61.2
1.3% Bush yes
AR
6
- &nbbsp; 0.5
2.95% 0.0%
44.8 54.1
44.6 54.3
43.4% Bush
AZ
10
- &nbbsp; 4.6
3.40% 2.8%
46.7 52.6
44.4 54.9
9.2% Bush
CA
55
55 10.9
2.89% 100%
59.8 38.9
54.4 44.5
0.0% Bush yes
CO
9
- &nbbsp; 6.1
2.54% 53.1% 50.1
48.6 47.1
51.8 1.0% Bush yes
CT
7
7 15.7
4.25% 100%
62.2 36.1
54.3 43.9
0.0% Bush yes
DE
3
3 15.9
4.53% 100%
61.3 37.8
53.4 45.8
0.0% Bush yes
DC
3
3 3.4
2.50% 100%
90.9 7.6 89.4
9.4 12.5%
Bush
FL
27 27
7.6 2.39% 77.0%
50.9 48.3 47.1
52.1 0.1% Bush yes
GA
15
- &nbbsp; 2.2
3.22% 0.0%
42.5 56.9
41.4 58.0
25.4% Bush
HI
4
4 4.7
5.69% 98.6% 56.4
42.9 54.0
45.3 20.5%
Bush
ID
4
- &nbbsp; 1.0
5.08% 0.0%
30.8 67.9
30.3 68.4
41.8% Bush
IL
21 21
4.4 3.38%
100% 57.0
42.3 54.8
44.5 10.3%
Bush
IN
11
- &nbbsp; 1.5
4.12% 0.0%
40.0 59.2
39.3 59.9
36.3% Bush
IA
7
- &nbbsp; 5.0
2.55% 70.5% 50.7
48.4 49.3
50.0 13.8%
Bush
KS
6
- &nbbsp; 1.7
4.74% 0.0%
37.5 61.2
36.6 62.0
35.9% Bush
KY
8
- &nbbsp; -0.1
3.89% 0.0%
39.6 59.6
39.7 59.6
48.2% Kerry
LA
9
- &nbbsp; 3.8
3.10% 0.0%
44.1 54.8
42.3 56.8
12.9% Bush
ME
4
4 3.8
2.86% 100%
55.5 42.7
53.6 44.6
9.3% Bush
MD
10 10
8.1 3.99%
100% 60.0
38.9 56.0
43.0 2.4% Bush yes
MA
12 12
5.8 4.03%
100% 64.8
33.9 62.1
36.9 9.4%
Bush
MI
17 17
6.3 2.57%
100% 54.4
44.7 51.2
47.8 0.8% Bush yes
MN
10 10
9.3 2.72%
100% 55.7
43.0 51.2
47.7 0.1% Bush yes
MS
6
- &nbbsp; 11.3
4.47% 3.3%
45.8 53.4
40.2 59.1
0.7% Bush yes
MO
11 11
5.8 2.74% 23.7%
49.0 50.4 46.1
53.3 1.9% Bush yes
MT
3
- &nbbsp; -1.8
4.92% 0.0%
37.7 60.0
38.6 59.1
36.5% Kerry
NE
5
- &nbbsp; 8.1
4.38% 0.0%
36.7 61.8
32.7 66.0
3.8% Bush
NV
5
5 10.1 2.77%
98.0% 52.9
45.4 48.1
50.7 0.0% Bush yes
NH
4
4 13.6
2.94% 100%
57.0 42.1
50.4 49.0
0.0% Bush yes
NJ
15 15
9.7 3.24%
100% 57.8
41.4 52.9
46.3 0.2% Bush yes
NM
5
5 7.8
2.88% 97.6% 52.9
45.9 49.0
49.8 0.4% Bush yes
NY
31
31 11.4
3.21% 100%
64.1 34.4
58.4 40.1
0.0% Bush yes
NC
15
15 11.3
2.73% 28.3% 49.2
50.4 43.6
56.0 0.0% Bush yes
ND
3
- &nbbsp; -5.2
4.72% 0.0%
32.9 65.5
35.5 62.9
14.0% Kerry
OH
20
20 10.9
2.87% 99.8% 54.2
45.4 48.7
50.8 0.0% Bush yes
OK
7
- &nbbsp; -1.9
3.09% 0.0%
33.5 66.5
34.4 65.6
27.8% Kerry
OR
7
7 0.0
3.90% 74.3% 51.3
47.2 51.6
47.4 44.0% Kerry
PA
21 21
8.8 2.89%
100% 55.3
44.0 51.0
48.5 0.2% Bush yes
RI
4
4 4.7
4.29% 100%
61.8 36.3
59.6 38.8
15.5% Bush
SC
8
- &nbbsp; 10.0
3.05% 0.4%
45.9 53.0
41.0 58.1
0.1% Bush yes
SD
3
- &nbbsp; -4.2
3.19% 0.0%
36.3 62.0
38.4 59.9
9.4% Kerry
TN
11
- &nbbsp; 0.5
2.98% 0.0%
42.8 56.5
42.5 56.8
42.8% Bush
TX
34
- &nbbsp; 4.8
3.01% 0.0%
40.6 58.7
38.2 61.1
6.1% Bush
UT
5
- &nbbsp; 6.4
4.13% 0.0%
29.2 68.3
26.0 71.6
6.6% Bush
VT
3
3 15.0
4.62% 100%
66.4 31.3 59.2
39.0 0.1% Bush yes
VA
13
- &nbbsp; 7.9
3.37% 36.3% 49.4
49.7 45.6
53.8 1.3% Bush yes
WA
11 11
8.4 2.75%
100% 57.0
41.4 52.9
45.7 0.2% Bush yes
WV
5
- &nbbsp; -5.8
3.06% 0.0%
40.3 59.0 43.2
56.1 3.1%
Kerry
WI
10 10
4.7 2.70% 92.7%
52.0 47.0 49.8
49.4 5.2%
Bush
WY
3
- &nbbsp; 4.3
4.55% 0.0%
31.2 66.7
29.1 69.0
18.6% Bush
_____________________________________________________________________
State Projections vs.
Composite (12:22am) Exit Polls vs. Recorded Vote Analysis
Kerry’s projected 2-party national vote share (before undecided voter allocation) was
1) 50.52%, based on the Election Model (1992-2000 average state turnout weights).
2) 50.37%, based on recorded 2004 state vote weights
3) 51.80% assuming 75% UVA to Kerry
The weighted average 2-party state vote shares (2004 recorded vote: 121.056mm):
Projected : 50.37% = 60979 /121056
Exit Poll : 50.51% = 61144 /121056
Actual : 48.76% = 59028 /121056
- Based on the pre-election polls, 41 out of 51 states deviated to Bush.
- Based on the 12:22am exit polls, 43 out of 51 states deviated to Bush.
If Kerry won 60% of the undecided (UVA) vote, the average deviation was 0.37% between pre-election and exit poll.
This is the relationship between UVA and the average deviation:
UVA 50 55 60 67 75
Dev 0.26 -0.05 -0.37 -0.81 -1.31
Approximately 2/3 of the deviations were distributed between -1% and +1%
- One individual led both the pre-election and exit poll in 39 states.
- One individual led both polls in 15 of 17 battleground states.
- The pre-election vote shares differed from the exit poll vote shares by less than 1% in 15 states;
less than 2% in 29 states; less than 3% in 32 states; less than 4% in 42 states.
State exit poll red-shift probabilities are close to zero, even assuming a constant conservative 3.0% MoE
The exit poll margin of error (MoE) was exceeded in 16 states – all in favor of Bush. The odds: 1 in 19 trillion.
Kerry vote shares:
Pre-Elect: pre-election weighted state poll
Exit Poll: weighted state exit poll (12:22am)
Pre/Actual: pre-election poll as a percent of actual
Exit/Actual: exit poll as a percent of actual
Probability of discrepancy between
Pre: pre-election poll and actual vote
Exit: exit poll and actual vote
Favor: pre-election and exit poll vote shift to (B)ush or (K)erry
2-pty Pre-
Exit Actual Pre-
Exit Actual Pre/ Exit/
-Probability- Favor
Kerry
Vote Elect Poll
Vote Elect Poll
Vote Actual Actual
Pre Exit Pre Exit
WtdMean 121056 50.37%
50.51% 48.76% 60979
61144 59028 103.3% 103.6%
14.1% 12.2% 41B 43B
Mean
- 48.57% & 48.84%
47.09% -
- &nbbsp; -
103.4% 103.8%
Median
- 50.00% & 49.07%
47.48% -
- -- 102.7% 103.9%
AK
302 34.48% 40.14%
36.77% 104
121 111
94% 109%
6.3% 1.2% K B
AL
1870 40.63% 41.08%
37.10% 760
768 694
109% 111%
0.9% 0.4% B B
AR
1043 50.00% 46.60%
45.07% 522
486 470
111% 103%
0.1% 15.4% B B
AZ
1998 47.37% 46.93%
44.72% 946
938 894
106% 105%
3.9% 7.1% B B
CA
12255 53.85% 55.73%
55.04% 6599 6830
6745 98% 101%
21.3% 32.3% K B
CO
2103 49.47% 49.07%
47.63% 1040 1032
1002 104% 103%
11.0% 16.9% B B
CT
1551 55.32% 58.47%
55.27% 858
907 857
100% 106%
48.8% 1.6% B B
DC
224 87.64% 91.63%
90.52% 197
205 203
97% 101%
2.7% 22.9% K B
DE
372 54.22% 58.44%
53.83% 202
217 200
101% 109%
39.9% 0.1% B B
FL
7548 51.55% 49.93%
47.48% 3891 3769
3584 109% 105%
0.3% 5.1% B B
GA
3280 44.68% 43.11%
41.65% 1466 1414
1366 107%
104% 2.2%
16.5% B B
HI
426 50.00% 53.32%
54.40% 213
227 232
92% 98%
0.2% 23.5% K K
IA
1494 53.19% 50.67%
49.66% 795
757 742
107% 102%
0.9% 25.0% B B
ID
590 33.71% 33.33%
30.68% 199
197 181
110% 109%
2.2% 3.8% B B
IL
5239 56.25% 57.13%
55.21% 2947 2993
2892 102% 103%
24.3% 10.0% B B
IN
2448 40.21% 40.97%
39.58% 984
1003 969
102% 104%
33.7% 17.7% B B
KS
1171 38.14% 34.60%
37.13% 447
405 435
103% 93%
25.0% 4.6% B K
KY 1782
41.05% 40.76% 39.99%
732 726
713 103%
102% 24.0% 30.6%
B B
LA
1922 45.45% 44.50%
42.67% 874
855 820
107% 104%
3.2% 11.2% B B
MA
2875 70.33% 66.46% 62.74%
2022 1911
1804 112%
106% 0.0%
0.7% B B
MD
2359 55.67% 57.04%
56.57% 1313 1346
1334 98% 101%
27.5% 37.6% K B
ME
727 56.18% 54.83%
54.58% 408
399 397
103% 100%
14.4% 43.4% B B
MI
4793 53.61% 52.55%
51.73% 2569 2519
2479 104% 102%
10.5% 29.1% B B
MN
2792 54.17% 54.61%
51.76% 1512 1525
1445 105% 106%
5.4% 2.9% B B
MO
2715 47.31% 47.47%
46.38% 1284 1289
1259 102% 102%
26.7% 23.3% B B
MS
1130 45.16% 43.20%
40.49% 511
488 458
112% 107%
0.1% 3.6% B B
MT
440 38.71% 39.28%
39.50% 170
173 174
98% 99%
70.1% 44.2% K K
NC
3487 48.45% 47.31%
43.76% 1690 1650
1526 111% 108%
0.1% 0.9% B B
ND
308 38.89% 33.58% 36.09%
120 103
111 108%
93% 3.1%
4.7% B K
NE
767 34.41% 36.54%
33.15% 264
280 254
104% 110%
20.1% 1.2% B B
NH
672 50.00% 55.49%
50.69% 336
373 341
99% 109%
32.3% 0.1% K B
NJ
3581 54.35% 56.13%
53.37% 1946 2010
1911 102% 105%
25.7% 3.3% B B
NM
748 50.00% 51.34%
49.60% 374
384 371
101% 104%
39.5% 12.3% B B
NV
816 50.00% 50.66%
48.68% 408
413 397
103% 104%
19.0% 9.4% B B
NY
7277 59.38% 63.97%
59.29% 4321 4655
4314 100% 108%
47.7% 0.1% B B
OH
5599 51.55% 52.06%
48.94% 2886 2915
2740 105%
106% 4.1% 1.9%
B B
OK
1464 31.46% 34.73%
34.43% 461
508 504
91% 101%
2.4% 42.1% K B
OR
1810 53.19% 51.22%
52.11% 963
927 943
102% 98%
23.5% 27.8% B K
PA
5732 52.63% 54.41%
51.26% 3017 3119
2938 103% 106%
18.0% 1.8% B B
RI
429 60.87% 64.24%
60.58% 261
275 260 100%
106% 42.3%
0.7% B B
SC
1600 43.30% 45.78%
41.36% 693
732 662
105% 111%
9.9% 0.2% B B
SD
382 44.68% 37.42%
39.09% 171
143 149
114% 96%
0.0% 13.3% B K
TN
2421 48.98% 41.15%
42.81% 1186
996 1036
114% 96%
0.0% 13.4% B K
TX
7360 38.54% 36.84%
38.49% 2837 2711
2833 100% 96%
48.6% 13.5% B K
UT
905 25.81% 29.93%
26.65% 234
271 241
97% 112%
28.6% 1.4% K B
VA
3172 47.96% 47.96%
45.87% 1521 1521
1455 105% 105%
8.1% 8.1% B B
VT
305 56.99% 65.69%
60.30% 174
201 184
95% 109%
1.4% 0.0% K B
WA
2815 54.17% 55.07%
53.65% 1525 1550
1510 101% 103%
36.4% 17.2% B B
WI
2968 53.68% 50.21%
50.19% 1593 1490
1490 107%
100% 1.0%
49.4% B B
WV
750 48.42% 45.19%
43.52% 363
339 327
111% 104%
0.1% 13.2% B B
WY
238 30.85% 32.07%
29.69% 74
76 71
104% 108%
21.9% 5.6% B B
_____________________________________________________________________
Evaluation of Edison/Mitofsky Election
System - January 19, 2005
Glossary of Terms
Absentee/Early Voter Telephone Surveys
The surveys were conducted in 13 states that had a high proportion of absentee/early voters. The estimates from these surveys were used to adjust the exit poll estimates from Election Day to account for the absentee/early voters who can not be interviewed at the polling location on Election Day. The questionnaire responses in these surveys were also incorporated in the survey analysis in the 13 state surveys and the national survey.
Age-Race-Sex adjustment
An adjustment performed based upon the refusals and misses from sample voters that are observed by the interviewers at each polling location. The age, race and gender compositions in the exit poll results are adjusted to account for the differing completion rates of these demographic groups.
Best Survey Estimate
The computation with the lowest SEDF (Standard Error on the Difference) using only the exit poll tallies.
Completion Rate
The percentage of sample voters who agree to fill out the questionnaire. The rate equals completed questionnaires divided by completed questionnaires plus refusals plus missed voters who were in the sample.
Composite Estimate
A weighted average of the Prior Estimate and the Best Survey Estimate. The Composite Estimate is most often the estimate used in the survey weighting process to create the exit poll analysis data on Election Day before the actual vote is reported.
County
Model
A set of computations based upon county data that is being reported by the Associated Press.
Critical Value (Crit)
The t-score is the ratio of the estimated difference between the two leading candidates and the standard error on the difference (SEDF). A critical value occurs when this ratio is 2.6 or more. The critical value increases when there are 40 or fewer sample precincts. This critical value is the first of several criteria for a “Call Status.” It means there is a .995 statistical probability that the leader is the winner. It only accounts for sampling error in the estimate. It does not account for other possible sources of error or statistical bias.
Cross
Survey
A procedure in which state surveys are combined to form estimates of survey characteristics. When state surveys are combined in this way, the respondent weights are adjusted so that each state survey is represented in its correct proportion of the total. The Cross Survey is different from the National Survey. The Cross Survey only includes questions common to the state surveys.
Decision Screens
Provide the details for the 14 different estimates that are computed for each Election Day race. In addition, these screens include details on estimated candidate votes with and without exit poll results, with and without absentee votes factored in, sampling errors for all estimates, estimates by stratum, and quality control information.
Integrated Model
A vote share computation based upon a composite of the estimates from the Sample Precinct Model and the County Model.
Interviewing Rate
Each exit poll interviewer is assigned an Interviewing Rate that is used to select sample voters as they leave the polling place. The interviewing rate is defined as the number of voters that the interviewer counts between sample voters. An interviewing rate of “1” means that the interviewer will approach every voter; an interviewing rate of “10” means that the interviewer will approach every 10th voter.
Miss Rate
The percentage of voters designated to be in the sample that are missed by the interviewer because the interviewer could not physically approach the voter and ask them to fill out a questionnaire.
National Exit Poll (National Survey)
Is based on the results from a national sample of 250 polling locations. These 250 locations are a sub-sample of the 1,480 locations that are in the state samples. In addition, 500 telephone interviews of absentee/early voters in 13 states with a high proportion of absentee/early voters were included in the National Exit Poll results. There were four different versions of the national exit poll questionnaire. One–fourth of the sample at every national exit poll location was asked to complete each version of the national questionnaire.
Prior Estimate
Based upon pre-election surveys conducted in each state. The Prior Estimate is used in combination with the Best Survey Estimate on Election Day to create a Composite Estimate.
Projections
Based on an estimate of the vote. The first of many requirements for projecting a winner is that the leading candidate is estimated to be ahead of his or her nearest challenger by a margin that is sufficiently larger than the standard error. That margin would have to be 2.6 (at a minimum) times the standard error on the difference between the two candidates. The probability of incorrectly concluding that the leading candidate is ahead is .005.
Refusal Rate
The percentage of sampled voters who are approached by the interviewer, but who refuse to fill out the questionnaire.
Sample Precinct Model
A set of computations under different assumptions that use either precinct level exit poll results or actual vote returns. The exit poll results and actual vote returns may be used separately or in combination.
Standard Error on the Difference (SEDF)
We select only one sample of precincts per state out of the many different samples that could have been selected. Each possible sample will have a slightly different estimate of the election result. A standard error is a measure of the variation in all those possible results. While most samples have results that are close to the average for all the samples, it is theoretically possible that the one sample we selected differs from the overall average. The standard error tells us the likelihood of having a sample that differs from the overall average by given amounts. For making projections we are interested in the Standard Error on the Difference (SEDF). It is computed on the difference between the top two candidates for each estimate.
Survey Call 1, 2,
3
Exit poll interviewers call in the results of their interviews to our telephone centers three times during Election Day. Call1 is shortly before noon local time. Call 2 is in the late afternoon. Call 3 is during the last hour before the time the polls close. The exit poll is not complete until the Call 3 interviews are used in the computations.
Survey Weighting
The process by which the respondents in each survey are weighted for the exit poll analysis. This weighting process takes into account the probabilities of selection of the precinct and the sample voters within each sample precinct, the age-race-sex adjustment for non-interviews, the best estimate of the candidate vote percentages from each geographic region, and if applicable the portion of the vote that is being cast by absentee/early voters.
t-score
For the value of the “t-score” see the definition of Critical Value. The “t” refers to a distribution of probabilities for these scores for small samples.
Within Precinct Error (WPE)
The average difference between the percentage margin for the leading candidates in the exit poll and the actual vote for all sample precincts in a state. The signed WPE gives the direction of this error; in this report a negative WPE represents a Bush overstatement in the exit poll and a positive WPE represents a Republican overstatement in the exit poll. The absolute WPE represents the total error.
_____________________________________________________________________
The purpose of this analysis is to illustrate why Kerry won by assuming the
following conservative assumptions:
1) All 105.4m Election 2000 voters turned out to vote in 2004
2) All Election 2004 votes cast were counted and equal to the 122.3m recorded.
3) All Gore 2000 voters voted for Kerry; all Bush 2000 voters voted for Bush in 2004.
4) Kerry won 64% of returning
Nader/other voters; Bush 17%; Nader/others 19%.
5) Kerry won 57% of new voters (did not vote in 2000); Bush 41%; Nader/others
2%.
1) is impossible, since some 2000 voters died and others did not vote in 2004,
2) is not true, since millions of votes are uncounted in every election,
3) is not true, since a percentage of Gore and Bush voters defected,
4) is a plausible 12:22am National Exit Poll result,
5 ) is a plausible 12:22am NEP result.
Based on these assumptions, a simple calculation shows that Kerry won by 63-58m with 51.64% of the vote:
Kerry = 100% of Gore voters + 64% of Nader/other voters + 57% of New voters
63,153 = 51,003 + 2,531 + 9,619
This result approximated Kerry’s 51.81% national share based on the unadjusted
state exit polls (WPE method) and closely matched the 2004 Election Model.
The Monte Carlo simulation projected that Kerry would capture 51.80% of the
two-party vote assuming that he won 75% of late undecided voters) and gain 337
electoral votes (based on the average of 5000 election trials).
These three scenarios display the effects of changes in assumptions 4 and 5 on the Kerry vote share.
Base Case:
Kerry captures 57% of new voters and 64% of returning Nader/other 3rd party voters.
Kerry wins by 5.1m votes, 51.64% vote share and 337 Electoral votes.
Best Case:
Kerry captures 59% of new voters and 66% of returning Nader/other 3rd party voters.
Kerry wins by 5.9m votes, 51.98% and 348 EV
Worst Case:
Kerry captures 55% of new voters and 62% of returning Nader/other 3rd party voters.
Kerry wins by 4.2m votes, 51.30% and 316 EV
Now we will determine the True Vote by using plausible assumptions for 1,2 and 3 above.
The True Vote
a) Approximately 5m Election
2000 voters died; another 5m did not vote, assuming 95% turnout.
Therefore, there were actually 27m new voters (the net increase was
17m).
The additional 10m new voters increased Kerry's margin by 1.5m.
b) The NEP determined that 8% of
Gore voters and 10% of Bush voters defected.
The net defection increased Kerry's margin by 1.0 million votes.
c) According to the U.S. Census,
there were 3.4 million uncounted votes.
The majority (70-80%) were Kerry votes, increasing his margin by 1.5
million votes.
Adding the total increase in Kerry’s margin, the TrueVote was: Kerry 67- Bush 57- Other 1.7
Kerry’s 67m = 63 + 1.5 + 1.0 + 1.5
2000
(Votes in thousands)
Recorded
Gore Bush Nader Other
Margin
105,417 51,003
50,460 2,883 1,070 543
48.38% 47.87% 2.73% 1.02%
0.52%
2004
Recorded
Kerry Bush Nader Other Margin
122,293 59,028
62,040 465 758 3,012
48.27% 50.73%
0.38% 0.62% 2.46%
2000
Nader/Other vote
allocation
Recorded
Kerry Bush Nader Other
Margin
3,953
2,530 672 276
474 1,858
Exit Poll
64% 17%
7% 12% 47%
2004
New Voter allocation
Recorded
Kerry Bush Nader Other
Margin
16,876
9,619 6,919 118
219 2,700
Exit Poll
57% 41% 0.7%
1.3% 16%
Adjusted True
Vote
Adjusted
Kerry Bush Nader
Other Margin
122,293
63,153 58,051 394
693 5,102
Share
51.64% 47.47% 0.32% 0.57% 4.17%
Sensitivity
Analysis
Kerry % of New
Voters
55% 56% 57%
58% 59%
Kerry%
Other
Kerry Vote
Share
62% 51.30% 51.44% 51.58% 51.71%
51.85%
63% 51.33% 51.47% 51.61% 51.75%
51.88%
64% 51.36% 51.50% 51.64%
51.78% 51.92%
65% 51.40% 51.54% 51.67% 51.81%
51.95%
66% 51.43% 51.57% 51.71% 51.84%
51.98%
Electoral
Vote
62% 316
316 337 337 348
63% 316
326 337 337 348
64% 316
337 337 348
348
65% 316
337 337 348 348
66% 316
337 337 348
348
Vote Margin
62% 4,268 4,606 4,943 5,281 5,619
63% 4,347 4,685 5,023 5,360 5,698
64% 4,427 4,764 5,102 5,439
5,777
65% 4,506 4,843 5,181 5,518 5,856
66% 4,585 4,922 5,260 5,597 5,935
Base Case Scenario
2000 Recorded
2004
Recorded
2004 Adjusted
State
Gore Bush Nader Other
Kerry Bush
Other EV
Kerry Bush Nader Other
Total
48.38% 47.87% 2.73% 1.02% 48.27% 50.73% 1.00%
337 51.64% 47.47% 0.32% 0.57%
Alabama
41.6% 56.5% 1.1%
0.9% 36.8%
62.5% 0.7%
44.4% 55.0% 0.20% 0.35%
Alaska
27.7% 58.6% 10.1%
3.7% 35.5%
61.1% 3.4%
38.2% 59.2% 0.94% 1.62%
Arizona
44.7% 51.0% 3.0%
1.4% 44.4%
54.9% 0.7% 10 49.7% 49.2%
0.40% 0.71%
Arkansas 45.9%
51.3% 1.5%
1.4% 44.6%
54.3% 1.2%
48.9% 50.4% 0.26% 0.46%
California 53.5% 41.7%
3.8% 1.1%
54.3% 44.4% 1.3% 55 56.6%
42.3% 0.38% 0.67%
Colorado 42.4%
50.8% 5.3%
1.6% 47.0%
51.7% 1.3%
48.6% 49.9% 0.52% 0.91%
Connecticut 55.9% 38.4%
4.4% 1.2%
54.3% 44.0% 1.7% 7
59.3% 39.5% 0.42% 0.72%
Delaware 55.0%
41.9% 2.5%
0.6% 53.4%
45.8% 0.9% 3 57.0%
42.3% 0.28% 0.49%
D.
C. 85.2% 9.0%
5.2% 0.7%
89.2% 9.3% 1.5% 3
85.3% 13.5% 0.44% 0.77%
Florida
48.8% 48.9% 1.6%
0.7% 47.1%
52.1% 0.8% 27 51.8% 47.5%
0.28% 0.50%
Georgia
43.0% 54.7% 0.5%
1.8% 41.4%
58.0% 0.7%
47.2% 52.1% 0.28% 0.50%
Hawaii
55.8% 37.5% 5.9%
0.9% 54.0%
45.3% 0.7% 4 59.7%
38.9% 0.50% 0.88%
Idaho
27.6% 67.2% 2.5%
2.7% 30.3%
68.4% 1.4%
35.2% 63.7% 0.42% 0.73%
Illinois 54.6%
42.6% 2.2%
0.6% 54.8%
44.5% 0.7% 21 56.5% 42.9%
0.25% 0.44%
Indiana
41.0% 56.7% 0.8% 1.5%
39.3% 59.9%
0.8% 44.1%
55.3% 0.22% 0.39%
Iowa
48.5% 48.2% 2.2%
1.0% 49.2%
49.9% 0.9% 7 51.4%
47.8% 0.29% 0.50%
Kansas
37.2% 58.0% 3.4%
1.4% 36.6%
62.0% 1.4%
41.9% 57.1% 0.37% 0.64%
Kentucky 41.4%
56.5% 1.5%
0.6% 39.7%
59.6% 0.8%
44.7% 54.6% 0.23% 0.40%
Louisiana 44.9%
52.6% 1.2%
1.4% 42.2%
56.7% 1.1%
47.5% 51.9% 0.23% 0.40%
Maine
49.1% 44.0% 5.7%
1.3% 53.6%
44.6% 1.9% 4 53.9%
44.7% 0.51% 0.89%
Maryland 56.6%
40.2% 2.7%
0.6% 55.9%
42.9% 1.2% 10 58.4% 40.8%
0.30% 0.53%
Massachusetts 59.8% 32.5%
6.4% 1.3%
61.9% 36.8% 1.3% 12 64.2%
34.3% 0.55% 0.95%
Michigan 51.3%
46.1% 2.0%
0.6% 51.2%
47.8% 1.0% 17 53.4% 45.9%
0.25% 0.43%
Minnesota 47.9%
45.5% 5.2%
1.4% 51.1%
47.6% 1.3% 10 52.8% 45.8%
0.49% 0.86%
Mississippi 40.7% 57.6%
0.8% 0.9%
39.8% 59.4%
0.8% 43.9%
55.6% 0.20% 0.35%
Missouri 47.1%
50.4% 1.6%
0.9% 46.1%
53.3% 0.6% 11 49.8% 49.5%
0.25% 0.44%
Montana
33.4% 58.4% 6.0%
2.3% 38.6%
59.1% 2.4%
40.2% 58.2% 0.58% 1.01%
Nebraska 33.3%
62.3% 3.5%
1.0% 32.7%
65.9% 1.4%
38.3% 60.7% 0.36% 0.62%
Nevada
46.0% 49.5% 2.5%
2.0% 47.9%
50.5% 1.7% 5 51.0%
47.8% 0.42% 0.74%
New Hampshire 46.8% 48.1%
3.9% 1.2%
50.2% 48.9% 0.9% 4
51.2% 47.7% 0.41% 0.72%
New Jersey 56.1% 40.3%
3.0% 0.6%
52.9% 46.2% 0.8% 15 58.3%
40.9% 0.30% 0.53%
New Mexico 47.9% 47.9%
3.6% 0.7%
49.1% 49.8% 1.1% 5
52.0% 47.0% 0.38% 0.67%
New York 60.2%
35.2% 3.6%
1.0% 58.4% 40.1%
1.5% 31 62.7% 36.4% 0.35%
0.61%
North Carolina 43.2% 56.0% 0.0%
0.8% 43.6%
56.0% 0.4%
45.9% 53.6% 0.16% 0.30%
North Dakota 33.1% 60.7%
3.3% 3.0%
35.5% 62.9%
1.6% 38.6%
60.1% 0.46% 0.80%
Ohio
46.5% 50.0% 2.5%
1.1% 48.7%
50.8% 0.5% 20 50.1% 49.0%
0.32% 0.57%
Oklahoma 38.4%
60.3% 0.0%
1.3% 34.4%
65.6% 0.0%
42.0% 57.5% 0.18% 0.33%
Oregon
47.0% 46.5% 5.0%
1.5% 51.4%
47.2% 1.5% 7 52.1%
46.5% 0.50% 0.87%
Pennsylvania 50.6% 46.4%
2.1% 0.9%
50.9% 48.4% 0.7% 21 53.2%
46.1% 0.28% 0.50%
Rhode Island 61.0% 31.9%
6.1% 1.0%
59.4% 38.7% 1.9% 4
65.0% 33.6% 0.51% 0.88%
South Carolina 40.9% 56.8% 1.5%
0.8% 40.9%
58.0% 1.1%
44.5% 54.9% 0.24% 0.42%
South Dakota 37.6% 60.3%
0.0% 2.1%
38.4% 59.9% 1.7%
42.3% 57.0% 0.25% 0.45%
Tennessee 47.3%
51.2% 1.0%
0.6% 42.5%
56.8% 0.7%
49.6% 49.9% 0.20% 0.35%
Texas
38.0% 59.3% 2.2%
0.6% 38.2%
61.1% 0.7%
42.1% 57.2% 0.26% 0.46%
Utah
26.3% 66.8% 4.7%
2.2% 26.0%
71.5% 2.5%
35.2% 63.4% 0.52% 0.90%
Vermont
50.6% 40.7% 6.9%
1.8% 58.9%
38.8% 2.3% 3 56.2%
42.1% 0.61% 1.06%
Virginia 44.4%
52.5% 2.2%
0.9% 45.5%
53.7% 0.8%
47.9% 51.3% 0.29% 0.50%
Washington 50.1% 44.6%
4.1% 1.2%
52.8% 45.6% 1.5% 11 54.0%
44.9% 0.41% 0.72%
West Virginia 45.6% 51.9%
1.7% 0.8%
43.2% 56.1%
0.7% 48.6%
50.7% 0.25% 0.44%
Wisconsin 47.8%
47.6% 3.6%
0.9% 49.7%
49.3% 1.0% 10 51.6% 47.4%
0.37% 0.65%
Wyoming
27.7% 67.8% 2.1%
2.4% 29.1%
68.9% 2.1%
33.3% 65.7% 0.36% 0.62%
_____________________________________________________________________
2004 State Exit Poll
Discrepancies by Time Zone and Region
Data Source: Edison-Mitofsky 2004 Exit Poll
Summary Report
Kerry's aggregate state exit poll (unadjusted) share was 51.8% (325 electoral votes).
The Margin of Error was exceeded in 29 of 50 states for Bush.
The MoE was exceeded in only one state (WV) for Kerry.
States in which MoE was exceeded:
Time
Zone
Region
East
15 of 21 East 9 of 12
Central 7 of
16 MidW 6 of 12
Mountain 4 of
8 South 7 of 13
Pacific 3 of
5 West 7 of 13
The final state and national exit poll vote shares were adjusted to match the recorded vote. The "pristine" unadjusted
exit poll results, as measured by the average state WPE (Within Precinct Error), morphed to the Composite
(weighted average of Pre-election and Best Survey estimates) and then to the Final which was forced to match the
Recorded vote. WPE is the difference in margin from exit poll to vote tally.
Exit Poll Kerry Vote
Share
State aggregate 51.8% (unadjusted, based
on average WPE)
NEP Location 51.7
(WPE-adjusted state aggregate)
NEP Region
50.5 (12:22am adjusted Composite)
NEP Region 48.2
(FINAL matched to recorded vote)
State
Exit Poll Weighted- Unadjusted Vote shares based on WPE
REGION
Vote Weight
Kerry Bush Other
East
27.18 22.2% 60.3% 39.0%
0.7%
Midwest 30.94
25.3% 51.4% 47.8% 0.8%
South
39.32 32.2% 44.9% 54.4%
0.7%
West
24.84 20.3% 54.2% 44.4%
1.4%
Total
100%
51.8% 47.3% 0.9%
Votes 122.3
122.3 63.3 57.8
1.2
National
Exit Poll
Unadjusted
Vote Shares
(based
on average WPE)
LOCATION
Votes
Mix Kerry
Bush Other Kerry
Bush Other Margin
Big City
15.9 13% 64.95%
35.05% 0%
10.3 5.6
0.0 4.6
Small
City 22.0
18% 53.25% 44.75%
2% 11.7
9.9 0.4
1.9
Suburbs
55.0
45% 51.05% 47.95%
1% 28.1
26.4 0.6
1.7
Small
Town 9.8
8% 50.45% 47.55%
2% 4.9
4.7 0.2
0.3
Rural
19.6 16% 41.80%
57.20% 1%
8.2 11.2
0.2 -3.0
TOTAL
122.3
100% 51.7% 47.2%
1.1% 63.3 57.7
1.4 5.6
Regional
Popular and Electoral Vote (WPE based)
EV Electoral vote
KEV Kerry Electoral Vote
(Exit Poll)
KE Kerry Exit Poll
Vote
KV Kerry Recorded Vote
KEP Kerry Exit Poll percent
KVP Kerry Recorded Vote percent
WPE Within Precinct Error
Diff = KE - KV
WPE = 2*Diff
Unadjusted
Regional Vote Shares
(based
on regional average WPE)
REGION
EV
Vote
Weight WPE
KE KV
KEP KVP
KEV
East
122
27,177 22.2% 9.21% 16,376
15,124 60.3% 55.7%
117
Midwest
124
30,940 25.3% 5.96% 15,889
14,966 51.4% 48.4%
85
South
168
39,324 32.2% 5.66% 17,662
16,550 44.9% 42.1%
27
West
124
24,844 20.3% 8.18% 13,461
12,445 54.2% 50.1% 96
Total
538
122,284 100.0% 7.04% 63,388
59,085 51.8% 48.3% 325
NEP
Regional Demographic
(adjusted
Composite and Final)
12:22am
Composite
2pm Final
REGION
Vote Weight Kerry
Bush
Other
Weight Kerry Bush Other
East
26.91 22%
58% 41%
1%
22% 56%
43% 1%
Midwest 31.80
26% 50%
49%
1%
26% 48%
51% 1%
South
37.91 31%
44% 54%
2%
32% 42%
58% 0%
West
25.68 21%
53% 45%
2%
20% 50%
49% 1%
Total
100% 50.53% 47.95%
1.52%
100% 48.24% 51.08% 0.68%
Votes
122.3 122.3 61.8
58.6
1.9
122.3 59.0
62.5 0.8
STATE
KEV Vote
WPE KE
KV BE
BV Diff
MoE Diff/MoE
EAST
CT*
7 1,578 15.7
62.2 54.3
36.1 43.9 7.85
3.27 2.40
DC
3 378
3.4 90.9
89.2 37.8 9.3
1.70 1.92 0.88
DE*
3 226
15.9 61.3
53.3 37.8
45.8 7.95
3.48 2.28
MA
12 2,912 5.8
64.8
61.9 33.9
36.8 2.90
3.10 0.93
MD*
10 2,386 8.1
60.0
55.9 38.9
42.9 4.05
3.07 1.32
ME
4 741
3.8 55.5
53.6 42.7
44.6 1.90
2.20 0.86
NH*
4 678
13.6 57.0
50.2 42.1
48.9 6.80
2.27 3.00
NJ*
15 3,611 9.7
57.8
52.9 41.4
46.2 4.85
2.49 1.94
NY*
31 7,391 11.4
64.1 58.4
34.4 40.1 5.70
2.47 2.31
PA*
21 5,770 8.8
55.3
50.9 44.0
48.4 4.40
2.22 1.98
RI
4 437
4.7 61.8
59.4 36.3 38.7
2.35 3.30 0.71
VT*
3 312
15.0 66.4
58.9 31.3
38.8 7.50
3.56 2.11
WV* 756
(5.8) 40.3
43.2 59.0
56.1 -2.90
2.35 -1.23
MIDWEST
IA
7 1,507 3.0
50.7
49.2 48.4
49.9 1.50
1.96 0.77
IL
21 5,276 4.4
57.0
54.8 42.3
44.5 2.20
2.60 0.85
IN 2,468 1.5
40.0
39.3 59.2
59.9 0.75
3.17 0.24
KS 1,187 1.7
37.5
36.6 61.2
62.0 0.85
3.65 0.23
MI*
17 4,839 6.3
54.4
51.2 44.7
47.8 3.15
1.98 1.59
MN*
10 2,829 9.3
55.7
51.1 43.0
47.6 4.65
2.09 2.22
MO* 2,731 5.8
49.0
46.1 50.4
53.3 2.90
2.11 1.38
ND 313
(5.2) 32.9
35.5 65.5
62.9 -2.60
3.63 -0.72
NE* 778 8.1
36.7 32.7
61.8 65.9
4.05 3.37 1.20
OH*
20 5,626 10.9
54.2 48.7
45.4 50.8 5.45
2.21 2.47
SD 388
(4.2) 36.3
38.4 62.0
59.9 -2.10
2.45 -0.86
WI*
10 2,997 4.7
52.0
49.7 47.0
49.3 2.35
2.08 1.13
SOUTH
AL*
1,883 11.3 42.5
36.8 56.8
62.5 5.65
3.57 1.58
AR
2,021 0.5
44.8 44.5 54.1
54.3 0.25
2.61 0.10
FL*
27 7,610 7.6
50.9
47.1 48.3
52.1 3.80
1.84 2.07
GA
3,301 2.2
42.5 41.4
56.9 58.0
1.10 2.48 0.44
KY
1,796 (0.1) 39.6
39.7 59.6
59.6 -0.05
3.00 -0.02
LA
1,943 3.8
44.1 42.2
54.8 56.7
1.90 2.38 0.80
MS*
1,139 11.3 45.8
40.2 53.4
59.0 5.65
3.44 1.64
NC*
3,501 11.3 49.2
43.6 50.4
56.0 5.65
2.10 2.69
OK
1,464 (1.9) 33.5
34.4 66.5
65.6 -0.95
2.38 -0.40
SC*
1,618 10.0 45.9
40.9 53.0
58.0 5.00
2.34 2.13
TN
2,437 0.5
42.8 42.5
56.5 56.8
0.25 2.29 0.11
TX*
7,411 4.8
40.6 38.2
58.7 61.1 2.40
2.31 1.04
VA*
3,199 7.9 49.4
45.5 49.7
53.7 3.95
2.59 1.53
WEST
AK*
313 9.6
40.3 35.5
56.3 61.1
4.80 3.18 1.51
AZ*
1,051 4.6
46.7 44.4
52.6 54.9 2.30
2.27 1.01
CA* 55 12,420
10.9 59.8
54.3 38.9
44.4 5.45
2.22 2.45
CO*
9 2,130 6.1
50.1
47.0 48.6
51.7 3.05
1.95 1.56
HI
4 429
4.7 56.4
54.0 42.9
45.3 2.35
4.38 0.54
ID
598 1.0
30.8 30.3
67.9 68.4
0.50 3.91 0.13
MT
451 (1.8)
37.7 38.6
60.0 59.1
-0.90 3.78 ; -0.24
NM*
5 756
7.8 52.9 49.0
45.9 49.8
3.90 2.22 1.76
NV*
5 830
10.1 52.9
47.9 45.4
50.5 5.05
2.13 2.37
OR
7 1,837 0.0
51.3
51.3 47.2
47.2 0.00
3.00 0.00
UT*
928 6.4
29.2 26.0
68.3 71.5
3.20 3.18 1.01
WA*
11 2,859 8.4
57.0
52.8 41.4
45.6 4.20
2.12 1.98
WY
243 4.3
31.2 29.1
66.7 68.9
2.15 3.50 0.61
_________________________________________________________________________________
Composite State Exit Polls
(12:22am)
Eastern:
All 21 states (and DC) deviated to Bush by an average of 2.80%; the odds: 1 in 4.2 million.
12 deviated beyond the margin of error; Probability: 1 in 32 trillion.
Ohio and Florida flipped from Kerry to Bush.
Central:
11 of 16 states deviated to Bush by an average of 0.82%; the odds: 1 in 10
3 deviated beyond the margin of error; Probability: 1 in 146
Iowa flipped from Kerry to Bush
Mountain:
7 of 8 states deviated to Bush by an average of 1.86%; the odds: 1 in 28
None deviated beyond the margin of error.
Nevada and New Mexico flipped from Kerry to Bush.
Pacific:
3 of 5 states deviated to Bush by an average of 0.83%; the odds: 1 in 2
1 deviated beyond the margin of error; Probability: 1 in 8
Poll Poll
Std Exit
Final Vote
Dev Prob
Dev Dev/
Dev/ Dev>
Bush
Size MoE
Dev Poll Vote
Dev Prob 1
in Favor
Std
MoE MoE
Flip
16
5
EASTERN
NH
1849 2.33% 1.19% 55.50
50.68 -4.81% 0.00%
39823 Bush -4.05
2.07
yes
NY
1452 2.62% 1.34%
63.97 58.79 -5.17%
0.01% 17833 Bush
-3.86 1.97 ;
yes
SC
1735 2.40% 1.22%
45.79 41.31 -4.48%
0.01% 7851
Bush -3.66
1.87
yes
NC
2167 2.15% 1.10%
47.31 43.72 -3.60%
0.05% 1939 Bush
-3.28 1.67 ;
yes
OH
1963 2.26% 1.15%
52.06 48.75 -3.31%
0.20% 495
Bush -2.88
1.47
yes yes
PA
1930 2.28% 1.16%
54.41 51.13 -3.28%
0.24% 420 Bush
-2.82 1.44 ;
yes
VT
685 3.82%
1.95% 65.69 60.34
-5.35% 0.30% &nbssp; 330
Bush -2.74
1.40
yes
FL
2846 1.87% 0.96%
49.93 47.47 -2.46%
0.50% 199 Bush
-2.57 1.31 ;
yes yes
DE
770 3.60%
1.84% 58.44 53.82
-4.62% 0.60% &nbssp; 167
Bush -2.51
1.28
yes
NJ
1520 2.56% 1.31%
56.13 53.13 -3.00%
1.10% 91 Bush
-2.29 1.17 ;
yes
MA
889 3.35%
1.71% 66.46 62.70
-3.76% 1.40% &nbssp;
72 Bush
-2.20 1.12 ;
yes
RI
809 3.52%
1.79% 64.24 60.48
-3.76% 1.82% &nbssp;
55 Bush
-2.09 1.07 ;
yes
CT
872 3.39%
1.73% 58.47 55.24
-3.24% 3.05% &nbssp;
33 Bush
-1.87 0.96 ;
VA
1431 2.64% 1.35%
47.96 45.65 -2.31%
4.34% 23 Bush
-1.71 0.87 ;
WV
1722 2.41% 1.23%
45.19 43.48 -1.72%
8.13% 12 Bush
-1.40 0.71 ;
GA
1536 2.55% 1.30%
43.11 41.58 -1.53%
12.02% 8
Bush -1.17 0.60
IN
926 3.29%
1.68% 40.97 39.46
-1.51% 18.33%
5 Bush
-0.90 0.46 ;
MI
2452 2.02% 1.03%
52.55 51.73 -0.82%
21.39% 5
Bush -0.79
0.40
DC
795 3.55%
1.81% 91.63 90.63
-1.00% 29.01%
3 Bush
-0.55 0.28 ;
MD
1000 3.16% 1.61%
57.04 56.25 -0.79%
31.24% 3 Bush
-0.49 0.25 ;
KY
1034 3.11% 1.59%
40.76 39.99 -0.76%
31.57% 3 Bush
-0.48 0.24 ;
ME
1968 2.25% 1.15%
54.83 54.48 -0.36%
37.88% 3 Bush
-0.31 0.16 ;
CENTRAL
MN
2178 2.14% 1.09%
54.61 51.76 -2.85%
0.46% 218 Bush
-2.61 1.33 ;
yes
NE
785 3.57%
1.82% 36.54 32.53
-4.01% 1.39% &nbssp;
72 Bush
-2.20 1.12 ;
yes
AL
730 3.70%
1.89% 41.08 37.08
-4.00% 1.70% &nbssp;
59 Bush
-2.12 1.08 ;
yes
MS
798 3.54%
1.81% 43.20 39.91
-3.30% 3.40% &nbssp;
29 Bush
-1.83 0.93 ;
AR
1402 2.67% 1.36%
46.93 44.74 -2.19%
5.39% 19 Bush
-1.61 0.82 ;
IL
1392 2.68% 1.37%
57.13 54.99 -2.14%
5.90% 17 Bush
-1.56 0.80 ;
LA
1669 2.45% 1.25%
44.50 42.63 -1.87%
6.73% 15 Bush
-1.50 0.76 ;
IA
2502 2.00% 1.02%
50.67 49.54 -1.13%
13.42% 7 Bush
-1.11 0.56 ;
yes
MO
2158 2.15% 1.10%
47.48 46.33 -1.15%
14.80% 7 Bush
-1.05 0.53 ;
OK
1539 2.55% 1.30%
34.73 34.44 -0.29%
41.21% 2 Bush
-0.22 0.11 ;
WI
2223 2.12% 1.08%
50.21 50.20 -0.02%
49.45% 2
Bush -0.01
0.01
TN
1774 2.37% 1.21%
41.15 42.78 1.63%
8.96% 11 Kerry
1.34 0.69
TX
1671 2.45% 1.25%
36.84 38.49 1.65%
9.28% 11
Kerry 1.32
0.68
SD
1495 2.59% 1.32%
37.42 39.09 1.67%
10.27% 10 Kerry
1.27 0.65
ND
649 3.93%
2.00% 33.58 36.09
2.51% 10.51%
10 Kerry 1.25
0.64
KS
654 3.91%
2.00% 34.60 36.97
2.37% 11.76%
9 Kerry
1.19 0.61
MOUNTAIN
NV
2116 2.17% 1.11%
50.66 48.67 -1.99%
3.61% 28
Bush -1.80 0.92
yes
CO
2515 1.99% 1.02%
49.07 47.35 -1.72%
4.52% 22 Bush
-1.69 0.86 ;
NM
1951 2.26% 1.16%
51.34 49.42 -1.93%
4.76% 21
Bush -1.67
0.85 yes
UT
798 3.54%
1.81% 29.93 27.06
-2.87% 5.61% &nbssp;
18 Bush
-1.59 0.81 ;
AZ
1859 2.32% 1.18%
46.60 45.03 -1.57%
9.24% 11
Bush -1.33
0.68
ID
559 4.23%
2.16% 33.33 30.71
-2.63% 11.18%
9 Bush
-1.22 0.62 ;
WY
684 3.82%
1.95% 32.07 29.70
-2.37% 11.24%
9 Bush -1.21
0.62
MT
640 3.95%
2.02% 39.28 39.51
0.22% 45.60%
2 Kerry
0.11 0.06
PACIFIC
AK
910 3.31%
1.69% 40.14 36.17
-3.97% 0.94% &nbssp; 106
Bush -2.35
1.20
yes
WA
2123 2.17% 1.11%
55.07 53.60 -1.47%
9.25% 11 Bush
-1.33 0.68 ;
CA
1919 2.28% 1.16%
55.73 55.21 -0.53%
32.58% 3
Bush -0.45
0.23
OR
1064 3.07% 1.56%
51.22 51.97 0.75%
31.67% 3 Kerry
0.48 0.24
HI
499 4.48%
2.28% 53.32 54.37
1.05% 32.24%
3 Kerry
0.46 0.24
SUMMARY
Poll Poll
Std Exit
Final Vote
Dev Prob
Dev Dev/
Dev/ Dev> Bush
Size MoE
Dev Poll
Vote Dev Prob
1 in Favor
Std
MoE MoE Flip
Average
1443 2.85% 1.46%
48.84 47.00 -1.84%
10.34% 10
0 -1.33
0.83 16 5
Median
1495 2.59% 1.32%
49.07 47.35 -1.93%
6.73% 15
0 -1.50
0.76
DEVIATIONS
BY REGION
East 1471
2.78% 1.42% 55.11
52.31 -2.80% 9.24%
3153 22
-2.03 1.04 ;
12 2
Central
1476 2.80% 1.43%
43.17 42.35 -0.82%
12.16% 31
11 -0.59
0.71 3
1
Mountain 1390
3.04% 1.55% 41.54
39.68 -1.86% 11.97%
15
7 -1.30
0.68 0
2
Pacific
1303 3.06% 1.56%
51.10 50.26 -0.83%
21.34% 25
3 -0.64
0.52 1
0
DEVIATION
PROBABILITIES BY REGION
No. Over MOE Probability:1
in Bush Probability:1
in
East
22 12
32 trillion
22 4.2 million
Central
16
3 146
11 10
Mountain
8
0
1
7 28
Pacific
5
1
8
3 2
___________________________________________________________________________________________________
Naysayers claimed that the raw exit poll data which have not been made public indicates that there was no tendency for Bush to do better in 2004 relative to 2000 (“swing”) than he did in the 2004 exit poll (“red-shift”). They presented their analysis in a swing vs. red-shift scatter chart and concluded from the flat regression line that the exit poll discrepancies had little effect and therefore fraud was unlikely.
But the analysis was not supported by the mathematics; there are an infinite number of scenarios which would invalidate the premise.And they were comparing apples to oranges; they did not adjust the 2000 recorded vote. According to the 2004 National Exit Poll, Kerry won 71% of returning Nader voters compared to 21% for Bush. A similar split would have increased Gore’s margin by 1.4mm.
Assuming that 75% of approximately 3 million uncounted votes were for Gore, his margin increases by another 1.5m. When added to his recorded 540,000 vote majority, Gore’s adjusted margin becomes 3.4m. And that does not consider the effects of vote-switching. Thanks to Ohio, we know a lot more about vote-switching than we did in 2000. It’s very likely that Gore votes were switched to Bush. If 1.5 m (3%) were switched, then his final adjusted margin is 6.4 million: 3.0 switched + 1.5 uncounted + 1.4 Nader + 0.54 recorded.
They never normalized the 2-party state vote shares in calculating “swing”. Assuming zero vote-switching from Gore to Bush in 2000, actual adjusted swing was 3.9%, recorded swing 2.0%; red-shift 4.1% (WPE-adjusted exit poll). For 3% vote- switching, average adjusted state swing was 4.0%; average red-shift 1.5% (12:22am composite exit poll). Weighted average adjusted swing was 3.74%; weighted average red-shift, 1.41%.
Adjusted swing exceeded red-shift in 32 states. Average adjusted swing was 2.58%; weighted average swing was 2.39%. An adjusted swing vs. redshift bar graph displays the deviations. Another scatter chart shows that adjusted swing exceeded 4% in 18 states while red-shift exceeded 4% in only 2 states. The naysayer swing vs. red-shift argument is just another ruse meant to divert, confuse and mislead.
Of the eight states which blue-shifted to Kerry, six were deep-red (exit poll discrepancies in parenthesis):
TN (1.63), TX (1.65), SD (1.67), ND (2.51), KS (2.37) and MT (0.22).
The other two states were competitive: OR (.75), HI (1.25) also shifted to Kerry. All discrepancies fell within the state exit poll margin of error. Is it just a coincidence that these deep-red states deviated to Kerry? Or was it because there was little incentive to steal votes in there? Since Oregon is the only state with 100% paper ballots (mail), a small discrepancy is to be expected - and could favor either Bush or Kerry with equal probability. And since Hawaii is a small state, was it also not a priority when compared to all the other vote-rich battleground /blue states?
The recorded 2000 vote was adjusted using three factors:
1) Third-party (primarily Nader) share of 2000 voters:
According to the National Exit Poll, Kerry won returning Nader 2000 voters by 71-21% over Bush. We need to revise the 2000 vote totals accordingly by allocating the Nader vote to Gore and Bush by the same proportion.
2) Uncounted votes:
According to the 2004 Election Census, there were 125.7mm total votes cast but only 122.3mm were recorded; 3.4mm (2.74%) were uncounted. In 2000, there were 104.7mm votes recorded. Assuming the 2004 uncounted vote rate in 2000, 107.7mm total votes were cast and 3.0mm were uncounted. Since the majority of uncounted ballots are found in Democratic minority districts, a fair assumption is that 75% of the lost votes were for Gore. There were 180,000 spoiled ballots (under and over votes) in Florida.
3) Switched votes:
The True Vote Model base case scenario indicates that 7.6% of Kerry’s recorded vote (6.8% of total votes cast) were switched to Bush. An exhaustive review of the ballots in Ohio's Cuyahoga County determined that 6.15%were switched. For this analysis, the best case assumption is that 3.0% of Gore votes were switched.
The following is an analysis of the effects of uncounted and switched votes for the 2000 and 2004 elections. The results contradict the argument that no relationship exists between 2004 exit poll red-shift and vote swing from 2000 to 2004.
______________________________________________________________________________
Swing vs. Red Shift –
Selected
States
Assumptions
Uncounted votes (percent of total votes cast)
2000: 3.00%
2004: 2.74%
Dem share: 75%
Switched: 3% from Gore to Bush
Nader vote allocation
Gore 71%
Bush 21%
Other 8%
Definitions
Actual: recorded vote
Adjusted True Vote: Recorded vote + Nader + uncounted + switched votes
Adjusted Swing: Bush 2004 recorded vote share – Bush 2000 adjusted vote share
Red-shift: Bush 2004 recorded vote share – Bush 2004 Exit Poll share
All vote shares are 2-party percentages
Key Result
(WPE adjusted exit poll)
Red-shift exceeded swing in 21 of
the 31 states in which the Bush 2004 recorded vote share exceeded his 2000 vote
share.This refutes the Swing vs.
Red-shift argument that there was no tendency for red-shift to exceed swing.
Red-shift exceeds swing in 39 states.
Composite Polls (12:22am)
Swing R/S Diff
National 1.51%
1.75% 0.26%
OH -0.76
3.12 3.88
FL
2.52 2.45 -0.07
NY
3.81 4.68 0.87
PA
0.88 3.15 2.27
IA
0.49 1.01 0.52
NM
0.43 1.74 1.31
2000 2004
NATIONAL
Gore
Bush Other Kerry
Bush Other
Actual
51004
50459 3275 59028
62040 1228
Other
2285 676
0
0 0
0
Uncounted
2354 785
0 2581
860 0
Switch
1529
-1529 0 &nbbsp;
4488 -4488 0
True
57173
50390 0
66097 58412 0
Actual
50.27%
49.73%
48.76% 51.24%
True
53.15% 46.85%
53.09% 46.91%
NEP Voted
2k
51.93% 48.07%
State Exit
Poll 50.51% 49.49%
Swing
Red-shift Diff
Actual (state)
1.51%
1.75% 0.26%
True (NEP)
4.39%
4.33% -0.06%
Difference
2.88%
2.58%
Actual (NEP)
3.17%
______________________________________________________________________________
OHIO
Gore Bush
Other
Kerry Bush
Actual
2186 2351
144
2740 2859
Other
102 30
0
0
0
Uncounted
105 35
0
119 40
Switch
66 -66
0
199 -199
Adjusted
2459
2351
0
3058 2699
Actual
48.18%
51.82%
48.94% 51.06%
True
51.13%
48.87%
53.12% 46.88%
Exit
Poll
52.06% 47.94%
Swing
Red-shift Diff
Actual
-0.76%
3.12%
3.88%
True
2.19%
4.18% 1.99%
Difference
2.95%
1.06%
______________________________________________________________________________
FLORIDA
Gore Bush
Other
Kerry Bush Other
Actual
2912 2912
2912
3584 3965 56
Other
82 24
0
0
0 0
Uncounted
134 45
0
161 54 0
Switch
87 -87
0
261 -261 0
True
3215
2893
2912
4005 3757 0
Actual
50.00%
50.00%
47.48% 52.52%
True
52.63%
47.37%
51.60% 48.40%
Exit Poll
49.93% 50.07%
Swing
Red-shift Diff
Actual
2.52%
2.45% -0.07%
True
5.15%
4.12% -1.03%
Difference
2.63%
1.67%
______________________________________________________________________________
NEW YORK
Gore
Bush
Other
Kerry Bush Other
Actual
4112 2405
278
4314 2963 112
Other
197 58
0
0 0
0
Uncounted
153 51
0
156 20 0
Switch
123 -123
0
314 -314 0
True
4586
2391
278
4784 2669 112
Actual
63.10%
36.90%
59.29% 40.71%
True
65.73%
34.27%
64.19% 35.81%
Exit
Poll
63.97% 36.03%
Swing
Red-shift Diff
Actual
3.81%
4.68% 0.87%
True
6.44%
4.90%
-1.54%
Difference
2.63%
0.22%
______________________________________________________________________________
PENNSYLVANIA
Gore Bush
Other
Kerry Bush Other
Actual
2485 2281
120
2938 2794 34
Other
85 25
0
0
0 0
Uncounted
110 37
0
122 41 0
Switch
75 -75
0
214 -214 0
True
2755
2268
120
3274 2621 34
Actual
52.14% 47.86%
51.26% 48.74%
True
54.84%
45.16%
55.54% 44.46%
Exit
Poll
54.41% 45.59%
Swing
Red-shift Diff
Actual
0.88%
3.15% 2.27%
True
3.58%
4.28% 0.70%
Difference 2.70%
1.13%
______________________________________________________________________________
IOWA
Gore Bush
Other
Kerry Bush Other
Actual
638 634
37
742 752 11
Other
26
8
0
0
0 0
Uncounted
29 10
0
32 11 0
Switch
19 -19
0
54 -54 0
True
713
632 37
828 709 11
Actual
50.16%
49.84%
49.66% 50.34%
True
52.99%
47.01%
53.88%
46.12%
Exit Poll
50.67% 49.33%
Swing
Red-shift Diff
Actual
0.49%
1.01% 0.52%
True
3.33%
4.22% 0.89%
Difference
2.84%
3.21%
______________________________________________________________________________
NEW
MEXICO Gore
Bush
Other
Kerry Bush Other
Actual
287 286
22
371 377 8
Other
16
5
0
0
0 0
Uncounted
13
4
0
16
5 0
Switch
9
-9
0
27 -27 0
True
324 287
22
414 355 8
Actual
50.03%
49.97%
49.60% 50.40%
True
53.07%
46.93%
53.81% 46.19%
Exit
Poll
51.34% 48.66%
Swing
Red-shift Diff
Actual
0.43%
1.74% 1.31%
True
3.47%
4.21%
0.74%
Difference
3.04%
2.47%
______________________________________________________________________________
WPE-unadjusted Exit Polls
Swing R/S
Diff
National 1.51% 3.58% 3.07%
OH -0.76
5.48 6.24
FL 3.49
3.83
0.34
NY 3.81
5.79 1.98
PA 0.88
4.43 3.55
IA 0.49
1.51 1.02
NM 0.43
3.94 3.51
Assumptions:
2000 2004
Uncounted
4.86%
2.74%
To Dem
75%
75%
Switched
0%
7.6%
Nader share allocated to
Gore
71%
Bush
21%
Other
8%
NATIONAL
Gore
Bush Other
Kerry Bush Other
Actual
51004
50459
3275
59028 62040 1228
Other
2285 676
0
0
0
0
Unctd
4009 1336
0
2581 860
0
Switch
0 0
0
4492 -4492
0
TrueVote
57298
52471
0
66101 58408 0
Margin
4827
7693
Actual
50.27%
49.73%
48.76% 51.24%
TruePct
52.20%
47.80%
53.09%
46.91%
Exit
Poll
- &nbbsp;
- &nbbsp;
51.93% 48.07%
State EP
-
-
52.34%
47.66%
Swing
Red-shift
Actual
1.51%
3.58%
TrueVote
3.44%
4.33%
NEP
3.17%
______________________________________________________________________________
OHIO
Gore Bush
Other
Kerry Bush
Actual
2186
2351
144
2740 2859
Other
102 30
0
0
0
Unctd
179 60
0
119
40
Switch
0 0
0
209
-209 ;
TrueVote
2468
2441
0
3067
2690
Margin
27
377
Actual
48.18%
51.82%
48.94% 51.06%
TruePct
50.27%
49.73%
53.28%
46.72%
Exit
Poll
54.42%
45.58%
Swing
Red-shift
Actual
-0.76% &nbssp;
5.48%
TrueVote
1.33%
4.34%
______________________________________________________________________________
FLORIDA
Gore
Bush
Nader
Kerry Bush Other
Actual
2912 2912
115
3584 3965
56
Other
82 24
9
0
0
0
Unctd
228
76
0
161 54
0
Switch
29 -29
0
247 -247
0
TrueVote
3250
2983
9
3991 3771
56
Margin
267
221
Actual
49.03%
49.03% 1.94%
47.48% 52.52%
TruePct
52.07%
47.78% 0.15%
51.42%
48.58%
Exit
Poll
51.31%
48.69%
Swing
Red-shift
Actual
3.49%
3.83%
TrueVote
3.95%
4.74%
______________________________________________________________________________
NEW YORK
Gore
Bush
Other
Kerry Bush Other
Actual
4112 2405
278
4314 2963
112
Other
197 58
0
0
0
0
Unctd
260 87
0
156 20
0
Switch
0
0
0
328 -328
0
TrueVote
4570
2550
278
4799 2655 112
Margin
2020
2144
Actual
63.10% 36.90%
59.29% 40.71%
TruePct
64.18% 35.82%
64.38% 35.62%
Exit
Poll
65.08%
34.92%
Swing
Red-shift
Actual
3.81%
5.79%
TrueVote
5.09%
4.89%
______________________________________________________________________________
PENN
Gore Bush
Other
Kerry Bush Other
Actual
2485
2281
120
2938 2794 34
Other
85 25
0
0
0 0
Unctd
187 62
0
122 41 0
Switch
0
0
0
224 -224 0
TrueVote
2757
2369
120
3284 2611 34
Margin
389
673
Actual
52.14%
47.86%
51.26%
48.74%
TruePct
53.79%
46.21%
55.71%
44.29%
Exit
Poll
- &nbbsp;
55.69%
44.31%
Swing
Red-shift
Actual
0.88%
4.43%
TrueVote
2.53%
4.45%
______________________________________________________________________________
IOWA
Gore Bush
Other
Kerry Bush Other
Actual
638
634 37
742 752 11
Other
26
8
0
0
0 0
Unctd
50 17
0
32 11 0
Switch
0 0
0
56 -56 0
TrueVote
714
658
37
830 706 11
Margin
56
124
Actual
50.16%
49.84%
49.66%
50.34%
TruePct
52.04%
47.96%
54.04% 45.96%
Exit
Poll
- &nbbsp;
51.18%
48.82%
Swing
Red-shift
Actual
0.49%
1.51%
TrueVote
2.37%
4.37%
______________________________________________________________________________
NEW
MEXICO Gore
Bush
Other
Kerry Bush Other
Actual
287
286
22
371 377 8
Other
16 5
0
0
0 0
Unctd
23
8
0
16
5 0
Switch
0 0
0
28 -28 0
TrueVote
325
299
22
415 354 8
Margin
27
61
Actual
50.03% 49.97%
49.60% 50.40%
TruePct
52.13% 47.87%
53.97% 46.03%
Exit
Poll
- &nbbsp;
53.54% 46.46%
Swing
Red-shift
Actual
0.43%
3.94%
TrueVote
2.53%
4.37%
______________________________________________________________________________
Swing vs. Red Shift – All
States
Red-shift based on Unadjusted Exit Poll (WPE
method)
(2-party vote shares)
Bush improved his two-party share (swing)
from 2000 to 2004 in 31 states.
Red-shift exceeded swing in 21 of the 31
states.
Red-shift exceeded swing in a total 39
states.
Actual True
Vote
Actual True
Vote Exit Poll
(WPE)
Gore Bush
Gore Bush
Kerry Bush Kerry
Bush Kerry
Bush Red-shift Swing
State
50.27 49.73 52.20
47.80 49.04 50.96
53.09 46.91 52.34
47.66 3.30 1.23
AL
42.4 57.6
44.4 55.6
37.4 62.6
40.9 59.1
42.8 57.2
5.4 5.0
AK
32.1 67.9
38.9 61.1
38.1 61.9
40.6 59.4
41.7 58.3
3.7 -5.9
AR 46.7
53.3 49.1
50.9 45.4
54.6 49.2
50.8 45.3
54.7 -0.1 1.3
AZ
47.2 52.8
49.2 50.8
45.0 55.0
48.9 51.1
47.0 53.0
2.1 2.2
CA
56.2 43.8
57.9 42.1
55.3 44.7
59.7 40.3
60.6 39.4
5.3 0.9
CO
45.5 54.5
48.6 51.4
48.0 52.0
51.9 48.1
50.7 49.3
2.8 -2.4
CT
59.3 40.7
60.8 39.2
55.7 44.3
59.9 40.1
63.3 36.7
7.6 3.6
DE
56.8 43.2
58.2 41.8
54.0 46.0
58.4 41.6
61.9 38.1
7.8 2.7
DC
90.5 9.5
89.1 10.9
90.4 9.6
96.8 3.2
92.2 7.8
1.9 0.1
FL
50.0 50.0
51.7 48.3
47.7 52.3
51.7 48.3
51.3 48.7
3.6 2.3
GA
44.0 56.0
45.7 54.3
41.8 58.2
45.6 54.4
42.8 57.2
0.9 2.2
HI
59.9 40.1
61.6 38.4
54.6 45.4
59.0 41.0
56.8 43.2
2.2 5.4
ID
29.1 70.9
32.0 68.0
31.3 68.7
34.2 65.8
31.2 68.8
-0.1 -2.2
IL
56.2 43.8
57.6 42.4
55.4 44.6 59.8
40.2 57.4
42.6
2.1 0.8
IN
42.0 58.0
43.8 56.2
39.9 60.1
43.5 56.5
40.3 59.7
0.5 2.1
IA
50.2 49.8
52.0 48.0
49.9 50.1
54.0 46.0
51.2 48.8
1.3 0.3
KS
39.1 60.9
42.2 57.8
37.7 62.3
40.9 59.1
38.0 62.0
0.3 1.4
KY
42.3 57.7
44.4 55.6
40.3 59.7
43.9 56.1
39.9 60.1
-0.3 ; 2.0
LA
46.1 53.9
48.0 52.0
43.0 57.0
46.7 53.3
44.6 55.4
1.6 3.1
ME
52.7 47.3
55.2 44.8
55.0 45.0
59.2 40.8
56.5 43.5
1.5 -2.3
MD
58.5 41.5
59.7 40.3
56.8 43.2
61.3 38.7
60.7 39.3
3.9 1.7
MA
64.8 35.2
66.0 34.0
62.9 37.1
67.7 32.3
65.7 34.3
2.8 1.9
MI
52.6 47.4
54.1 45.9
52.0 48.0
56.2 43.8
54.9 45.1 2.9
0.7
MN
51.3 48.7
53.9 46.1
52.0 48.0
56.2 43.8
56.5 43.5
4.4 -0.7
MS
41.4 58.6
43.3 56.7
40.7 59.3
44.4 55.6
46.2 53.8
5.4 0.6
MO
48.3 51.7
50.1 49.9
46.6 53.4
50.6 49.4
49.3 50.7
2.7 1.7
MT
36.3 63.7
40.9 59.1 40.4
59.6 43.4
56.6 38.6
61.4 -1.8 -4.0
NE
34.8 65.2
38.3 61.7
33.7 66.3
36.8 63.2
37.3 62.7
3.5 1.1
NV
48.1 51.9
50.3 49.7
49.0 51.0
53.0 47.0
53.8 46.2
4.8 -0.9
NH
49.4 50.6
51.7 48.3
50.9 49.1
55.1 44.9
57.6 42.4
6.7 -1.5
NJ
58.2 41.8
59.6 40.4
53.6 46.4
57.9 42.1
58.3 41.7
4.7 4.6
NM
50.0 50.0
52.1 47.9
49.9 50.1
54.0 46.0
53.5 46.5
3.6 0.1
NY
63.1 36.9
64.2 35.8
59.6 40.4
64.1 35.9
65.1 34.9
5.5 3.5
NC
43.5 56.5
45.1 54.9
43.9 56.1
47.9 52.1
49.4 50.6
5.5 -0.4
ND
35.3 64.7
39.4 60.6 36.8
63.2 39.8
60.2 33.4
66.6 -3.3 -1.4
OH
48.2 51.8
50.3 49.7
49.1 50.9
53.3 46.7
54.4 45.6
5.3 -0.9
OK
38.9 61.1
40.9 59.1
34.4 65.6
38.1 61.9
33.5 66.5
-1.0 ; 4.5
OR
50.2 49.8
51.7 48.3
52.4 47.6
56.6 43.4
52.1 47.9
-0.2 -2.1
PA
52.1 47.9
53.8 46.2
51.4 48.6
55.7 44.3
55.7 44.3
4.3 0.7
RI
65.7 34.3
66.8 33.2
60.8 39.2
65.5 34.5
63.0 37.0
2.1 4.8
SC
41.9 58.1
44.0 56.0
41.7 58.3
45.4 54.6
46.4 53.6
4.7 0.1
SD
38.3 61.7
40.4 59.6
39.7 60.3
43.0 57.0
37.0 63.0
-2.8 -1.4
TN
48.0 52.0
49.6 50.4
43.0 57.0
46.9 53.1
43.1 56.9
0.0 5.0
TX
39.0 61.0
41.6 58.4
38.8 61.2
42.3 57.7
40.9 59.1
2.2 0.3
UT
28.3 71.7
33.1 66.9
27.8 72.2
30.0 70.0
29.9 70.1
2.1 0.4
VT
55.6 44.4
58.0 42.0
60.6 39.4
65.2 34.8
68.0 32.0
7.4 -5.0
VA
45.9 54.1
47.9 52.1
46.1 53.9
50.1 49.9
49.8 50.2
3.8 -0.2
WA
53.0 47.0
55.0 45.0
54.0 46.0
58.2 41.8
57.9 42.1 3.9 -1.0
WV
46.8 53.2
48.7 51.3
43.8 56.2
47.6 52.4
40.6 59.4
-3.2 ; 3.0
WI
50.1 49.9
52.3 47.7 50.4
49.6 54.6
45.4 52.6
47.4 2.1 -0.3
WY
29.0 71.0
31.8 68.2
30.6 69.4
33.1 66.9
31.9 68.1
1.3 -1.6
Swing vs. Red-shift based on
12:22am Exit Poll (Composite)
(2-party vote shares)
Recorded True
Vote
Recorded True
Vote Exit
Poll
Gore Bush
Gore Bush
Kerry Bush Kerry
Bush Kerry
Bush Red-shift Swing
State
50.27 49.73 52.20
47.80 49.04 50.96
53.09 46.91 50.51
49.49 1.47 1.23
AL
42.4 57.6
44.4 55.6
37.4 62.6 40.9
59.1 41.1
58.9
3.7 5.0
AK
32.1 67.9
38.9 61.1
38.1 61.9
40.6 59.4
40.1 59.9
2.1 -5.9
AR
46.7 53.3
49.1 50.9
45.4 54.6
49.2 50.8
46.6 53.4
1.2 1.3
AZ
47.2 52.8
49.2 50.8
45.0 55.0
48.9 51.1
46.9 53.1
2.0 2.2
CA
56.2 43.8
57.9 42.1
55.3 44.7
59.7 40.3
55.7 44.3
0.4 0.9
CO
45.5 54.5
48.6 51.4
48.0 52.0
51.9 48.1
49.1 50.9
1.1 -2.4
CT
59.3 40.7
60.8 39.2
55.7 44.3
59.9 40.1
58.5 41.5
2.8 3.6
DE
56.8 43.2
58.2 41.8
54.0 46.0
58.4 41.6
58.4 41.6
4.4 2.7
DC
90.5 9.5
89.1 10.9
90.4 9.6
96.8 3.2
91.6 8.4
1.3 0.1
FL
50.0 50.0
51.7 48.3
47.7 52.3
51.7 48.3
49.9 50.1
2.2 2.3
GA
44.0 56.0
45.7 54.3
41.8 58.2
45.6 54.4
43.1 56.9
1.3 2.2
HI
59.9 40.1
61.6 38.4
54.6 45.4
59.0 41.0
53.3 46.7
-1.2 ; 5.4
ID
29.1 70.9
32.0 68.0
31.3 68.7
34.2 65.8 33.3
66.7 2.0 -2.2
IL
56.2 43.8
57.6 42.4
55.4 44.6
59.8 40.2
57.1 42.9
1.8 0.8
IN
42.0 58.0 43.8
56.2 39.9
60.1 43.5
56.5 41.0
59.0 1.1
2.1
IA
50.2 49.8
52.0 48.0
49.9 50.1 54.0
46.0 50.7
49.3
0.8 0.3
KS
39.1 60.9
42.2 57.8
37.7 62.3
40.9 59.1
34.6 65.4
-3.1 ; 1.4
KY
42.3 57.7
44.4 55.6
40.3 59.7
43.9 56.1
40.8 59.2
0.5 2.0
LA
46.1 53.9
48.0 52.0
43.0 57.0
46.7 53.3
44.5 55.5
1.5 3.1
ME
52.7 47.3
55.2 44.8
55.0 45.0
59.2 40.8
54.8 45.2
-0.2 -2.3
MD
58.5 41.5
59.7 40.3
56.8 43.2
61.3 38.7
57.0 43.0
0.3 1.7
MA
64.8 35.2
66.0 34.0
62.9 37.1
67.7 32.3
66.5 33.5
3.6 1.9
MI
52.6 47.4
54.1 45.9
52.0 48.0
56.2 43.8
52.6 47.4
0.6 0.7
MN
51.3 48.7
53.9 46.1
52.0 48.0 56.2
43.8 54.6
45.4 2.6 -0.7
MS
41.4 58.6
43.3 56.7
40.7 59.3
44.4 55.6
43.2 56.8
2.5 0.6
MO
48.3 51.7
50.1 49.9
46.6 53.4
50.6 49.4
47.5 52.5
0.9 1.7
MT
36.3 63.7
40.9 59.1
40.4 59.6
43.4 56.6
39.3 60.7
-1.1 -4.0
NE
34.8 65.2
38.3 61.7
33.7 66.3
36.8 63.2
36.5 63.5
2.8 1.1
NV
48.1 51.9
50.3 49.7
49.0 51.0
53.0 47.0
50.7 49.3
1.6 -0.9
NH
49.4 50.6
51.7 48.3
50.9 49.1
55.1 44.9
55.5 44.5
4.6 -1.5
NJ
58.2 41.8
59.6 40.4
53.6 46.4
57.9 42.1
56.1 43.9
2.6 4.6
NM
50.0 50.0
52.1 47.9
49.9 50.1
54.0 46.0
51.3 48.7
1.4 0.1
NY
63.1 36.9
64.2 35.8
59.6 40.4
64.1 35.9
64.0 36.0 4.4
3.5
NC
43.5 56.5
45.1 54.9
43.9 56.1
47.9 52.1
47.3 52.7
3.4 -0.4
ND
35.3 64.7
39.4 60.6
36.8 63.2
39.8 60.2
33.6 66.4
-3.2 -1.4
OH
48.2 51.8
50.3 49.7
49.1 50.9
53.3 46.7
52.1 47.9
3.0 -0.9
OK
38.9 61.1
40.9 59.1 34.4
65.6 38.1
61.9 34.7
65.3
0.3 4.5
OR
50.2 49.8
51.7 48.3
52.4 47.6
56.6 43.4
51.2 48.8
-1.1 -2.1
PA
52.1 47.9
53.8 46.2
51.4 48.6
55.7 44.3
54.4 45.6
3.0 0.7
RI
65.7 34.3
66.8 33.2
60.8 39.2
65.5 34.5
64.2 35.8
3.4 4.8
SC
41.9 58.1
44.0 56.0
41.7 58.3
45.4 54.6
45.8 54.2
4.1 0.1
SD
38.3 61.7
40.4 59.6
39.7 60.3
43.0 57.0
37.4 62.6
-2.3 -1.4
TN
48.0 52.0
49.6 50.4
43.0 57.0
46.9 53.1
41.2 58.8
-1.9 ; 5.0
TX
39.0 61.0
41.6 58.4
38.8 61.2
42.3 57.7
36.8 63.2
-1.9 ; 0.3
UT
28.3 71.7
33.1 66.9
27.8 72.2
30.0 70.0
29.9 70.1
2.1 0.4
VT
55.6 44.4
58.0 42.0
60.6 39.4
65.2 34.8
65.7 34.3
5.1 -5.0
VA
45.9 54.1
47.9 52.1
46.1 53.9
50.1 49.9
48.0 52.0
1.9 -0.2
WA
53.0 47.0
55.0 45.0
54.0 46.0
58.2 41.8
55.1 44.9 1.1 -1.0
WV
46.8 53.2
48.7 51.3
43.8 56.2
47.6 52.4
45.2 54.8
1.4 3.0
WI
50.1 49.9
52.3 47.7
50.4 49.6
54.6 45.4
50.2 49.8
-0.2 -0.3
WY
29.0 71.0
31.8 68.2
30.6 69.4
33.1 66.9
32.1 67.9
1.5 -1.6
Correlation Analysis (state vote shares)
Gore vs. Bush 2000: 0.928
Gore vs. Kerry 2004: 0.996
Bush vs. Bush 2004: 0.995
Kerry Exit vs. Kerry Actual: 0.985
Sensitivity Analysis
Effects of uncounted votes and switched-vote
rate on Gore and Kerry vote shares
Gore
Kerry
Actual
50.27
48.76
Adjusted
53.15 53.09 (adj
NEP)
State Exit
- &nnbsp;
50.51
NEP
-
51.92
Adjusted Gore 2-party
vote
Unctd
Switched-vote
rate
Rate
0.0% 1.0%
2.0% 3.0%
65%
51.59 52.07 52.54
53.02
70%
51.66 52.14 52.61
53.08
75%
51.73 52.21 52.68
53.15
80%
51.80 52.27 52.75
53.22
Adjusted Kerry 2-party
vote
Unctd
Switched-vote
rate
Rate
4.0% 5.0%
6.0% 7.6%
65%
51.24 51.72 52.19
52.96
70%
51.31 51.79 52.26
53.02
75%
51.38 51.85 52.33
53.09
80%
51.44 51.92 52.39
53.15
___________________________________________________________________________________________________
Exit
Poll Response Optimization
Edison-Mitofsky summarized the exit poll data for 1250 precincts separated into five partisanship groupings, from strong Bush to strong Kerry. The optimization model used the Excel “Solver” algorithm and determined that Kerry won the 2-party vote by 52.15-47.85%. This “feasible” solution used the final recorded 2-party vote and the following partisanship constraints:1) within precinct error (WPE) and 2) response rates.
The optimal resulting vote share exactly matched the 12:22am National Exit Poll “Voted 2000” demographic.
Kerry Exit Poll vs. Actual Vote by Precinct category
Effect of Incremental Aggregate Alpha on Precinct Category Alpha
Alpha (Kerry/Bush response) by Precinct Category
Exit Poll Response by Precinct Category
Sensitivity of Kerry Vote Pct and WPE to Aggregate Alpha (K/B)
Bush Percentage of Refusers by Precinct Category Required for Recorded Vote
1250 Precincts by
Partisanship
Given:
1- Recorded 2-party vote (Bush 51.24- Kerry 48.76%)
2- Partisanship precinct exit poll response
3- Partisanship "Within Precinct Error" (WPE)
Calculate:
Kerry’s true vote - aggregate and by partisanship category
Kerry 52.15-Bush 47.85%
Assume Census 125.74m total votes cast
2-party
Vote% Vote
Kerry 48.76%
60.70
Bush 51.24%
63.78
Total 100%
124.48
Optimizer results:
(2-party)
Kerry
Bush
Vote
64.91
59.57m
2-party
52.15%
47.85%
Deviation
-3.39%
3.39%
Vote Deviation -5.89
2.47
Dev /2-pty
-6.50%
7.09%
Vote share
51.62%
47.37%
PROBABILITY of the 3.39% discrepancy
between exit poll and vote:
1 in 67
billion
PARTISAN
ALPHA
Kerry strongholds:
1.052
Other precincts:
1.203
WEIGHTED AVERAGE
(AGGREGATE)
Response:
53.59%
K/B (alpha):
1.165
SHARE OF EXIT POLL
REFUSERS
Kerry
44.87%
Bush
55.13%
PARTISANSHIP CONSTRAINTS (1250
PRECINCTS)
Number Strong
Bush
Strong
Kerry
Precincts 40
415 540
165 90
KERRY
SHARE
Min
0% 20%
40% 60%
80%
Max
20% 40%
60% 80%
100%
RESPONSE
Min
56% 55%
52% 55%
53%
Max
56% 55%
52% 55%
53%
ALPHA
(K/B)
Min
0.50 0.50
0.50 0.50
0.50
Max
2.00 2.00
2.00 2.00
2.00
WPE
Min
-10.0% -6.1% &nbssp; -8.5%
-5.9% 0.3% ;
Max
-10.0% -6.1% &nbssp; -8.5%
-5.9% 0.3% ;
Actual
E-M
-10.0% -6.1% &nbssp; -8.5%
-5.9% 0.3% ;
OPTIMIZER OUTPUT
SUMMARY
Poll Count
Diff Poll
Count Diff (mm)
Kerry
52.15% 48.76% -3.39%
64.91 60.70 -4.22
Bush 47.85%
51.24% 3.39% 59.57
63.79 4.22
Diff
4.29% -2.48% -6.77% 5.346
-3.09 -8.43
Pship
HighB Bush
Even Kerry HighK
Total
Prcts
40 415
540 165
90 1250
Votes
3.98 41.33 53.78
16.43 8.96 124.48
Pct
3.2% 33.2% 43.2%
13.2% 7.2% 100.0%
RESP.
56.0% 55.0% 52.0%
55.0% 53.0% 53.59%
DevAvg
2.4% 1.4%
-1.6% 1.4% ; -0.6%
0.0%
ALPHA
K/B
1.50 1.17
1.19 1.08
0.10 1.17
K/ 50B
75.1 58.7 59.3
54.1 49.8 58.2
DevAvg
29.0% 0.8%
1.8% -7.1% -14.4% 0.0%
VOTE
Kerry
0.79 14.51 24.58
11.87 8.95 60.70
Pct
19.9% 35.1% 45.7%
72.2% 99.8% 48.76%
Bush
3.19 26.82 29.20
4.56 0.02 63.79
Pct
80.1% 64.9% 54.3%
27.8% 0.2% 51.24%
RESPONDERS
Kerry
0.99 15.77 26.86
12.35 8.93 64.91
Pct
24.9% 38.2% 50.0%
75.2% 99.7% 52.15%
Bush
2.99 25.55 26.91
4.08 0.03 59.57
Pct
75.1% 61.8% 50.0%
24.8% 0.3% 47.85%
REFUSERS
Kerry
13.5% 31.4% 41.1%
68.6% 100.0% 44.87%
Bush 86.5%
68.6% 58.9% 31.4%
0.0% 55.13%
VOTE
DEVIATION
Kerry
-0.20 -1.26 p; -2.29
-0.48 0.01 ; -4.22
Pct
-20.1% -8.0% &nbssp; -8.5%
-3.9% 0.2% ; -6.50%
WPE
Calc
-10.0% -6.1% &nbssp; -8.5%
-5.9% 0.3% ; -6.77%
E-M
-10.0% -6.1% &nbssp; -8.5%
-5.9% 0.3% ; -6.77%
Sensitivity Analysis:
Probability
of Kerry vote discrepancy as a function of Kerry/Bush response (alpha)
K/B
Kerry WPE Prob: 1
in
1.00
48.77% 0.01%
2
1.02
49.19% -0.85%
5
1.04
49.62% -1.70%
21
1.06
50.04% -2.55%
160
1.08
50.47% -3.40%
2,334
1.10
50.90% -4.25% 65,300
1.12
51.32% -5.11%
3,555,747
1.14
51.78% -6.02%
559,644,344
1.15
51.99% -6.45%
7,521,468,533
1.155
52.15% -6.77%
62,893,081,761
1.16
52.21% -6.87% 119,593,696,538
1.17
52.42% -7.29% 2,250,674,476,447
_____________________________________________________________________
NEP Location Size
Note: location vote shares exactly matched the 1250 precinct partisanship optimizer!
Given:
1- Recorded vote: Bush 50.73- Kerry 48.27%
(2 party: Bush 51.24%- Kerry 48.76%)
2- Location exit poll response
3- Location "Within Precinct Error" (WPE)
Calculate:
True 2-party Vote share (aggregate and by location)
Kerry 52.15-Bush 47.85%
Assume Census 125.74m total votes cast
WPE
WPE Number of
Size
Weight Votes Mean Median
Precincts Completion rate
Big City 13%
16.35 -7.9
-5.9 105 &nnbsp; 0.52
Small City 18%
22.63 -8.5
-7.7 236 &nnbsp; 0.54
Suburbs
45% 56.58 -8.1
-7.9 487 &nnbsp; 0.53
Small Town 8%
10.06 -4.9
-5 1126
0.57
Rural
16% 20.12 -3.6
-3.6 296 &nnbsp; 0.55
Total
125.74 -7.17 -6.68
1250 0.54
EXIT POLL (2-party)
Kerry Bush
Vote
64.91
59.58
Vote
share 52.15%
47.85%
%
Deviation -3.39%
3.39%
Vote Dev
-5.88
2.47
Dev/2-pty
-6.50%
7.08%
True
Vote 51.62%
47.37%
%Deviation
9.06%
-4.15% &nbssp;
WEIGHTED AVERAGE (AGGREGATE) RESPONSE:
53.98%
PERCENT OF EXIT POLL
REFUSERS REQUIRED TO MATCH RECORDED
VOTE
Kerry
44.83%
Bush
55.17%
Rural Town Suburb
City Big City
Prcts
296 126
487 236
105
23.7% 10.1% 39.0%
18.9% 8.4%
Votes
20.12 10.06 56.58
22.63 16.35
16% 8%
45% 18%
13%
Kerry NEP share
12:22am
43% 52%
50% 53%
64%
Final
40% 48%
47% 49%
61%
TRUE
40% 50%
49% 59%
73%
RANGE
CONSTRAINTS
KERRY
WIN%
Min
35% 45%
45% 45%
60%
Max
55% 55%
55% 60%
100%
RESPONSE
Min
55% 57%
53% 54%
52%
Max
55% 57%
53% 54%
52%
ALPHA
(K/B)
Min
0.50 0.50
0.50 0.50
0.50
Max
3.00 3.00
3.00 3.00
3.00
WPE
Min
-3.6% -4.9% p; -8.1%
-8.5% -7.9% p;
Max
-3.6% -4.9% p; -8.1%
-8.5% -7.9% p;
E-M
-3.6% -4.9% p; -8.1%
-8.5% -7.9% p;
OPTIMIZER OUTPUT
SUMMARY
......
Poll Count Diff
Poll Count Diff (mm)
Kerry
52.15% 48.76% -3.39%
64.91 60.70 -4.21
Bush
47.85% 51.24% 3.39%
59.57 63.78 4.21
Diff
4.29% -2.48% -6.77%
5.34 -3.09 -8.43
.....
Rural Town Suburb
City Big City Total
Prcts 296
126 487
236 105 1250
2-pty
29.48 12.55 48.50
23.50 10.46 124.48
Pct
23.7% 10.1% 39.0%
18.9% 8.4% 100.0%
RESP.
55.0% 57.0% 53.0%
54.0% 52.0% 53.98%
DevAvg
1.0% 3.0%
-1.0% 0.0% ; -2.0%
0.0%
ALPHA
K/B
0.792 0.800 0.840
0.835 0.800 0.82
K/ 50B
39.6 40.0
42.0 41.8
40.0 41.0
DevAvg
-3.5% -2.4% p; 2.4%
1.8% -2.5% 0.0%
VOTE
Kerry
12.69 6.10 21.82
11.75 8.34 60.69
Pct
43.0% 48.6% 45.0%
50.0% 79.7% 48.76%
Bush
16.79 6.45 26.67
11.75 2.12 63.78
Pct
57.0% 51.4% 55.0%
50.0% 20.3% 51.24%
RESPONDERS
Kerry
13.22 6.41 23.79
12.75 8.75 64.91
Pct
44.8% 51.1% 49.1%
54.3% 83.7% 52.15%
Bush
16.26 6.14 24.71
10.75 1.71 59.57
Pct
55.2% 48.9% 51.0%
45.8% 16.3% 47.85%
REFUSERS
Kerry
40.8% 45.4% 40.4%
45.0% 75.4% 44.83%
Bush
59.2% 54.6% 59.6%
55.0% 24.6% 55.17%
VOTE
DEVIATION
Kerry -0.53
-0.31 -1.96 p; -1.00
-0.41 -4.21
Pct
-4.0% -4.8% p; -8.3%
-7.8% -4.7% p; -6.49%
WPE
Calc
-3.6% -4.9% p; -8.1% -8.5%
-7.9% -6.77%
E-M
-3.6% -4.9% p; -8.1%
-8.5% -7.9% p; -6.77%
Diff
0.00% 0.00% 0.00%
0.00% 0.00% 0.00%
_____________________________________________________________________
State Response Optimizer
The State Exit Poll Response Optimizer categorized the states into five (High Bush to High Kerry) groupings and used state exit poll response rates provided by Edison-Mitofsky. State vote discrepancies were analogous to WPE. Kerry was the winner: 51.8-47.2%. The model confirmed the Precinct Response Optimizer: non-response rates were higher in strong Kerry states, again contradicting the non-response (rBr) hypothesis.
A Regression
analysis of Kerry state poll share and recorded vote vs. the state exit poll
completion rate confirmed the optimizer results.
Given: Recorded vote
2-Party Total
Kerry 48.76%
48.27%
Bush
51.24% 50.72%
2- State exit poll average response
rate
3- State exit poll average
WPE
Calculate: TRUE VOTE
2-Party
Total
Kerry 52.30%
51.77%
Bush 47.70%
47.21%
WPE -6.77%
-7.08%
PROBABILITY of 3.54% discrepancy between
True Vote and recorded vote:
1 in 3.5
trillion
WEIGHTED AVERAGE (AGGREGATE)
Response
53.32%
REFUSER VOTE SHARE REQUIRED TO MATCH
RECORDED VOTE
Kerry
44.86%
Bush
55.14%
CALCULATED TRUE
VOTE
Deviation
from Recorded
State
Votes Weight
RESP. Kerry
Pct Bush
Pct Votes
Pct WPE
Total
121,056
100%
53.32% 63,314 52.30% 57,741
47.70% -4287 -6.77% -7.08%
HIGH
BUSH
UT
905
0.75%
59.6% 270
29.9% 635
70.1% -29 -10.7%
-6.4%
WY
238
0.20% 66.0%
76 31.8%
163 68.2%
-5 --6.8% -4.3%
ID
590
0.49%
63.2% 184
31.2% 406
68.8% -3
-1.6% -1.0%
NE
767
0.63%
66.5% 285
37.2% 482
62.8% -31 -10.9%
-8.1%
OK
1,464
1.21%
53.2% 490
33.5% 974 66.5%
14 2.8% 1.9%
BUSH
ND
308
0.25%
63.0% 103
33.5% 205
66.5% 8
7.8% 5.2%
AK
302
0.25%
53.2% 126
41.6% 176
58.4% -14 -11.5%
-9.6%
AL
1,870
1.55%
58.3% 800
42.8% 1,071 57.2%
-106 -13.2% p; -11.3%
KS
1,171
0.97%
64.5% 445
38.0% 726 62.0%
-10 -2.2%& -1.7%
TX
7,360
6.08%
58.3% 3,009 40.9%
4,350 59.1% -177
-5.9% -4.8%
SD
382
0.32%
42.7% 141
37.0% 241
63.0% 8
5.7% 4.2%
MT
440
0.36%
63.0% 170
38.6% 270
61.4% 4
2.3% 1.8%
IN
2,448
2.02%
38.6% 987
40.3% 1,461 59.7%
-18 -1.9%& -1.5%
KY
1,782
1.47%
52.6% 712
39.9% 1,070 60.1%
1 0.1% 0.1%
MS
1,130
0.93%
49.6% 522
46.1% 609 53.9%
-64 -12.2%% -11.3%
SC
1,600
1.32%
59.4% 742
46.4% 858 53.6%
-80 -10.8%% -10.0%
GA
3,280
2.71%
63.9% 1,402 42.7%
1,878 57.3%
-36 -2.6%& -2.2%
LA
1,922
1.59%
47.8% 857
44.6% 1,066 55.4%
-37 -4.3%& -3.8%
TN
2,421
2.00%
66.7% 1,043 43.1%
1,378 56.9%
-6 --0.6% -0.5%
WV
750
0.62%
48.7% 305
40.6% 446
59.4% 22 7.1%
5.8%
NC
3,487
2.88%
52.6% 1,723 49.4%
1,764 50.6% -197
-11.4% -11.3%
AZ
1,998
1.65%
57.3% 939
47.0% 1,058 53.0%
-46 -4.9%& -4.6%
AR
1,043
0.86%
60.2% 473
45.3% 571 54.7%
-3 --0.6% -0.5%
VA
3,172
2.62%
56.4% 1,580 49.8%
1,592 50.2% -125
-7.9% -7.9%
MO
2,715
2.24%
47.0% 1,338 49.3%
1,377 50.7%
-79 -5.9%& -5.8%
EVEN
FL
7,548
6.24%
49.0% 3,870 51.3%
3,678 48.7% -287
-7.4% -7.6%
CO
2,103
1.74%
55.5% 1,066 50.7%
1,037 49.3%
-64 -6.0%& -6.1%
NV
816
0.67%
49.1% 438
53.7% 377
46.3% -41
-9.4% -10.1%
OH
5,599
4.62%
45.0% 3,045 54.4%
2,554 45.6% -305
-10.0% -10.9%
NM
748
0.62%
56.9% 400 53.5%
348 46.5%
-29 -7.3%& -7.8%
IA
1,494
1.23%
52.6% 764
51.2% 730 48.8%
-22 -2.9%& -3.0%
WI
2,968
2.45%
55.3% 1,559 52.5%
1,408 47.5% -70
-4.5% -4.7%
NH
672
0.55%
44.0% 386
57.5% 286
42.5% -46 -11.8%
-13.6%
PA
5,732
4.73%
46.8% 3,190 55.7%
2,542 44.3% -252
-7.9% -8.8%
MI
4,793
3.96%
50.2% 2,630 54.9%
2,163 45.1% -151
-5.7% -6.3%
MN
2,792
2.31%
45.3% 1,575 56.4%
1,217 43.6% -130
-8.2% -9.3%
OR
1,810
1.50%
53.0% 943
52.1% 867 47.9%
0 0.0% 0.0%
KERRY
NJ
3,581
2.96%
59.7% 2,085 58.2%
1,496 41.8% -174
-8.3% -9.7%
WA
2,815 2.33%
53.8% 1,628 57.8%
1,187 42.2% -118
-7.3% -8.4%
DE
372
0.31%
57.5% 230
61.8% 142
38.2% -30 -12.9%
-15.9%
HI
426
0.35%
53.4% 242
56.8% 184
43.2% -10
-4.1% -4.7%
ME
727
0.60%
61.3% 411
56.5% 316
43.5% -14
-3.4% -3.8%
CA
12,255 10.12%
50.5% 7,413 60.5%
4,842 39.5% -668
-9.0% -10.9%
IL
5,239
4.33%
51.9% 3,007 57.4%
2,231 42.6% -115
-3.8% -4.4%
CT
1,551
1.28%
51.0% 979
63.1% 572
36.9% -122 -12.4% -15.7%
MD
2,359
1.95%
59.4% 1,430 60.6%
929 39.4%
-96 -6.7%& -8.1%
HIGH
KERRY
NY
7,277
6.01%
57.9% 4,729 65.0%
2,548 35.0% -415
-8.8% -11.4%
VT
305
0.25%
53.1% 207
67.8% 98 32.2%
-23 -11.1%% -15.0%
RI
429
0.35%
44.2% 270
62.9% 159
37.1% -10
-3.7% -4.7%
MA
2,875
2.37%
56.5% 1,887 65.6%
988 34.4%
-83 -4.4%& -5.8%
DC
224 0.19%
53.5% 207
92.2% 17
7.8% -4
-1.8% -3.4%
CALCULATED TRUE VOTE
Deviation from
Recorded
State
Votes Weight
RESP. Kerry
Pct Bush
Pct Votes
Pct WPE
Total
121,056
100%
53.32% 63,314 52.30% 57,741
47.70% -4287 -6.77% -7.08%
HBUSH
3,965
3.3%
61.7% 1,306 32.7%
2,659 67.3%
-54 -5.4%& -3.58%
BUSH
39,582
32.7%
55.2% 17,415 42.8%
22,167 57.2% -955
-3.6% -3.49%
EVEN
37,073
30.6%
50.2% 19,868 53.7%
17,205 46.3% -1,397 -6.8%
-7.35%
KERRY
29,326
24.2%
55.4% 17,426 59.2%
11,900 40.8% -1,346
-7.5% -9.07%
HKERRY 11,110
9.2%
53.0% 7,300 70.7%
3,810 29.3% -535
-6.0% -8.06%
________________________________________________________________________________________________
State
Exit Poll Deviations by Voting Method
There were 1249 precincts exit-polled nationwide.
Kerry won the state-weighted national poll by 51.8-47.2%.
The net 4.26m "red-shift" to Bush is based on the average state exit poll WPE.
Coincidentally, this exactly matched the 4.26m red-shift from the 12:22am NEP to the 2pm Final.
National Exit Poll
12:22am (13047 respondents) 2pm Final (13660 respondents)
Voted2k Weight
Kerry Bush
Other Weight Kerry
Bush Other
DNV2k
17% 57%
41% 2%
17% 54%
45% 1%
Gore
39% 91%
8% 1%
37% 90%
10% 0%
Bush
41% 10%
90% 0%
43% 9%
91% 0%
Other
3% 71%
21% 8%
3% 71%
21% 8%
Share
100% 51.41% 47.62%
0.97% 100%
48.48% 51.11% 0.41%
Votes
122.3 62.87 58.24
1.19 122.3
59.29 62.50 0.50
The largest vote deviations were in the following states:
California (668k): 66% Optical scan; 29% DRE
New York (415k): 99% Levers
Ohio (305k): 72% Punch cards; 16% DRE; 12% Optical scan
Florida (287k): 56% DRE; 44% Optical scan
Pennsylvania (252k): 26% DRE; 12% Optical scan; 49% Lever; 12% Punch cards
The only all-lever states are NY and CT.
Pennsylvania is 49% Lever.
Oregon votes 100% by mail-in ballots.
Recorded
2-party vote by voting method:
Total DRE
Optiscan Lever Punch Paper
Other
121056 36715
45646 15762 15103
2842 4988
100%
30.3% 37.7% 13.0%
12.5% 2.3% 4.1%
Vote
Deviation to Bush based on state exit poll average WPE:
Dev
DRE Optiscan Lever
Punch Paper Other
4258 1215
1564 788
514 89 88
100% 28.5%
36.7% 18.5% 12.1%
2.1% 2.1%
Voting
method mix for 1249 exit poll precincts:
Total
DRE Optiscan Lever
Punch Paper/Other
1249
360 573
118 158 40
100% 28.8%
45.9% 9.4% 12.7%
3.2%
Average WPE (Within Precinct
Error) by Location-size
Average
WPE
Precincts
mean median ABS
Total
1249
-6.77 -6.54 p; 13.76
URBAN >50K
Optical
350
-7.2 -5.8 & 12.3
DRE
272 -7.5
-7.6 14.8>
Lever
92 -12.7
-12.5 16.8
Punch
108 -9.3
-10.0 15.2
Paper 5
-6.0 -11.5 ; 15.7
TOTAL
827 -8.2
-7.7 14.0>
RURAL
<50K
Optical
223
-4.4 -5.0 & 13.2
DRE 88
-6.0 -4.8 & 14.8
Lever
26 -3.2
-5.4 14.7>
Punch 50
-0.8 -1.7 & 12.0
Paper 35
-1.6 -0.6 & 10.5
TOTAL 422
-4.0 -4.2 & 13.3
Voting Method by
Location-size
DRE Optiscan Lever
Punch Paper Total
Precincts
360 573
118 158
40 1249
Pct of Total
28.8% 45.9% 9.4%
12.7% 3.2% 100%
5 Categories:
Urban>500k
43 45
11 6
0 105
Urban>50k
76 114
15 30
0 235
Suburbs
153
191 66
72
5 487
10-50k
38 59
8 19
2 126
Rural
50 164 18
31 33
296
3 Categories:
Urban
>50K 119
159 26
36
0 340
Suburbs
153
191 66
72
5 487
Rural
<50K
88 223
26 50
35 422
TOTAL
360 573
118 158
40 1249
State Voting Method Mix
Exit Poll Vote Discrepancies (in thousands)
Kerry (-), Bush (+)
Avg Vote
Percentage
Mix
State WPE
Dev DRE Optiscan
Lever Punch Paper Other
CA
-10.9% -668 p;
29 66
0
4 0
0
NY
-11.4% -415 p;
1
0
99 0
0 0
OH
-10.9% -305 p;
16 12
0
72
0 0
FL
-7.6% -287 ;
56 44
0
0
0 0
PA
-8.8% -252 ;
26 12
49 12 1
0
NC
-11.3% -197 p;
43 43
2
9 0
4
TX
-4.8% -177 ;
45 45
3
5
2 0
NJ
-9.7% -174 ;
73
1
25 0
0 0
MI
-6.3% -151 ;
4
60 12
20 4
0
MN
-9.3% -130 ; 0
91
0
0
9 0
VA
-7.9% -125 ;
33 22
27 16 0
1
CT
-15.7% -122 p;
0
0 100
0 0
0
WA
-8.4% -118 ;
14 63
0
23 0
0
IL
-4.4% -115 ;
0
32
0 63
0 5
AL
-11.3% -106 p;
15 85
0
0 0
0
MD
-8.1% -96 &
100 0
0 0
0 0
MA
-5.8% -83 &
0
69
6
0
21 4
SC
-10.0% -80 ;
86 14
0
0
0 0
MO
-5.8% -79 &
0
12
0 65
1 22
WI
-4.7% -70 &
0
54
0 0
18 28
CO
-6.1% -64 &
37 61
0 1
0 0
MS
-11.3% -64 ;
15 68
8
9
0 0
NH
-13.6% -46 ;
0
65
0 0
35 0
NV
-10.1% -41 ;
100 0
0
0
0 0
LA
-3.8% -37 &
54
0
46 0
0 0
GA
-2.2% -36 &
100 0
0 0
0 0
NE
-8.1% -31 &
0
56
0
0
4 40
NM
-7.8% -29 &
90 10
0 0
0 0
UT
-6.4% -29 &
0
0
0 9
0 91
AZ
-4.6% -24 &
0 100
0 0
0 0
VT
-15.0% -23 ;
0
51
0 0
49 0
IA
-3.0% -22 &
11 88
1 0
0 0
IN
-1.5% -18 &
79
0
1 20
0 1
DE
-15.9% -18 ;
100 0
0
0
0 0
AK
-9.6% -14 &
0
90
0 0
10 0
ME
-3.8% -14 &
0
67
0 0
33 0
RI
-4.7% -10 &
0 100
0 0
0 0
HI
-4.7% -10 &
50 50
0 0
0 0
KS
-1.7% -10 &
37 60
0 0
3 0
DC
-3.4% -6 &nnbsp;
50 50
0 0
0 0
TN
-0.5% -6 &nnbsp;
75 10
5
11
0 0
WY
-4.3% -5 &nnbsp;
2
76
3 14
5 0
AR
-0.5% -5 &nnbsp;
5
65
9 17
4 0
ID
-1.0% -3 &nnbsp;
0
33
0 60
8 0
OR
0.0% 0
0
18
0 0
0 82
KY
0.1% 1
81 17
2 0
0 0
MT
1.8% 4
0
81
0 13
6 0
ND
5.2% 8
7
90
0
0 3
0
SD
4.2% 8
0
1
0 0
6 93
OK
1.9% 14
0 100
0 0
0 0
WV
5.8% 22
8
42 6
37
7 0
Votes
-4258 -1215
-1564 -788 ;
-514 -89 &nnbsp; -88
Mix
100%
28.5% 36.7% 18.5%
12.1% 2.1% 2.1%
________________________________________________________________________________________________
National Exit Poll Timeline
Summary
There was a steady Kerry trend (51-48%) on Election Day. The timeline shows how the Final National Exit Poll was forced to match the recorded vote the day after the election. Category weightings, except for How Voted and Party ID, were essentially unchanged in the Final NEP. But the Bush vote shares had to be inflated in order to match the recorded vote.
1. Kerry vote shares for all demographics were fairly constant until they were changed in the Final NEP.
2. Bush/Gore Voted 2000 weights changed abruptly from 12:22am to the Final (41/39 to 43/37).
3. Party ID weights changed from sharply from 12:22am to the Final (38/35 to 37/37).
4. Kerry won by over 4 million votes (51-48%) in all timelines prior to the Final.
He lost the Final by 3.22 million.
5. Using adjusted, feasible weights, Kerry won by 7-9 million in timelines prior to the Final.
He won the Final by 3.36 million.
6. Probabilities of discrepancies decreased dramatically as the number of respondents increased.
7. A 20% exit poll cluster effect was assumed for calculating the margin of error.
NEP updates and number of respondents
These are links to 2004 preliminary and final national
exit polls.
11/2/04, 3:59pm 8349 respondents
http://www.scoop.co.nz/stories/pdfs/Mitofsky4zonedata/US2004G_3737_PRES04_NONE_H_Data.pdf
11/2/04, 7:33pm 11027 respondents
http://www.scoop.co.nz/stories/pdfs/Mitofsky4zonedata/US2004G_3798_PRES04_NONE_H_Data.pdf
11/3/04,
12:22am 13047 respondents
http://www.geocities.com/electionmodel/exitpolls_us_110204.gif
11/3/04, 1:25pm 13660 respondents
http://www.scoop.co.nz/stories/pdfs/Mitofsky4zonedata/US2004G_3970_PRES04_NONE_H_Data.pdf
Voted 2000 Summary
NEP
Sample Poll Actual Vote
Prob Adjusted
Vote Prob
Timeline Size
MoE Kerry Margin 1
in Kerry
Margin 1 in
3:59pm
8349 1.29% 51.01%
4.96 17k
53.01% 9.39 397bn
7:38pm
11027 1.12% 50.90%
4.66 88k
52.47% 8.17 695bn
12:22am 13047
1.03% 51.41% 4.63
81mm 52.57% 7.52 281tr
2:05pm
13660 1.01% 48.48%
-3.22 nc &nnbsp;
51.17% 3.36 nc
8349
Respondents
11/02
3:59pm Vote Shares
Votes (in millions)
2000
Votes Weight Kerry
Bush Other Kerry
Bush Other
DNV
18.34 15%
62% 37%
1% 11.37
6.79 0.18
Gore
47.69 39%
91% 8%
1% 43.39
3.81 0.48
Bush
51.35 42%
9% 90%
0% 4.62
46.22 0.00
Other
4.89 4%
61% 12%
16% 2.98
0.59 0.78
Total 122.3
100% 51.01% 46.95%
1.18% 62.37 57.41 1.44
11027
Respondents
11/02
7:38pm
2000
Votes Weight Kerry
Bush Other Kerry
Bush Other
DNV
20.79 17%
59% 39%
1% 12.26
8.11 0.21
Gore
46.46 38%
91% 8%
1% 42.28
3.72 0.46
Bush
50.13 41%
9% 90%
0% 4.51
45.12 0.00
Other
4.89 4%
65% 13%
16% 3.18
0.64 0.78
Total
122.3 100% 50.90%
47.09% 1.19% 62.24
57.58 1.46
13047
Respondents
11/03
12:22am
2000
Votes Weight Kerry
Bush Other Kerry
Bush Other
DNV
20.79 17%
57% 41%
2% 11.85
8.52 0.42
Gore
47.69 39%
91% 8%
1% 43.39
3.81 0.48
Bush
50.13 41%
10% 90%
0% 5.01
45.12 0.00
Other
3.67 3%
71% 21%
8% 2.60
0.77 0.29
Total
122.3 100% 51.41%
47.62% 0.97% 62.86
58.22 1.19
Final
13660
Respondents
11/03
2:05pm
2000
Votes Weight Kerry
Bush Other Kerry
Bush Other
DNV
20.79 17%
54% 45%
1% 11.22
9.35 0.21
Gore
45.24 37%
90% 10%
0% 40.72
4.52 0.00
Bush
52.58 43%
9% 91%
0% 4.73
47.84 0.00
Other
3.67 3%
71% 21%
8% 2.60
0.77 0.29
Total
122.3 100% 48.48%
51.11% 0.41% 59.28
62.49 0.50
____________________________________________________________________
Voted 2000 Timeline -
adjusted
weights
(2000 recorded vote, 0.87% annual mortality,
95% turnout of 2000 voters)
8349
Respondents
11/02
3:59pm
Vote Shares
Votes (in millions)
2000 Votes
Weight Kerry Bush
Other Kerry Bush
Other
DNV
26.22 21.44% 62%
37% 1%
16.26 9.70 0.26
Gore
46.75 38.24% 91%
8% 0%
42.55 3.74 0.00
Bush
46.25 37.83%
9% 90%
0% 4.16
41.63 0.00
Other
3.04 2.49%
61% 12%
16% 1.86
0.37 0.49
Total
122.3 100% 53.01%
45.34% 0.61% 64.82 55.44
0.75
11027
Respondents
11/02
7:38pm
2000
Votes Weight Kerry
Bush Other Kerry
Bush Other
DNV
26.22 21.44% 59%
39% 1%
15.47 10.23 0.26
Gore
46.75 38.24% 91%
8% 1%
42.55 3.74 0.47
Bush
46.25 37.83%
9% 90%
0% 4.16
41.63 0.00
Other
3.04 2.49%
65% 13%
16% 1.98
0.40 0.49
Total
122.3 100% 52.47%
45.79% 1.00% 64.16
55.99 1.22
13047
Respondents
11/03
12:22am
2000
Votes Weight Kerry
Bush Other Kerry
Bush Other
DNV
26.22 21.44% 57%
41% 2%
14.95 10.75 0.52
Gore
46.75 38.24% 91%
8% 1%
42.55 3.74 0.47
Bush
46.25 37.83% 10%
90% 0%
4.63 41.63 0.00
Other
3.04 2.49%
71% 21%
8% 2.16
0.64 0.24
Total
122.3 100% 52.57%
46.42% 1.01% 64.28
56.76 1.24
13660
Respondents
11/03
2:05pm
2000
Votes Weight Kerry
Bush Other Kerry
Bush Other
DNV
26.22 21.44% 54%
45% 1%
14.16 11.80 0.26
Gore
46.75 38.24% 90%
10% 0%
42.08 4.68 0.00
Bush
46.25 37.83%
9% 91%
0% 4.16
42.09 0.00
Other
3.04 2.49%
71% 21%
8% 2.16
0.64 0.24
Total
122.3 100% 51.17%
48.42% 0.41% 62.56
59.20 0.51
____________________________________________________________________
NEP Demographic Timeline
Change from 12:22am to 1:25pm Final required
to match recorded vote count
NEP
Update 3:59pm 7:33pm
12:22am 1:25pm Final 3:59pm 7:33pm
12:22am 1:25pm Final
Respondents
8349 11027
13047 13660 Change
8349 11027 13047
13660 Change
Category
Weight
Kerry Vote
Share
GENDER
Male
42 46
46
46
47 47
47 44 -3
Female
58 54
54
54
53 54
54 51 -3
PCT
100 100
100
100
50.48 50.78 50.78 47.78
VOTE (mil)
61.72 62.08 62.08 58.42
REGION
East
23 22
22
22
58 58
58 56 -2
Midwest
25 26
26
26
50 50
50 48
-2
South
31 31
31 32
+1
44 45
45 42 -3
West
21 21
21 20
-1 &nnbsp;
53 53
53 50 -3
PCT
100 100
100
100
50.61 50.84 50.84 48.24
VOTE
61.88 62.16 62.16 58.98
PARTY
ID
Democrat
39 38
38 37
-1 90
90 90
89 -1
Republican
36
36 35
37 +2
7 7
7 6
-1
Independent
25
26 27
26 -1
52 52
52 49 -3
PCT
100 100
100
100
50.62 50.24 50.69 47.89
VOTE
61.89 61.42 61.97 58.55
IDEOLOGY
Liberal
22
22 22
21 -1 86
87 86
85 -1
Moderate
45 45
45
45
58 57
57 54 -3
Conservative
33 33
33 34
+1
16 16
16 15 -1
PCT
100 100
100
100
50.3 50.07 49.85
47.25
VOTE
61.50 61.22 60.95 57.77
VOTED
2000
Did Not Vote
15
17 17
17
62 59
57 54 -3
Gore
39 38
39 37
-2
91 91
91 90 -1
Bush
42 41
41 43
+2 9
9
10 9 -1
Other
4
4
3
3
61 65
71 71
PCT
100 100
100
100
51.01 50.9 51.41
48.48
VOTE
62.36 62.23 62.85 59.27
WHEN
DECIDED
Today
6
6
6
5
52 54
53 52
-1
Last 3 Days
3
3
3
4
50 54
53 55
+2
Last Week
2
2
2
2
48 48
48 48
Last Month
10
10 10
10
61 61
60 54
-6
Over 30 Days
79 79
79
79
50 50
50 46
-4
PCT
100 100
100
100
51.18 51.42 51.23 47.5
VOTE
62.57 62.87 62.63 58.07
EDUCATION
No High School
4
4
4
4
50 52
52 50
-2
High School Grad
22 22
22
22
50 51
51 47
-4
Some College
30
31 31
32 +1
48 47
47 46
-1
College Grad
26 26
26
26
48 49
48 46
-2
Post Grad
18
17 17
16 -1
58 58
58 55
-3
PCT
100 100
100
100
50.32 50.34 50.21 47.82
VOTE
61.52 61.55 61.39 58.46
RACE/GENDER
White Male
33 36
36
36
40 41
41 37
-4
White Female
44 41
41
41
47 47
47 44
-3
Non-white Male
10 10
10
10
69 70
69 67
-2
Non-white Female
13 13
13
13
77 77
77 75
-2
PCT
100 100
100
100
50.79 51.04 50.94 47.81
VOTE
62.10 62.40 62.28 58.45
AGE
18-29
15
17 17
17
56 56
56 54
-2
30-44
27
27 29
29
48 49
49 46
-3
45-59
31
30 30
30
52 51
51 48
-3
60+
27 26
24 24
48 48
48 46
-2
PCT
100 100
100
100
50.44 50.53 50.26 47.96
VOTE
61.67 61.78 61.47 58.64
INCOME
0-15k
9
9
9 8
-1
68 66
66 63
-3
15-30
15
15 15
15
59 59
59 57
-2
30-50
22
22 22
22
53 52
52 50
-2
50-75
22
23 23
23
46 45
45 43
-2
75-100
14
13 13
14 +1 49
49 49
45 -4
100-150
11
11 11
11
44 45
45 42
-3
150-200
4
4
4
4
45 47
47 42
-5
200+
3
3
3
3
40 41
41 35
-6
PCT
100 100
100
100
51.45 51.01 51.01 48.13
VOTE
62.90 62.36 62.36 58.84
RELIGION
Protestant
53 53
53
53
43 43
43 40
-3
Catholic
27 27
27
27
50 50
50 47
-3
Jewish
3
3
3
3
77 77
77 74
-3
Other
7
7
7
7
76 75
75 74
-1
None
10 10
10
10
69 70
70 67
-3
PCT
100 100
100
100
50.82 50.85 50.85 47.99
VOTE
62.13 62.17 62.17 58.67
MILITARY
EXPERIENCE
Yes
18
18 18
18
43 43
43 41
-2
No
82
82 82
82
52 53
53 50
-3
PCT
100 100
100
100
50.38 51.2
51.2 48.38
VOTE
61.59 62.60 62.60 59.15
___________________________________________________________________________________________________
National Exit Poll – Preliminary, Final
and Adjusted (True)
Adjusted shares matched to the calculated
True vote.
Final shares matched to the Recorded vote
(initial 95% reported).
PRELIMINARY ADJUSTED
(True Vote)
FINAL
12:22am (13047) 12:22am (13047) 1:25pm (13660)
CATEGORY
Kerry
Bush
Other Kerry
Bush
Other
Kerry
Bush Other
Average
50.83%
47.92%
1.25%
52.50% 46.50%
1.00%
47.94% 51.11% 0.96%
Total
Votes 62.16
58.60
1.53
66.01 58.47
1.26
58.62
62.50 1.17
Gender
50.78% 48.22%
1.00%
52.47% 46.53% 1.00%
47.78% 51.22% 1.00%
Party-ID
51.07%
47.85%
1.08%
52.50% 46.50%
1.00%
47.89% 51.22% 0.89%
Voted
2000 51.43% 47.60%
0.97%
52.56% 46.43% 1.01%
48.48% 51.11% 0.41%
Region
50.53% 47.95%
1.52%
52.52% 46.48% 1.00%
48.24% 51.08% 0.68%
Education
50.43% 48.18%
1.39%
52.49% 46.51% 1.00%
47.82% 51.24% 0.94%
Race
50.98% 47.61%
1.41%
52.47% 46.53% 1.00%
47.81% 50.99% 1.20%
Age
50.26% 47.69%
2.05%
52.42% 46.58% 1.00%
47.96% 51.28% 0.76%
Income
51.07% 47.75%
1.18%
52.52% 46.48% 1.00%
48.13% 51.02% 0.85%
Ideology
50.18%
48.60%
1.22%
52.51% 46.49%
1.00%
47.25% 51.54% 1.21%
Religion
50.78%
48.01%
1.21%
52.49% 46.51%
1.00%
47.99% 50.94% 1.07%
Military
51.20%
47.62%
1.18%
52.56% 46.44%
1.00%
48.38% 50.44% 1.18%
Decided
51.23% 47.93%
0.84%
52.54% 46.46% 1.00%
47.50% 51.22% 1.28%
1.96*stdev
0.79% 0.59%
0.62%
0.08% 0.10%
0.06%
0.68% 0.52%
0.50%
2-pty vote 97.5%
Confidence
Max
51.62% 48.51%
1.88%
52.58% 47.60% 1.06%
48.62% 51.63% 1.46%
Min
50.04% 47.33%
0.63%
52.42% 47.39% 0.94%
47.25% 50.59% 0.45%
PRELIMINARY ADJUSTED (True Vote) FINAL
GENDER
Weight Kerry Bush
Other
Weight Kerry Bush
Other
Weight Kerry Bush Other
Male
46.0% 47%
52%
1%
46.0% 49.5% 49.5%
1.0%
46% 44%
55% 1%
Fem
54.0% 54%
45%
1%
54.0% 55.0% 44.0%
1.0%
54% 51%
48% 1%
Share
100% 50.78% 48.22%
1.00%
100% 52.47% 46.53%
1.00%
100% 47.78% 51.22% 1.00%
Votes
122.30 62.10 58.97
1.22
125.74 65.98 58.51
1.26
122.3 58.43 62.64 1.22
Dem -1%; Rep +2%; Ind -1%
PARTY ID
Weight Kerry Bush
Other
Weight Kerry Bush
Other
Weight Kerry Bush Other
Dem
38% 91%
9%
0%
38% 91%
8%
1%
37% 89% 11%
0%
Rep
35% 7%
93%
0%
35% 8%
91%
1%
37% 6%
93% 1%
Ind
27% 52%
44%
4%
27% 56%
43%
1%
26% 49%
49% 2%
Share
100% 51.07% 47.85%
1.08%
100% 52.50% 46.50%
1.00%
100% 47.89% 51.22% 0.89%
Votes
122.30 62.46 58.52 1.32
125.74 66.01 58.47
1.26
122.3 58.57 62.64 1.09
VOTED 2000
Weight Kerry Bush
Other
turnout
Gore -2%+ Bush
+2%
New
11% 55%
43%
2%
Weight Kerry Bush
Other
Weight Kerry Bush Other
DNV
6% 61%
37%
2%
21.49% 57%
41% 2%
17% 54%
45% 1%
Gore
39% 91%
8%
1%
38.23% 91%
8%
1%
37% 90%
10% 0%
Bush
41% 10%
90%
0%
37.83% 10%
90% 0%
43% 9%
91% 0%
Other
3% 71%
21%
8%
2.45% 71%
21%
8%
3% 71%
21% 8%
Share
100% 51.43% 47.60%
0.97%
100% 52.56% 46.43%
1.01%
100% 48.48% 51.11% 0.41%
Votes
122.30 62.90 58.21
1.19
125.74 66.09 58.38
1.27
122.3 59.29 62.50 0.50
South +1%; West
-1% &
REGION
Weight Kerry Bush
Other
Weight Kerry Bush
Other Weight
Kerry Bush Other
East
22% 58%
41%
1%
22% 59%
40%
1%
22% 56%
43% 1%
Midw
26% 50%
49%
1%
26% 52%
47% 1%
26% 48%
51% 1%
South
31% 44%
54%
2%
31% 46%
53%
1%
32% 42%
58% 0%
West
21% 53% 45%
2%
21% 56%
43% 1%
20% 50%
49% 1%
Share
100% 50.53% 47.95%
1.52%
100% 52.52% 46.48%
1.00%
100% 48.24% 51.08% 0.68%
Votes
122.30 61.80 58.64
1.86
125.74 66.04 58.44
1.26
122.3 59.00 62.47 0.83
Some
college+1%; Post Grad
-1% &
EDUCATION
Weight Kerry Bush
Other
Weight Kerry Bush
Other
Weight Kerry Bush Other
NoHS
4% 53%
46%
1%
4% 51% 48%
1%
4% 50%
49% 1%
HSG
22% 50%
48%
2%
22% 53%
46%
1%
22% 47%
52% 1%
Col
31% 48%
51%
1%
31% 50%
49%
1%
32% 46%
54% 0%
ColG
26% 49%
50%
1%
26% 51%
48%
1%
26% 46%
52% 2%
PostG
17% 57%
41%
2%
17% 59%
40% 1%
16% 55%
44% 1%
Share
100% 50.43% 48.18%
1.39%
100% 52.49% 46.51%
1.00%
100% 47.82% 51.24% 0.94%
Votes
122.30 61.67 58.92
1.70
125.74 66.00 58.48
1.26
122.3 58.48 62.66 1.15
RACE AND GENDER
Weight Kerry Bush
Other
Weight Kerry Bush
Other
Weight Kerry Bush Other
WMale
36% 40%
59%
1%
36% 43%
56%
1%
36% 37%
62% 1%
WFem
41% 47%
51%
2%
41% 48%
51%
1%
41% 44%
55% 1%
NwMale
10% 73%
26%
1%
10% 73%
26% 1%
10% 67%
30% 3%
NwFem
13% 77%
22%
1%
13% 77%
22%
1%
13% 75%
24% 1%
Share
100% 50.98% 47.61%
1.41%
100% 52.47% 46.53%
1.00%
100% 47.81% 50.99% 1.20%
Votes
122.30 62.35 58.22
1.72
125.74 65.98 58.51
1.26
122.3 58.47 62.36 1.47
PRELIMINARY ADJUSTED (True Vote) FINAL
AGE
Weight Kerry Bush
Other
Weight Kerry Bush
Other Weight
Kerry Bush Other
18-29
17% 56%
42%
2%
17% 60%
39%
1%
17% 54%
45% 1%
30-44
29% 48%
49%
3%
29% 50%
49%
1%
29% 46% 53%
1%
45-59
30% 51%
47%
2%
30% 54%
45%
1%
30% 48%
51% 1%
60+
24% 48%
51%
1%
24% 48%
51%
1%
24% 46% 54%
0%
Share
100% 50.26% 47.69%
2.05%
100% 52.42% 46.58%
1.00%
100% 47.96% 51.28% 0.76%
Votes
122.30 61.47 58.32
2.51
125.74 65.91 58.57
1.26
122.3 58.65 62.71 0.93
0-15 -1%; 75-100
+1%
INCOME
Weight Kerry Bush
Other
Weight Kerry Bush
Other Weight
Kerry Bush Other
0-15K
9% 65%
34%
1%
9% 67%
32%
1%
8% 63%
36% 1%
15-30
15% 60%
39%
1%
15% 61%
38%
1%
15% 57%
42% 1%
30-50
22% 53%
46%
1%
22% 54%
45%
1%
22% 50% 49%
1%
50-75
23% 46%
53%
1%
23% 47%
52%
1%
23% 43%
56% 1%
75-100
13% 48%
51%
1%
13% 49%
50%
1%
14% 45% 55%
0%
100-150 11% 43%
55%
2%
11% 48%
51%
1%
11% 42% 57%
1%
150-200 4%
43% 55%
2%
4% 45%
54%
1%
4% 42%
58% 0%
200+
3% 43%
55%
2%
3% 40%
59%
1%
3% 35%
63% 2%
Share
100% 51.07% 47.75%
1.18%
100% 52.52% 46.48%
1.00%
100% 48.13% 51.02% 0.85%
Votes
122.30 62.46 58.40
1.44
125.74 66.04 58.44
1.26
122.3 58.86 62.39 1.04
Lib -1%; Con
+1%
IDEOLOGY
Weight Kerry Bush
Other
Weight Kerry Bush
Other Weight
Kerry Bush Other
Lib
22% 86%
12%
2%
22% 91%
8%
1%
21% 85%
13% 2%
Mod
45% 57%
42%
1%
45% 59%
40%
1%
45% 54%
45% 1%
Con
33% 17%
82%
1%
33% 18%
81%
1%
34% 15%
84% 1%
Share
100% 50.18% 48.60%
1.22%
100% 52.51% 46.49%
1.00%
100% 47.25% 51.54% 1.21%
Votes
122.30 61.37 59.44
1.49
125.74 66.03 58.46
1.26
122.3 57.78 63.03 1.48
RELIGION
Weight Kerry Bush
Other
Weight Kerry Bush
Other Weight
Kerry Bush Other
Prot
53% 43%
56%
1%
53% 44%
55%
1%
53% 40%
59% 1%
Cath
27% 50%
49%
1%
27% 52%
47%
1%
27% 47%
52% 1%
Jewish
3% 78%
22%
0%
3% 79%
20%
1%
3% 74%
25% 1%
Other
7% 75%
22%
3%
7% 78%
21% 1%
7% 74%
24% 2%
None
10% 69%
29%
2%
10% 73%
26%
1%
10% 67%
32% 1%
Share
100% 50.78% 48.01%
1.21%
100% 52.49% 46.51%
1.00%
100% 47.99% 50.94% 1.07%
Votes
122.30 62.10 58.71
1.48
125.74 66.00 58.48
1.26
122.3 58.69 62.30 1.31
Weight Kerry Bush
Other
Weight Kerry Bush
Other Weight
Kerry Bush Other
Yes
18% 43%
55%
2%
18% 46%
53%
1%
18% 41%
57% 2%
No
82% 53%
46%
1%
82% 54%
45%
1%
82% 50%
49% 1%
Share
100% 51.20% 47.62%
1.18%
100% 52.56% 46.44%
1.00%
100% 48.38% 50.44% 1.18%
Votes
122.30 62.62 58.24
1.44
125.74 66.09 58.39
1.26
122.3 59.17 61.69 1.44
Today -1%; Last3
+1%
WHEN DECIDED
Weight Kerry Bush
Other
Weight Kerry Bush
Other Weight
Kerry Bush Other
Today
6% 53%
40%
7%
6% 66%
33%
1%
5% 52%
45% 3%
3days
3% 53%
41%
6%
3% 66%
33%
1%
4% 55%
42% 3%
7days
2% 48%
50%
2%
2% 50%
49%
1%
2% 48%
51% 1%
30days
10% 60%
38%
2%
10% 61%
38%
1%
10% 54%
44% 2%
Over30
79% 50%
50%
0%
79% 50%
49%
1%
79% 46%
53% 1%
Share
100% 51.23% 47.93%
0.84%
100% 52.54% 46.46%
1.00%
100% 47.50% 51.22% 1.28%
Votes
122.30 62.65 58.62
1.03
125.74 66.06 58.42
1.26
122.3 58.09 62.64 1.57
___________________________________________________________________________________________________
Effect of changes in demographic
vote shares on Kerry’s national vote
The base case scenario assumes the following:
1) 12:22am NEP vote shares matched to “Voted 2000” base case
2) 0.87% annual mortality rate (3.5% over 4 years)
3) 95% voter turnout of all 2000 voters
Kerry wins the base case: 52.6-46.4%
Row and column ranges refer to Kerry vote shares.
GENDER
Votes Weight Kerry
Bush Other
Male
58.34 46.4% 49.5%
49.5% 1.0%
Female
67.40
53.6% 55.0% 44.0%
1.0%
Share
Total 100.0% 52.4%
46.6% 1.0%
Votes
125.74 125.74 65.95
58.56 1.23
Male
44.0% 45.0% 46.0%
47.0% 48.0% 49.0% 50.0%
Female
51%
47.8% 48.2% 48.7%
49.1% 49.6% 50.1% 50.5%
52%
48.3% 48.8% 49.2%
49.7% 50.1% 50.6% 51.1%
53%
48.8% 49.3% 49.8%
50.2% 50.7% 51.1% 51.6%
54%
49.4% 49.8% 50.3%
50.8% 51.2% 51.7% 52.1%
55%
49.9% 50.4% 50.8%
51.3% 51.8% 52.2% 52.7%
PARTY
ID
Votes Weight Kerry
Bush Other
Dem
47.78 38.0% 91.0%
8.0% 1.0%
Rep
44.01 35.0% 8.0%
91.0% 1.0%
Ind
33.95 27.0% 56.0%
43.0% 1.0%
Share
Total 100.0% 52.5%
46.5% 1.0%
Votes
125.74 125.74 66.01
58.47 1.26
Kerry Share of Democrats
Dem ID
86.0% 87.0% 88.0%
89.0% 90.0% 91.0% 92.0%
35%
48.0% 48.4% 48.7%
49.1% 49.4% 49.8% 50.1%
36%
48.9% 49.2% 49.6%
50.0% 50.3% 50.7% 51.0%
37%
49.7% 50.1% 50.5%
50.9% 51.2% 51.6% 52.0%
38%
50.6% 51.0% 51.4%
51.7% 52.1% 52.5%
52.9%
39%
51.5% 51.9% 52.2%
52.6% 53.0% 53.4% 53.8%
40%
52.3% 52.7% 53.1%
53.5% 53.9% 54.3% 54.7%
Kerry Kerry share of
Democrats
share
88.0% 89.0% 90.0%
91.0% 92.0% 93.0% 94.0%
Ind
49%
49.5% 49.9% 50.2%
50.6% 51.0% 51.4% 51.8%
50%
49.7% 50.1% 50.5%
50.9% 51.3% 51.6% 52.0%
51%
50.0% 50.4% 50.8%
51.2% 51.5% 51.9% 52.3%
52%
50.3% 50.7% 51.0%
51.4% 51.8% 52.2% 52.6%
53%
50.6% 50.9% 51.3%
51.7% 52.1% 52.5% 52.8%
54%
50.8% 51.2% 51.6%
52.0% 52.3% 52.7% 53.1%
VOTED
IN
2000
Votes Weight Kerry
Bush Other
DNV2k
27.02 21.5% 57.0%
41.0% 2.0%
Gore
48.08 38.2% 91.0%
8.0% 1.0%
Bush
47.56 37.8% 10.0%
90.0% 0.0%
Other
3.08 2.5%
71.0% 21.0% 8.0%
Share
Total 100.0% 52.6%
46.4% 1.0%
Votes
125.74 125.74 66.09
58.38 1.27
DNV2k
49.0% 51.0% 53.0%
54.0% 57.0% 59.0% 61.0%
Gore
86%
48.9% 49.4% 49.8%
50.0% 50.7% 51.1% 51.5%
87%
49.3% 49.7% 50.2%
50.4% 51.0% 51.5% 51.9%
88%
49.7% 50.1% 50.6%
50.8% 51.4% 51.8% 52.3%
89%
50.1% 50.5% 50.9%
51.2% 51.8% 52.2% 52.7%
90%
50.5% 50.9% 51.3%
51.5% 52.2% 52.6% 53.0%
91%
50.8% 51.3% 51.7%
51.9% 52.6% 53.0%
53.4%
92%
51.2% 51.7% 52.1%
52.3% 52.9% 53.4% 53.8%
Bush 2000
voters
Gore
7.0% 7.5%
8.0% 8.5%
9.0% 9.5% 10.0%
2000
85%
49.1% 49.3% 49.5%
49.7% 49.9% 50.1% 50.3%
86%
49.5% 49.7% 49.9%
50.1% 50.3% 50.5% 50.7%
87%
49.9% 50.1% 50.3%
50.5% 50.7% 50.8% 51.0%
88%
50.3% 50.5% 50.7%
50.9% 51.0% 51.2% 51.4%
89%
50.7% 50.9% 51.0%
51.2% 51.4% 51.6% 51.8%
90%
51.0% 51.2% 51.4%
51.6% 51.8% 52.0% 52.2%
91%
51.4% 51.6% 51.8%
52.0% 52.2% 52.4% 52.6%
REGION
Votes Weight Kerry
Bush Other
East
27.66 22.0% 59.0%
40.0% 1.0%
Midwest
32.69 26.0% 52.0%
47.0% 1.0%
South
38.98 31.0% 46.0%
53.0% 1.0%
West
26.41 21.0% 56.0%
43.0% 1.0%
Share
Total 100.0% 52.5%
46.5% 1.0%
Votes
125.74 125.74 66.04
58.44 1.26
East
56.0% 57.0% 58.0%
59.0% 60.0% 61.0% 62.0%
Midwest
48%
50.8% 51.0% 51.3%
51.5% 51.7% 51.9% 52.1%
49%
51.1% 51.3% 51.5%
51.7% 52.0% 52.2% 52.4%
50%
51.3% 51.6% 51.8%
52.0% 52.2% 52.4% 52.7%
51%
51.6% 51.8% 52.0%
52.3% 52.5% 52.7% 52.9%
52%
51.9% 52.1% 52.3% 52.5%
52.7% 53.0% 53.2%
53%
52.1% 52.3% 52.6%
52.8% 53.0% 53.2% 53.4%
54%
52.4% 52.6% 52.8%
53.0% 53.3% 53.5% 53.7%
EDUCATION
Votes Weight Kerry
Bush Other
No High School
5.03 4.0%
51.0% 48.0% 1.0%
High
School 27.66
22.0% 53.0% 46.0%
1.0%
Some College
38.98 31.0% 50.0%
49.0% 1.0%
College Grad
32.69 26.0% 51.0%
48.0% 1.0%
Post
Grad 21.38
17.0% 59.0% 40.0%
1.0%
Share
Total 100.0% 52.5%
46.5% 1.0%
Votes
125.74 125.74 66.00
58.48 1.26
High
School
Grad
College 47.0%
48.0% 49.0% 50.0%
51.0% 52.0% 53.0%
Grad
46%
49.9% 50.1% 50.3%
50.5% 50.8% 51.0% 51.2%
47%
50.1% 50.4% 50.6%
50.8% 51.0% 51.2% 51.5%
48%
50.4% 50.6% 50.8%
51.1% 51.3% 51.5% 51.7%
49%
50.7% 50.9% 51.1% 51.3%
51.5% 51.8% 52.0%
50%
50.9% 51.1% 51.4%
51.6% 51.8% 52.0% 52.2%
51%
51.2% 51.4% 51.6%
51.8% 52.0% 52.3% 52.5%
52%
51.4% 51.7% 51.9%
52.1% 52.3% 52.5% 52.8%
53%
51.7% 51.9% 52.1%
52.4% 52.6% 52.8% 53.0%
RACE
AND GENDER
Votes Weight Kerry
Bush Other
WMale
45.27 36.0% 43.0%
56.0% 1.0%
WFem
51.55 41.0% 48.0%
51.0% 1.0%
NwMale
12.57
10.0% 73.0% 26.0%
1.0%
NwFem
16.35 13.0% 77.0%
22.0% 1.0%
Share Total
100.0% 52.5% 46.5%
1.0%
Votes
125.74 125.74 65.98
58.51 1.26
Non-white Female
75.0% 76.0% 77.0%
78.0% 79.0% 80.0% 81.0%
White Female
44%
50.6% 50.7% 50.8%
51.0% 51.1% 51.2% 51.4%
45%
51.0% 51.1% 51.2%
51.4% 51.5% 51.6% 51.8%
46%
51.4% 51.5% 51.7%
51.8% 51.9% 52.0% 52.2%
47%
51.8% 51.9% 52.1%
52.2% 52.3% 52.5% 52.6%
48%
52.2% 52.3% 52.5%
52.6% 52.7% 52.9% 53.0%
49%
52.6% 52.8% 52.9%
53.0% 53.1% 53.3% 53.4%
50%
53.0% 53.2% 53.3%
53.4% 53.6% 53.7% 53.8%
AGE
Votes Weight Kerry
Bush Other
18-29
21.38 17.0% 60.0%
39.0% 1.0%
30-44
36.46 29.0% 50.0%
49.0% 1.0%
45-59
37.72 30.0% 54.0%
45.0% 1.0%
60+
30.18 24.0% 48.0%
51.0% 1.0%
Share Total
100.0% 52.4% 46.6%
1.0%
Votes
125.74 125.74 65.91
58.57 1.26
18-29
54.0% 55.0% 56.0%
57.0% 58.0% 59.0% 60.0%
45-59
48%
49.6% 49.8% 49.9% 50.1%
50.3% 50.5% 50.6%
49%
49.9% 50.1% 50.2%
50.4% 50.6% 50.8% 50.9%
50%
50.2% 50.4% 50.5%
50.7% 50.9% 51.1% 51.2%
51%
50.5% 50.7% 50.8%
51.0% 51.18% 51.4% 51.5%
52%
50.8% 51.0% 51.1%
51.3% 51.5% 51.7% 51.8%
53%
51.1% 51.3% 51.4%
51.6% 51.8% 52.0% 52.1%
54%
51.4% 51.6% 51.7%
51.9% 52.1% 52.3% 52.4%
INCOME
Votes Weight Kerry
Bush Other
0-15K
11.32 9.0% 67.0%
32.0% 1.0%
15-30
18.86 15.0% 61.0%
38.0% 1.0%
30-50
27.66 22.0% 54.0%
45.0% 1.0%
50-75
28.92 23.0% 47.0%
52.0% 1.0%
75-100 16.35
13.0% 49.0% 50.0%
1.0%
100-150 13.83
11.0% 48.0% 51.0%
1.0%
150-200 5.03
4.0% 45.0%
54.0% 1.0%
200+
3.77 3.0%
40.0% 59.0% 1.0%
Share Total
100.0% 52.5% 46.5%
1.0%
Votes
125.74 125.74 66.04
58.44 1.26
30-50k
50.0% 51.0% 52.0%
53.0% 54.0% 55.0% 56.0%
75-100k
45%
51.1% 51.3% 51.6%
51.8% 52.0% 52.2% 52.4%
46%
51.3% 51.5% 51.7%
51.9% 52.1% 52.4% 52.6%
47%
51.4% 51.6% 51.8%
52.0% 52.3% 52.5% 52.7%
48%
51.5% 51.7% 52.0%
52.2% 52.4% 52.6% 52.8%
49%
51.6% 51.9% 52.1%
52.3% 52.5% 52.7%
53.0%
50%
51.8% 52.0% 52.2%
52.4% 52.7% 52.9% 53.1%
51%
51.9% 52.1% 52.3%
52.6% 52.8% 53.0% 53.2%
52%
52.0% 52.3% 52.5%
52.7% 52.9% 53.1% 53.4%
IDEOLOGY
Votes Weight Kerry
Bush Other
Liberal
27.66
22.0% 91.0% 8.0%
1.0%
Moderate
56.58
45.0% 59.0% 40.0%
1.0%
Conservative
41.49 33.0% 18.0%
81.0% 1.0%
Share
Total 100.0% 52.5%
46.5% 1.0%
Votes
125.74 125.74 66.03
58.46 1.26
Liberal
85.0% 86.0% 87.0%
88.0% 89.0% 90.0% 91.0%
Moderate
54%
48.9% 49.2% 49.4%
49.6% 49.8% 50.0% 50.3%
55%
49.4% 49.6% 49.8%
50.1% 50.3% 50.5% 50.7%
56%
49.8% 50.1% 50.3%
50.5% 50.7% 50.9% 51.2%
57%
50.3% 50.5% 50.7%
51.0% 51.2% 51.4% 51.6%
58%
50.7% 51.0% 51.2%
51.4% 51.6% 51.8% 52.1%
59%
51.2% 51.4% 51.6%
51.9% 52.1% 52.3% 52.5%
RELIGION
Votes Weight Kerry
Bush Other
Protestant
66.64 53.0% 44.0%
55.0% 1.0%
Catholic
33.95
27.0% 52.0% 47.0%
1.0%
Jewish
3.77
3.0% 79.0%
20.0% 1.0%
Other 8.80
7.0% 78.0%
21.0% 1.0%
None
12.57 10.0% 73.0%
26.0% 1.0%
Share
Total 100.0% 52.5%
46.5% 1.0%
Votes
125.74 125.74 66.00
58.48 1.26
Catholic
47.0% 48.0% 49.0%
50.0% 51.0% 52.0% 53.0%
Protestant
40%
49.0% 49.3% 49.6%
49.8% 50.1% 50.4% 50.6%
41%
49.6% 49.8% 50.1%
50.4% 50.6% 50.9% 51.2%
42%
50.1% 50.4% 50.6%
50.9% 51.2% 51.4% 51.7%
43%
50.6% 50.9% 51.2%
51.4% 51.7% 52.0% 52.2%
44%
51.1% 51.4% 51.7%
52.0% 52.2% 52.5%
52.8%
45%
51.7% 51.9% 52.2%
52.5% 52.8% 53.0% 53.3%
46%
52.2% 52.5% 52.7%
53.0% 53.3% 53.6% 53.8%
47%
52.7% 53.0% 53.3%
53.5% 53.8% 54.1% 54.4%
SERVED
IN MILITARY
Votes
Weight Kerry Bush
Other
Yes
22.63
18.0% 46.0% 53.0%
1.0%
No
103.11 82.0% 54.0%
45.0% 1.0%
Share
Total 100.0% 52.6%
46.4% 1.0%
Votes
125.74 125.74 66.09
58.39 1.26
No
50.0% 51.0% 52.0%
53.0% 54.0% 55.0% 56.0%
Yes
41%
48.4% 49.2% 50.0%
50.8% 51.7% 52.5% 53.3%
42%
48.6% 49.4% 50.2%
51.0% 51.8% 52.7% 53.5%
43%
48.7% 49.6% 50.4%
51.2% 52.0% 52.8% 53.7%
44%
48.9% 49.7% 50.6%
51.4% 52.2% 53.0% 53.8%
45%
49.1% 49.9% 50.7%
51.6% 52.4% 53.2% 54.0%
WHEN
DECIDED
Votes Weight Kerry
Bush Other
Today
7.54 6.0%
66.0% 33.0% 1.0%
3days
3.77 3.0%
66.0% 33.0% 1.0%
7days
2.51 2.0%
50.0% 49.0% 1.0%
30days 12.57
10.0% 61.0% 38.0%
1.0%
Over30
99.33 79.0% 50.0% 49.0%
1.0%
Share Total
100.0% 52.5% 46.5%
1.0%
Votes
125.74 125.74 66.06
58.42 1.26
Today
54.0% 56.0% 58.0%
61.0% 63.0% 65.0% 66.0%
Over30
48%
50.2% 50.4% 50.5%
50.7% 50.8% 50.9% 51.0%
49%
51.0% 51.2% 51.3%
51.5% 51.6% 51.7% 51.8%
50%
51.8% 51.9% 52.1%
52.2% 52.4% 52.5% 52.5%
51%
52.6% 52.7% 52.9%
53.0% 53.2% 53.3% 53.3%
52%
53.4% 53.5% 53.6%
53.8% 53.9% 54.1% 54.1%
53%
54.2% 54.3% 54.4%
54.6% 54.7% 54.9% 54.9%
54%
55.0% 55.1% 55.2%
55.4% 55.5% 55.6% 55.7%
55%
55.8% 55.9% 56.0%
56.2% 56.3% 56.4% 56.5%
The True Vote model encapsulates mathematical arguments which strongly suggest that Kerry easily won the 2004 election. The base case assumes the 12:22am NEP vote shares. The 2000 recorded vote, mortality rate and 2000 voter turnout in 2004 are used to determine mathematically feasible (and plausible) weights. The model determined that 2.6 million (3.9%) of total votes cast for Kerry were uncounted and that 4.5m (6.8%) votes were switched to Bush. Adding the 7.1m votes to Kerry’s 59.0m recorded vote, he won a 66.1–58.4m landslide with a 336-202 electoral vote margin. A powerful sensitivity analysis displays the effects of changes in input assumptions on Kerry’s national vote for hundreds of scenarios.
The Facts:
1) In 2000, 51.004 million voted for Gore, 50.459 for Bush and 3.275 for Nader and others.
2) Approximately 3.6mm of 104.7mm of 2000 voters died prior to 2004. The annual mortality rate was 0.87%.
3) The 122.3mm recorded vote consisted of returning Gore, Bush, Nader, first-time voters and others who did not vote in 2000 (DNV2k).
The Final NEP weightings were mathematically impossible. Bush 2000 voters could not have comprised 43% (52.9mm) of the 2004 recorded vote; Bush only had 50.46m votes in 2000; approximately 48.7m were alive in 2004. A maximum of 49.2m Gore voters and 48.7m Bush voters could have voted in 2004. Since the Final was forced to match the recorded vote, the recorded vote must have been impossible as well. The fact that Kerry’s vote shares declined by 3% from 12:22am to the Final is further confirmation that the Final NEP did not reflect the true vote; rather, it was matched to a fraudulent, miscounted vote. Evidence of fraud abounds in Florida, Ohio, New Mexico, Nevada, etc.
Base Case Assumptions
1) Kerry Vote Shares
12:22am NEP: Kerry won 57% of DNV2k, 91% of Gore, 10% of Bush and 71% of Nader/Other voters.
In the Final 2pm NEP, which was matched to the recorded vote, Kerry won 54% of DNV, 90% of Gore,
9% of Bush and 71% of Nader voters.
2) 2000 Voter Turnout
An unknown percentage of Gore, Bush and Nader voters turned out in 2004.
For the base case, we assume 95%.
3) Uncounted Votes
According to the Census, 125.7 million voted in 2004, therefore 3.4mm (2.74%) of total votes cast were uncounted. The vast majority of uncounted votes were in heavily Democratic minority districts. The base case assumption is that Kerry won 75% (2.58m) of the uncounted votes.
Base Case True Vote (mil)
Kerry 66.10 (52.57%)
Bush 58.38 (46.43%)
Other 1.27 (1.01%)
Switched Votes
The True Vote is a simple sum of three parameters, two of which are known:
True Vote = Recorded Vote + Uncounted Votes + Switched Votes
Given Kerry’s recorded and uncounted votes, we can solve for votes switched to Bush:
Switched Votes = True Vote - Recorded - Uncounted
4.488
=
66.097 - 59.027 -
2.582
2000 - 2004 Recorded Vote Change
Votes
Dem Share
Rep Share Other
Share
2000 Recorded 104.73 51.004 48.70% 50.456
48.18% 3.274
3.13%
2004 Recorded 122.30 59.027 48.27% 62.040
50.73% 1.228
1.00%
2004 Change 17.561 8.023 -0.43%
11.584 2.55% -2.046 -2.12%
Unctd% Cast:
2.74% 3.445 2.584
75.0% 0.827 24.0% 0.034
1.0%
____________________________________________________________
Calculation of Feasible Weights
2000 Vote 3.5%
Voters Maximum 2004 Adjusted
Vote Share Died
Alive Weight Turnout
Weight
Gore 51.004 48.70% 1.785 49.218
40.25% 95%
38.23%
Bush 50.456 48.18% 1.766 48.690
39.81% 95%
37.82%
Other 3.275 3.13% 0.115
3.160 2.58% 95%
2.46%
DNV -
- -&
24.672 17.36% - 21.49%
Total 104.73 100.0% 3.666 125.74
100.0% -
100.0%
____________________________________________________________
National Exit Poll (feasible weights)
12:22am
(13047)
2:04pm (13660)
VOTED
Base
Case
2000 Turnout Weight
Kerry Bush Other Votes
Weight Kerry Bush Other
DNV
- 211.49%
57% 41%
2% 27.02 21.49%
54% 45% 1%
Gore
95% 38.23% 91%
8% 1%
48.07 38.23% 90%
10% 0%
Bush
95% 37.82% 10%
90% 0% 47.56
37.82% 9% 91%
0%
Other
95% 2.46% 71%
21% 8%
3.09 2.46% 71%
21% 8%
TRUE
100% 52.57% 46.43%
1.01%
100% 51.16% 48.43% 0.41%
Vote
125.74
66.10 58.38
1.27 125.74
64.33 60.89 0.52
Kerry
margin:
7.72mm
3.44mm
____________________________________________________________
National Exit Poll (original weights)
12:22am (13047)
2:04pm (matched to
vote)
VOTED
2000 Weight
Kerry Bush Other
Votes Weight
Kerry Bush Other
DNV
17% 57%
41% 2%
20.79
17% 54%
45% 1%
Gore
39% 91%
8% 1%
47.70 37%
90% 10% 0%
Bush
41% 10%
90% 0%
50.14
43% 9%
91% 0%
Other
3% 71%
21% 8%
3.67
3% 71%
21% 8%
Total 100%
51.41% 47.62% 0.97%
122.30 100%
48.48% 51.11% 0.41%
Vote 122.30
62.87 58.24
1.19
122.30 59.29 62.50 0.50
Kerry
margin:
4.63mm
-3.22mm
____________________________________________________________
True Vote Reconciliation:
Recorded, Uncounted and Switched
Votes
Recorded
2.74% +Uncounted +Switched
= True Vote
Kerry 59.027 75%
2.584 61.611 4.488 6.79%
66.097 52.57%
Bush 62.040 24%
0.827 62.867 -4.488 -7.69%
58.375 46.43%
Other 1.228 1%
0.034 1.262 0
0% 1.268 1.01%
Total 122.30 100% 3.445
125.74 0
0% 125.74 100%
____________________________________________________________
The following scenarios are further evidence that Kerry won, even when the base case assumptions (in parenthesis) are changed to favor Bush.
Scenario 1:
10% advantage in turnout of Bush 2000 voters over Gore voters.
Gore turnout: 90% (95%)
Bush turnout: 100% (95%)
Kerry wins by 3.62mm votes (51.0-48%).
Scenario 2:
Reduce Kerry share of DNV by 6% and Gore 2000 voter turnout by 4%.
DNV share: 51% (57%)
Gore turnout: 91% (95%)
Bush turnout: 95% (95%)
Kerry wins by 2.88mm votes (50.6%-48.4%).
Scenario 3:
Reduce Kerry share of Gore voters by 4% and Bush voters by 2%.
Assume: 95% turnout of Gore and Bush voters
Gore share: 87% (91%)
Bush share: 8% (10%)
Kerry wins by 1.97mm votes (50.3%-48.7%).
|
___________________________________________________________________________________________________
Sensitivity Analysis 12:22am National Exit Poll (feasible
adjusted weights): How
does Gore and Bush 2000 voter turnout affect the national vote? Scenario assumptions: 100% Bush 2000 voter turnout 95% Gore voter turnout Kerry wins by 51.6 - 47.4%, a 5.32 million vote margin.
Bush
Gore
Turnout
Turnout 95% 96%
97% 98%
99% 100% Kerry Vote Share
95% 52.6%
52.7% 52.8% 53.0%
53.1% 53.2%
96% 52.4%
52.5% 52.7% 52.8%
52.9% 53.1%
97% 52.2%
52.3% 52.5% 52.6%
52.7% 52.9%
98% 52.0%
52.1% 52.3% 52.4%
52.6% 52.7%
99% 51.8%
52.0% 52.1% 52.2%
52.4% 52.5%
100% 51.6% 51.8%
51.9% 52.0% 52.2%
52.3%
Vote
Margin
95% 7.72
8.06 8.40
8.74 9.08
9.42
96% 7.24
7.58 7.92
8.26 8.60
8.93
97% 6.76
7.10 7.44
7.78 8.12
8.45
98% 6.28 6.62
6.96 7.30
7.63 7.97
99% 5.80
6.14 6.48
6.81 7.15
7.49
100% 5.32
5.66 5.99
6.33 6.67
7.01
________________________________________________________
12:22am National Exit Poll
(feasible weights): How
does Gore voter turnout and Kerry's share of DNV2k affect the national vote?
Worst Case Scenario: Gore 2000 voter turnout: 85% (10% LOWER than Lindeman scenario) Bush 2000 voter turnout: 95% Kerry share of DNV2k: 52.9% (Lindeman scenario)
Kerry wins by 50.2 – 48.8%, a 1.70 million
vote margin.
Kerry Vote Share Sensitivity to Gore 2000
Voter turnout and share of DNV2k
Final Nov.3 Nov.2-election
day
13660 13047 11027 8349
1:25pm 12:22am 7:30pm 4pm Gore
Kerry Share of
DNV2k
Turnout 50.0%
52.9% 54.0% 57.0%
59.0% 61.0% 97%
51.4% 52.0% 52.2%
52.8% 53.3% 53.7% 96%
51.2% 51.8% 52.1%
52.7% 53.1% 53.5% 95%
51.1% 51.7% 51.9% 52.6%
53.0% 53.4% 94%
50.9% 51.5% 51.8%
52.4% 52.9% 53.3% 88%
49.9% 50.6% 50.9%
51.6% 52.1% 52.6% 87%
49.7% 50.5% 50.7%
51.5% 52.0% 52.5% 86% 49.6%
50.3% 50.6% 51.3%
51.8% 52.3% 85%
49.4% 50.2% 50.4%
51.2% 51.7% 52.2% 84%
49.2% 50.0% 50.3%
51.1% 51.6% 52.1% 83%
49.1% 49.8% 50.1%
50.9% 51.4% 52.0%
Kerry Vote
Margin
97%
4.76 6.27
6.84 8.40
9.44 10.48 96%
4.35 5.88
6.47 8.06
9.12 10.18 95%
3.94 5.50
6.10 7.72
8.80 9.88 94%
3.53 5.12
5.73 7.38
8.48 9.58 88%
1.07 2.84
3.51 5.35
6.57 7.79 87%
0.66 2.46
3.14 5.01
6.25 7.49 86%
0.25 2.08
2.77 4.67
5.93 7.19 85%
-.16 1.70
2.40 4.33
5.61 6.89 84%
-.57 1.32
2.03 3.99
5.29 6.60 83%
-.98 0.94
1.67 3.65
4.97 6.30
________________________________________________________
12:22am National Exit Poll
(feasible weights): How does Kerry’s share of
returning Gore and Bush voters affect the national vote? Scenario assumptions: 2000 Voter Turnout: 95% Gore; 95% Bush Kerry won 89% of Gore voters Kerry won 9% of Bush voters
Kerry wins by 51.4 - 47.6%, a 4.85 million
vote margin.
Kerry Vote Share
Sensitivity to Kerry share of returning Gore and Bush
voters
Share
of Gore
Voters
Bush 89%
90% 91%
92% 93% 94%
Voters
10% 51.8%
52.2% 52.6% 52.9%
53.3% 53.7%
9% 51.4%
51.8% 52.2% 52.6%
53.0% 53.3%
8% 51.0%
51.4% 51.8% 52.2%
52.6% 53.0%
7% 50.7%
51.0% 51.4% 51.8% 52.2%
52.6%
6% 50.3%
50.7% 51.1% 51.4%
51.8% 52.2%
5% 49.9%
50.3% 50.7% 51.1%
51.4% 51.8%
4% 49.5%
49.9% 50.3% 50.7%
51.1% 51.4%
3% 49.2%
49.5% 49.9% 50.3%
50.7% 51.1%
Vote
Margin
10% 5.80
6.76 7.72
8.68 9.64
10.60
9% 4.85
5.81 6.77
7.73 8.69 9.65
8% 3.89
4.86 5.82
6.78 7.74 8.70
7% 2.94
3.90 4.87
5.83 6.79 7.75
6% 1.99
2.95 3.91
4.88 5.84
6.80
5% 1.04
2.00 2.96
3.93 4.89 5.85
4% 0.09
1.05 2.01
2.97 3.94 4.90
3% -0.86
0.10 1.06
2.02 2.98
3.95
________________________________________________________
12:22am National Exit Poll
(original weights) What
are the effects of Bush and Gore voter defections on Kerry's national vote? Scenario assumptions: Bush wins 10% of returning Gore voters Kerry wins 10% of returning Bush voters
Kerry wins by 50.6 - 48.4%, a 4.61mm vote
margin.
Kerry Vote Share
Sensitivity to Bush and Gore Defection
Rates
Bush
Share
of
Gore Kerry share of
Bush voters
Voters
6.0% 8.0%
10.0% 12.0% 14.0% 16.0% 6%
50.6% 51.4% 52.2%
53.0% 53.8% 54.7% 8%
49.8% 50.6% 51.4%
52.2% 53.1% 53.9% 10%
49.0% 49.8% 50.6%
51.5% 52.3% 53.1% 12%
48.2% 49.0% 49.9%
50.7% 51.5% 52.3% 14%
47.4% 48.3% 49.1%
49.9% 50.7% 51.5% 16%
46.7% 47.5% 48.3%
49.1% 49.9% 50.8% 18%
45.9% 46.7% 47.5%
48.3% 49.2% 50.0%
Vote
Margin
6%
12.61 10.51 8.40
6.30 4.19 2.09 8%
10.62 8.56
6.51 4.45
2.40 0.34 10%
8.62 6.62
4.61 2.60
0.60 -1.41 12%
6.63 4.67
2.71 0.76
-1.20 -3.16 14%
4.63 2.73
0.82 -1.09 -3.00
-4.90 16%
2.64 0.78 -1.08
-2.94 -4.79 -6.65 18%
0.65 -1.16 -2.97
-4.78 -6.59 -8.40
____________________________________________________________
12:22am National Exit Poll
(feasible adjusted weights) How
does 2000 voter turnout affect the switched vote rate? Scenario: Kerry wins 75% of 3.4m uncounted votes 95% Bush and Gore voter turnout
Result: 6.8% of total votes cast for Kerry were
switched to Bush.
Switched Vote Rate
Sensitivity to Gore and Bush 2000 voter
Turnout
Gore
Turnout
Bush
91% 92%
93% 94%
95% 96% Turnout 91%
7.1% 7.4% 7.6%
7.9% 8.1% 8.3% 92%
6.8% 7.1%
7.3% 7.5%
7.8% 8.0% 93%
6.5% 6.7%
7.0% 7.2%
7.4% 7.7% 94%
6.1% 6.4%
6.6% 6.9%
7.1% 7.4% 95%
5.8% 6.1%
6.3% 6.5% 6.8%
7.0% 96%
5.5% 5.7%
6.0% 6.2%
6.5%
6.7%
________________________________________________________
12:22am National Exit Poll
(feasible adjusted weights) How
does 2000 voter turnout affect the vote discrepancy
probability?
Probability of Kerry Vote
Discrepancy
Sensitivity to Gore and Bush 2000 voter
turnout
Bush
Gore Voter
Turnout
Turnout 95%
96% 97%
98% 99% 100% 95%
5E-14 7E-15 9E-16
1E-16 0 0 96%
8E-13 1E-13 1E-14
2E-15 2E-16 0 97%
9E-12 2E-12 2E-13
3E-14 4E-15 4E-16 98%
1E-10 2E-11 3E-12
5E-13 7E-14 9E-15 99%
1E-09 2E-10 4E-11
6E-12 9E-13 1E-13 100%
9E-09 2E-09 4E-10
7E-11 1E-11 2E-12
________________________________________________________
12:22am National Exit Poll
(feasible adjusted weights) How
does Gore voter turnout and Kerry’s share of DNV2k affect the probability of
the vote discrepancy?
Assume 95% Bush 2000 voter turnout
Probability of Kerry
Vote
Gore
Turnout Kerry Share of
DNV2k
52% 53%
54% 55%
56% 57% 100%
3E-12 2E-13
1E-14 7E-16
0 0 99%
2E-11 2E-12 1E-13
6E-15 2E-16 0 98%
2E-10 1E-11 9E-13
5E-14 2E-15 1E-16 97%
1E-09 9E-11 7E-12
4E-13 2E-14 9E-16 96%
7E-09 6E-10 5E-11
3E-12 2E-13 7E-15 95%
4E-08 4E-09 3E-10
2E-11 1E-12 5E-14 94%
2E-07 2E-08 2E-09
1E-10 7E-12 4E-13 93%
9E-07 1E-07 9E-09
7E-10 5E-11 2E-12 92%
4E-06 5E-07 5E-08
4E-09 3E-10 2E-11 91%
2E-05 2E-06 2E-07
2E-08 1E-09 9E-11
________________________________________________________ |
|
|
|
|
|
|
New Voters
Bush did worse among new voters in 2004 (41%) compared to 2000 (52%).
Final 2000 National Exit Poll
DNV96: Election 2000 voters who did not vote in 1996.
DNV96 comprised 13% of the total 2000 recorded vote.
DNV96 (13%) = first-time voters (9%) + others (4%).
Bush won total DNV96 by 52-44%.
Gore won first-time voters by 52-43%.
Bush won others by 71-26%.
12:22am 2004 National Exit Poll
DNV2k: Election 2004 voters who did not vote in 2000.
DNV2k comprised 17% of the total 2004 recorded vote.
DNV2k (17%) = first-time voters (11%) + others (6%).
Kerry won total DNV2k by 57-41%.
Kerry won first-time voters by 55-43%.
Kerry won others by 61-37%.
Kerry did much better with DNV2k voters in 2004 than Bush in 2000with DNV96 voters.
Bush did much better with DNV96 voters in 2000 than Bush in 2004 with DNV2k voters.
In 2000, Bush won 71% of DNV96 who were not first-time voters, but only 43% of first-timer, a 28% discrepancy.
In 2004, Kerry won 61% of DNV2k who were not first-time voters and 55% of first-timers, a 6% discrepancy.
So how did Kerry lose in 2004?
Final 2000 National Exit Poll
Voted in 1996
Vote
Mix Gore
Bush Buch
Nader Total
Clint
46% 82%
15% 1%
2% 100%
Dole
31% 7%
91% 0%
1% 99%
Perot
6% 27%
64% 1%
7% 99%
Other
2% 26%
52% 1%
15% 94%
DNV96
13% 44% 52%
0% 3%
99%
DNV96:
1stTime
9% 52%
43% 1%
4% 100%
Other
4% 26%
71% 0%
3% 100%
Total
98% 47.8%
46.8% 0.5% 2.3%
97.4%
First-time Voter
Mix Gore
Bush Buch
Nader Total
Yes
9% 52%
43% 1%
4% 100%
No
91% 48%
48% 0%
2% 98%
Total
100% 48.4% 47.6%
0.1% 2.2% 98%
2004 National Exit Poll (12:22am)
Voted in 2000
Mix Kerry
Bush Other
Gore
39% 91%
8% 1%
Bush
41% 10%
90% 0%
Other
3% 71%
21% 8%
DNV2k
17% 57%
41% 2%
DNV2k:
1stTime 11%
55% 43% 2%
Other
6% 61%
37% 2%
Total
100% 51.4% 47.6%
0.97%
_____________________________________________________________________
Breakeven Analysis- 2000 Voter Turnout
in 2004
Kerry won 57% of 2004 voters who did not vote in 2000.
For Bush to win a majority, Gore 2000 voter turnout had to be lower than 73%.
For Bush to win by 3m votes, Gore 2000 voter turnout had to be lower than 64%.
12:22am NEP (13047 respondents)
Voted in 2000
Weight Votes Kerry
Bush
Other
DNV 21.49%
27.02 57%
41% 2%
Gore 38.23%
48.08 91%
8% 1%
Bush 37.83% 47.56
10%
90% 0%
Nader 2.46%
3.09 71%
21%
8%
Total 100%
125.74 52.57% 46.43%
1.01%
Vote
125.74
66.10 58.38 1.27
Kerry margin: 7.72
million
Kerry Share of DNV2k:
Timeline
3:39pm 7:33pm 12:22am 1:25pm
Respondents
8349 11027
13047 13660
Kerry share (%)
62
59
57 54
Assume
95% Bush 2000 voter turnout
For Bush to win: Maximum
Gore Voter Turnout
Majority
Vote 60
68
73 84
Recorded
Vote 50
59
64 77
_____________________________________________________________________
Sensitivity Analysis
Effect of 2000 Voter Turnout and New Voters (DNV2k) on Kerry’s National
Share
Turnout
Bush
95% Respondents
11027
13047
13660
Nader
95% NEP
Update
7:33pm
12:22am Final
2:04pm
Gore
Gore
Kerry Share DNV2k
Turnout
Weight DNV2k 60%
59% 58%
57% 56%
55% 54%
53% 52% 51%
Kerry National Vote Share
95%
38.2% 21.5% 53.2%
53.0% 52.8% 52.6% 52.4%
52.1% 51.9% 51.7%
51.5% 51.3%
94%
37.8% 21.9% 53.1%
52.9% 52.6% 52.4%
52.2% 51.9% 51.7%
51.5% 51.3% 51.1%
93%
37.4% 22.3% 53.0%
52.7% 52.5% 52.3%
52.0% 51.7% 51.5% 51.3%
51.1% 50.8%
92%
37.0% 22.7% 52.8%
52.6% 52.4% 52.2%
51.8% 51.5% 51.3%
51.1% 50.8% 50.6%
91%
36.6% 23.1% 52.7%
52.5% 52.2% 52.0%
51.6% 51.3% 51.1%
50.9% 50.6% 50.4%
90%
36.2% 23.5% 52.6%
52.4% 52.1% 51.9%
51.4% 51.1% 50.9%
50.7% 50.4% 50.2%
89%
35.8% 23.9% 52.5%
52.2% 52.0% 51.7%
51.2% 50.9% 50.7%
50.4% 50.2% 50.0%
88%
35.4% 24.3% 52.3%
52.1% 51.9% 51.6%
51.0% 50.7% 50.5%
50.2% 50.0% 49.7%
87%
35.0% 24.7% 52.2%
52.0% 51.7% 51.5%
50.8% 50.5% 50.3%
50.0% 49.8% 49.5%
86%
34.6% 25.1% 52.1%
51.8% 51.6% 51.3%
50.6% 50.3% 50.1%
49.8% 49.6% 49.3%
85%
34.2% 25.5% 52.0%
51.7% 51.5% 51.2%
50.4% 50.1% 49.9%
49.6% 49.3% 49.1%
84%
33.8% 25.9% 51.8%
51.6% 51.3% 51.1%
50.2% 49.9% 49.6%
49.4% 49.1% 48.9%
83%
33.4% 26.3% 51.7%
51.4% 51.2% 50.9%
50.0% 49.7% 49.4%
49.2% 48.9% 48.6%
82%
33.0% 26.7% 51.6%
51.3% 51.1% 50.8%
49.8% 49.5% 49.2%
49.0% 48.7% 48.4%
81%
32.6% 27.1% 51.5%
51.2% 50.9% 50.6%
49.6% 49.3% 49.0%
48.8% 48.5% 48.2%
Gore
Gore
Kerry Share of DNV2k
Turnout
Weight DNV2k 60%
59% 58%
57% 56%
55% 54%
53% 52% 51%
Margin
(millions)
95%
38.2% 21.5% 9.34
8.80 8.26
7.72 7.18 6.64
6.10 5.56 5.02 4.48
94%
37.8% 21.9% 9.03
8.48 7.93
7.38 6.68
6.13 5.58 5.03
4.48 3.93
93%
37.4% 22.3% 8.71
8.15 7.59
7.03 6.18 5.62
5.06 4.50 3.94 3.38
92%
37.0% 22.7% 8.40
7.83 7.26
6.69 5.68
5.11 4.54 3.97
3.39 2.82
91%
36.6% 23.1% 8.09
7.50 6.92
6.34 5.18 4.60
4.02 3.43 2.85 2.27
90%
36.2% 23.5% 7.77
7.18 6.59
6.00 4.68 4.09
3.49 2.90 2.31 1.72
89%
35.8% 23.9% 7.46
6.86 6.26
5.65 4.18 3.57
2.97 2.37 1.77 1.17
88%
35.4% 24.3% 7.14
6.53 5.92
5.31 3.68
3.06 2.45 1.84
1.23 0.62
87%
35.0% 24.7% 6.83
6.21 5.59
4.97 3.17 2.55
1.93 1.31 0.69 0.07
86%
34.6% 25.1% 6.52
5.89 5.25 4.62
2.67 2.04
1.41 0.78 0.15 -0.48
85%
34.2% 25.5% 6.20
5.56 4.92
4.28 2.17 1.53
0.89 0.25 -0.39 -1.03
84%
33.8% 25.9% 5.89
5.24 4.59
3.93 1.67 1.02
0.37 -0.28 -0.93 -1.58
83%
33.4% 26.3% 5.58
4.91 4.25
3.59 1.17 0.51
-0.15 -0.81 -1.47 -2.14
82%
33.0% 26.7% 5.26
4.59 3.92
3.25 0.67 0.00
-0.67 -1.34 -2.02 -2.69
81%
32.6% 27.1% 4.95
4.27 3.58
2.90 0.17 -0.51 - 1.19 -1.87
-2.56 -3.24
Gore
Gore
Kerry Share of DNV2k
Turnout
Weight DNV2k 60%
59% 58%
57% 56%
55% 54%
53% 52% 51%
Probability of Majority Vote
95%
38.2% 21.5% 100.0%
100.0% 99.9% 99.9%
99.8% 99.6% 99.2% 98.6% 97.7% 96.2%
94%
37.8% 21.9% 100.0%
100.0% 99.9% 99.8%
99.6% 99.3% 98.7% 97.7% 96.2% 94.0%
93%
37.4% 22.3% 100.0%
99.9% 99.9% 99.7%
99.3% 98.7% 97.8%
96.3% 94.1%
91.0%
92%
37.0% 22.7% 100.0%
99.9% 99.8% 99.6%
98.8% 97.9% 96.4%
94.2% 91.1%
86.8%
91%
36.6% 23.1% 99.9% 99.9%
99.7% 99.4% 98.0%
96.6% 94.4% 91.3% 87.1% 81.6%
90%
36.2% 23.5% 99.9%
99.8% 99.6% 99.1%
96.8% 94.7% 91.7%
87.5% 82.0%
75.2%
89%
35.8% 23.9% 99.8%
99.7% 99.3% 98.8%
95.1% 92.2% 88.1%
82.6% 75.8%
67.8%
88%
35.4% 24.3% 99.8%
99.5% 99.1% 98.2%
92.7% 88.8% 83.4%
76.7% 68.6%
59.6%
87%
35.0% 24.7% 99.7%
99.3% 98.7% 97.6%
89.6% 84.4% 77.8%
69.7% 60.6%
50.9%
86%
34.6% 25.1% 99.5%
99.0% 98.1% 96.7%
85.5% 79.1% 71.1%
62.0% 52.2%
42.2%
85%
34.2% 25.5% 99.3%
98.6% 97.5% 95.5%
80.5% 72.7% 63.7%
53.8% 43.6%
33.9%
84%
33.8% 25.9% 99.0%
98.1% 96.6% 94.1%
74.6% 65.6% 55.7%
45.4% 35.4%
26.3%
83%
33.4% 26.3% 98.7%
97.4% 95.4% 92.3%
67.8% 57.9% 47.4%
37.2% 27.7%
19.7%
82%
33.0% 26.7% 98.2%
96.6% 94.0% 90.1%
60.4% 49.8% 39.3%
29.5% 21.0%
14.2%
81%
32.6% 27.1% 97.5%
95.5% 92.2% 87.5%
52.6% 41.8% 31.6%
22.7% 15.4%
9.8%
_____________________________________________________________________
Historical Trend in
First-time Voters
Let’s look at first-time voters in presidential elections since 1984. According to the National Exit Poll, since 1992, the Democrats won a solid majority of first-time voters. Ruy Teixeira wrote about this cumulative build-up of the Democratic base in The Emerging Democratic Majority.
How did Bush win by three million votes after losing the popular vote in 2000 and winning just 41% of new (DNV2k) voters in 2004?
|
Total |
Mix |
Votes |
Kerry |
Votes |
Bush |
Votes |
|
DNV2k |
17% |
20.791 |
57% |
11.85 |
41% |
8.52 |
|
1st-time |
11% |
13.453 |
55% |
7.40 |
43% |
5.78 |
|
Other |
6% |
7.338 |
60.7% |
4.45 |
37.3% |
2.74 |
2004F: 2:04pm Final NEP (13660 respondents)
2004P: 12:22am NEP (13047 respondents)
First-time voters
…… …84 88
92 96 00 2004F 2004P
Dem 38 47 46 54 52 53 55
Rep 61 51 32 34 43 46 43
_____________________________________________________________________
Where did Bush find 16 million new
voters from 2000?
According to the 12:22am National Exit Poll, Bush won 41% of the DNV2k category (first-time and former voters who did not vote in 2000). But Bush needed 60% (15.78m) of DNV2k to obtain his 62.04mm recorded vote. It was quite a feat considering that his job rating was in a steady decline from 90% on Sept.11, 2001 to 48.5% on Election Day 2004. Compare the 60% required by Bush to achieve his 41% NEP share. The 19% discrepancy is 11 times the 1.72% MoE. There’s no need to compute the probability: It’s ZERO.
Given the Recorded Vote totals:
1) TV04 = 122.295m in 2004
2) TV00 = 104.738m in 2000
3) G2k = Gore 2000 = 51.004m
4) B2k = Bush 2000 = 50.459m
5) B04 = Bush 2004 = 62.041m
Assumptions:
1) X = 3.5% of 2000 voters died prior to 2004
2) Y = 95% of 2000 voters living voted in 2004
3) NEP “How Voted in 2000” vote shares
Determine:
Z= Bush share of new (DNV2k) voters required to reach his recorded 62.04m.
Calculation:
Bush 2000 voter turnout in 2004:
BT = 46.26m = B2k *(1-X) * Y = 50.459 * .965 * .95
BW = Bush Weight = BT / TV04 = 37.83%
Gore 2000 voter turnout in 2004:
GT = 46.76m = G2k * (1-X) * Y = 51.004 * .965 * .95
GW = Gore Weight = GT / TV04 = 38.23%
Total number of DNV2k voters in 2004:
DNV2k = 26.28m = TV04 – TV00*(1-X)*Y = 122.295 – 104.738*.965* .95 = 122.295 – 96.02
DNV2k voters required for Bush to get his recorded 62.04m:
Z = 15.78m = Bush 2004 vote – Bush 2000 voter turnout = 62.04 - 46.26
Required Bush share of DNV2k:
P = 60% = Z / T = 15.78/26.28
Sensitivity Analysis
Bush DNV2k Votes Required for Various 2000
Voter Turnout and Mortality Rates
2000 Voter Turnout in 2004
(Y)
Mort
100% 99%
98% 97%
96% 95%
94% 93%
92% 91%
Rate
(X)
Required Bush DNV2k votes in millions
3.50%
13.3 13.8 14.3
14.8 15.3
15.78 16.3
16.8 17.2 17.7
3.00%
13.1 13.6
14.1 14.6
15.1 15.5
16.0 16.5
17.0 17.5
2.50%
12.8 13.3
13.8 14.3
14.8 15.3
15.8 16.3
16.8 17.3
2.00%
12.6 13.1
13.6 14.1
14.6 15.1
15.6 16.1
16.5 17.0
1.50%
12.3 12.8
13.3 13.8
14.3 14.8
15.3 15.8
16.3 16.8
1.00%
12.1 12.6
13.1 13.6
14.1 14.6
15.1 15.6
16.1 16.6
0.50%
11.8 12.3
12.8 13.3
13.8 14.3
14.8 15.4
15.9 16.4
0.00%
11.6 12.1
12.6 13.1
13.6 14.1
14.6 15.1
15.6 16.1
Required Bush DNV2k Vote Share (P)
3.50%
62.9% 62.2% 61.6%
61.1% 60.5% 60.0%
59.6% 59.2% 58.8% 58.5%
3.00%
63.3% 62.6% 61.9%
61.3% 60.8% 60.3%
59.8% 59.4% 59.0% 58.6%
2.50%
63.7% 62.9% 62.2%
61.6% 61.1% 60.5%
60.1% 59.6% 59.2% 58.8%
2.00%
64.1% 63.3% 62.6%
61.9% 61.3% 60.8%
60.3% 59.8% 59.4% 59.0%
1.50%
64.5% 63.7% 62.9%
62.2% 61.6% 61.0%
60.5% 60.0% 59.6% 59.2%
1.00%
65.0% 64.1% 63.3%
62.6% 61.9% 61.3%
60.8% 60.3% 59.8% 59.4%
0.50%
65.5% 64.5% 63.7%
62.9% 62.2% 61.6%
61.0% 60.5% 60.0% 59.6%
0.00%
66.0% 65.0% 64.1%
63.3% 62.5% 61.9%
61.3% 60.7% 60.2% 59.8%
_____________________________________________________________________
The Bush Urban Legend
Election
2004:The Urban Legend exposed the implausible result that Bush's urban
share (in Democratic strongholds) would INCREASE by 9% while his small town/rural
share (in Republican strongholds) would DECLINE by 3%. The following
additional analysis of the NEP Location demographic compares the preliminary
7:33pm National Exit Poll update (11027 respondents) and the 2:04pm Final NEP.
As usual, the Final NEP was forced to match the
vote count by inflating Bush urban vote shares to implausible levels (Table 1).
Kerry won the 7:33pm update of the Location-size category by 50.5-47.6% (Table 4). But a prior analysis of the 12:22am “Voted 2000” demographic vote shares using feasible weights determined that he won by 52.6-46.4% (Table 7). One objective of the following analysis was to determine a likely combination of vote shares for each of the five location categories in order to match the True vote. Sensitivity analyses tables display the effects of various urban and small town/rural vote share scenarios on Kerry’s national share.
Winning margins by location-size follow (with changes from the 2000 Final NEP):
Final 2000 NEP margin (Table 1):
Gore urban: 7.8m
Bush suburban: 0.9m
Bush small town/rural: 6.4m
7:33pm 2004 NEP margin (Table 4)
Kerry urban: 5.9m (-1.9m)
Kerry suburban: 0.0m (+0.9m)
Bush small town/rural: 2.3m (-4.1m)
Final 2004 NEP margin (Table 2):
Kerry urban: 3.5m (-4.3m)
Bush suburban: 2.8m (+1.9m)
Bush small town/rural: 3.9m (-2.5m)
2004 True Vote margin (Table 5):
Kerry urban: 8.2m (+0.4m)
Kerry suburban: 1.7m (+2.6m)
Bush small town/rural: 2.1m (-4.3m)
2000/2004 Bush NEP vote shares
Preliminary and Final NEP vote shares by community size
Percentage vote changes from 2000
Table
1
2000 Final NEP (matched to recorded vote)
Vote
Share
Votes (mil.)
Votes
Mix Gore
Bush Nader Gore
Bush Other Margin
Big Cities
9.4
9% 71%
26% 3%
6.7 2.5
0.3 4.24
Small Cities
21.0 20%
57% 40%
3% 11.9
8.4 0.6 3.56
Suburbs
45.0
43% 47%
49% 4%
21.2 22.1
1.8 -0.90
Small
Towns 5.2
5% 38% 59%
3% 2.0
3.1 0.2 -1.10
Rural
Areas 24.1
23% 37%
59% 4%
8.9 14.2
1.0 -5.30
Total
104.8
100% 48.4% 47.9%
3.7% 50.7
50.2 3.8 0.50
Urban
30.4
29% 61%
36% 3%
18.6 10.8
0.9 7.81
Suburbs
45.0 43%
47% 49%
4% 21.2
22.1 1.8 -0.90
SmTwn/Rural
29.3 28%
37% 59%
4% 10.9 17.3
1.1 -6.40
Total
104.8
100% 48.4% 47.9%
3.7% 50.7
50.2 3.8 0.50
____________________________________________________________________
Table
2
2004 Final NEP (matched to recorded
vote)
11/03 at
2:04pm
Vote
Share Votes
(mil.)
Votes
Mix Kerry
Bush Other Kerry
Bush Other Margin
Big Cities
15.9
13% 61%
39% 0%
9.7 6.2
0.0 3.5
Small Cities
22.0 18%
49% 49%
2% 10.8
10.8 0.4 0.0
Suburbs
55.0
45% 47%
52% 1%
25.9 28.6
0.6 -2.8
Small
Towns 9.8
8% 48%
50% 2%
4.7 4.9
0.2 -0.2
Rural
Areas 19.6
16% 40%
59% 1%
7.8 11.5
0.2 -3.7
Total
122.3
100% 48.1% 50.7%
1.1% 58.9
62.0 1.4 -3.2
Urban
37.9 31%
54% 45%
1.2% 20.5
17.0 0.4 3.5
Suburbs
55.0
45% 47%
52% 1.0%
25.9 28.6
0.6 -2.8
SmTwn/Rural
29.4
24% 43%
56% 1.3%
12.5 16.4
0.4 -3.9
Total
122.3
100% 48.1% 50.7%
1.1% 58.9
62.0 1.4 -3.2
____________________________________________________________________
Table
3
Changes in NEP from 2000 Final to 2004 Final
Vote
Share
Votes
(mil.)
Votes
Mix Kerry
Bush Other Kerry
Bush Other Margin
Big Cities
6.5
4% -10%
13% -3%
3.0 3.7
-0.3 -0.7>
Small Cities
1.1 -2%
-8% 9%&nbssp;
-1% -1.2&nnbsp; 2.4
-0.2 -3.6>
Suburbs
10.0
2% 0%
3% -3%
4.7 6.6
-1.3 -1.9>
Small
Towns 4.5
3% 10%
-9% -1%&nbbsp;
2.7 1.8
0.0 0.9
Rural
Areas -4.5
-7% 3%&nbssp;
0% -3%
-1.1 -2.7 &
-0.8 1.6<
Change
17.6
0% -5%
16% -11%
8.2 11.8
-2.5 -3.7>
Urban
7.5
2% -7%
9% -2%
1.8 6.2 -0.5
-4.3
Suburb
10.0
2% 0%
3% -3%
4.7 6.6
-1.3 -1.9>
SmTwn/Rural
0.0
-4% 5%&nbssp;
-3% -2%&nbbsp;
1.6 -0.9
-0.7 2.5<
Change
17.6
0% -2%
9% -7%
8.2 11.8
-2.5 -3.7>
____________________________________________________________________
Table
4
2004 NEP (11027
respondents)
11/02 at
7:33pm
Vote
Share
Votes
(mil.)
Votes
Mix Kerry
Bush Other Kerry
Bush Other Margin
Big Cities
15.9
13% 64%
35% 1%
10.2 5.6
0.2 4.6
Small Cities
22.0 18%
52% 46%
2% 11.4
10.1 0.4 1.3
Suburbs
55.0
45% 49%
49% 2%
27.0 27.0
1.1 0.0
Small Towns
9.8 8%
51% 47%
2% 5.0
4.6 0.2 0.4
Rural
Areas 19.6
16% 42%
56% 2%
8.2 11.0
0.4 -2.7
Total
122.3
100% 50.5% 47.6%
1.9% 61.8
58.2 2.3 3.6
Votes
Mix Kerry
Bush Other Kerry
Bush Other Margin
Urban
37.9
31% 57%
41% 2%
21.6 15.7
0.6 5.9
Suburb
55.0
45% 49%
49% 2%
27.0 27.0
1.1 0.0
SmTwn/Rural
29.4
24% 45%
53% 2%
13.2 15.6
0.6 -2.3
Total
122.3
100% 50.5% 47.6%
1.9% 61.8
58.2 2.3 3.6
Sensitivity Analysis
Kerry Urban
Share
Sm Town
54% 55%
56% 57%
58% 59%
60%
Rural
Kerry National Share
41% 48.6% 48.9%
49.3% 49.6% 49.9%
50.2% 50.5%
42% 48.9%
49.2% 49.5% 49.8%
50.1% 50.4% 50.7%
43% 49.1%
49.4% 49.7% 50.0%
50.4% 50.7% 51.0%
44% 49.4%
49.7% 50.0% 50.3%
50.6% 50.9% 51.2%
45% 49.6%
49.9% 50.2% 50.5%
50.8% 51.1% 51.5%
46% 49.8%
50.1% 50.5% 50.8%
51.1% 51.4% 51.7%
____________________________________________________________________
Table
5
2004 NEP
(adjusted)
Size of
Community
Vote shares adjusted to match True Vote
(Table 7)
125.74m total votes cast (Census)
Vote
Share
Votes
(mil.)
Votes
Mix Kerry
Bush Other Kerry
Bush Other Margin
Big Cities
16.35
13% 67%
32% 1%
10.95 5.23
0.16 5.72
Small Cities
22.63 18%
55% 44%
1% 12.45
9.96 0.23 2.49
Suburbs
56.58
45% 51%
48% 1%
28.86 27.16 0.57
1.70
Towns
10.06
8% 52%
47% 1%
5.23 4.73
0.10 0.50
Rural
20.12
16% 43%
56% 1%
8.65 11.27
0.20 -2.62
Total
125.74
100% 52.6% 46.4%
1% 66.14
58.34 1.26 7.80
Urban
38.98 31%
60% 39%
1% 23.40
15.19 0.39 8.21
Suburbs
56.58
45% 51%
48% 1%
28.86 27.16 0.57
1.70
SmTwn/Rural
30.18
24% 46%
53% 1%
13.88 16.00 0.30
-2.11
Total
125.74
100% 52.6% 46.4%
1.0% 66.14 58.34
1.26 7.80
Sensitivity
Analysis
Kerry
share of
Urban
Small
Town
56% 58%
60% 62% 64%
Rural Kerry National
Share
48%
51.8% 52.5% 53.1%
53.7% 54.3%
47% 51.6%
52.2% 52.8% 53.5% 54.1%
46% 51.4%
52.0% 52.6% 53.2% 53.8%
45% 51.1% 51.7%
52.4% 53.0% 53.6%
44% 50.9%
51.5% 52.1% 52.7% 53.4%
____________________________________________________________________
Table
6
Vote Share Summary
2000 Final 2004
Prelim 2004
Final 2004
True
Gore Bush Kerry
Bush Kerry
Bush Kerry Bush
Urban
61% 36%
57% 41%
54% 45%
60% 39%
Suburb
47% 49%
49% 49%
47% 52%
51% 48%
Rural
37% 59%
45% 53%
43% 56%
46% 53%
Total
48.4% 47.9% 50.5%
47.6% 48.1% 50.7%
52.6% 46.4%
____________________________________________________________________
Table
7
12:22am NEP True
Vote
Voted
2000
Assumptions:
125.74m votes cast (2004 Census)
Election 2000 voters:
95% Turnout in 2004
0.87% annual
mortality
Vote
Share
Votes
(mil.)
Votes Mix
Kerry Bush Other
Kerry Bush Other
DNV
27.02 21.5%
57% 41%
2% 15.40
11.08 0.54
Gore
48.08 38.2%
91% 8%
1% 43.75
3.85 0.48
Bush
47.56 37.8%
10% 90%
0% 4.76
42.80 0.00
Other
3.08 2.5%
71% 21%
8% 2.19
0.65 0.25
Total
125.74 100% 52.6%
46.4% 1.01% 66.10
58.38 1.27
____________________________________________________________________
WPE-Adjusted Location-size Vote Shares
This is a table of Exit Poll WPE (Within
Precinct Error) by Size of Location. It was provided by pollsters
Edison-Mitofsky in their Jan. 2005 report. The largest discrepancies (WPE) were
in Urban and Suburban locations. Note the match between the 7:33pm NEP update
and the WPE-adjusted Final. The Final NEP was forced to match the recorded vote
(see the “Bush Urban Legend”)
Location
WPE
Size
Weight Mean Median
Abs 1250
precincts
Big City
13% 7.9
5.9 12.1
105
Small City
18% 8.5
7.7 14.3
236
Suburbs
45% 8.1 7.9
14.3
487
Small Town
8% 4.9
5.0 12.8
126
Rural Areas
16% 3.6
3.6 13.4
296
TOTAL
7.17
6.68 13.75
______________________________________________________________
Location-size NEP timeline
7:33pm (11019 respondents)
Location
Votes Mix Kerry
Bush Other Kerry
Bush Other Margin
Big
City 15.9
13% 64%
35% 1%
10.2 5.6 0.2
4.6
Small City
23.2 19% 52%
46% 2%
12.1 10.7 0.5 1.4
Suburbs
53.8
44% 49%
49% 2%
26.4 26.4 1.1 0.0
Small Town
9.8 8%
51% 47%
2% 5.0
4.6 0.2
0.4
Rural
19.6
16% 42%
56% 2%
8.2 11.0 0.4
-2.7
TOTAL
122.3 100%
50.6% 47.6% 1.9%
61.8 58.2 2.3
3.7
2PM Final (13660 respondents)
(Forced to match the recorded vote)
Size
Votes Weight Kerry Bush
Other Kerry Bush Other
Margin
Big
City 15.9
13% 61%
39% 0%
9.7 6.2 0.0
3.5
Small City
22.0 18% 49%
49% 2%
10.8 10.8 0.4 0.0
Suburbs
55.0
45% 47%
52% 1%
25.9 28.6 0.6
-2.8 ;
Small Town
9.8 8%
48% 50%
2% 4.7
4.9 0.2
-0.2 ;
Rural
19.6 16% 40%
59% 1%
7.8 11.5 0.2
-3.7 ;
TOTAL
122.3 100% 48.2% 50.7%
1.1% 58.9 62.0
1.4 -3.2
Final WPE-adjusted
Location
Votes Mix Kerry
Bush Other Kerry
Bush Other Margin
Big
City 15.9
13% 64.95% 35.05%
0% 10.3 5.6
0.0 4.6
Small City
22.0 18% 53.25% 44.75%
2% 11.7 9.9
0.4 1.9
Suburbs
55.0
45% 51.05% 47.95%
1% 28.1 26.4
0.6 1.7
Small Town
9.8 8% 50.45%
47.55% 2% 4.9
4.7 0.2 0.3
Rural
19.6
16% 41.80% 57.20%
1% 8.2 11.2
0.2 -3.0
TOTAL
122.3 100%
51.7% 47.2% 1.1%
63.3 57.7 1.4
5.6
______________________________________________________________
Location-size vote share WPE
adjustments
Big Cities: WPE = 7.9%
Kerry = 61%
Bush = 39%
Kerry adjusted: 64.95% = 61+.5* WPE = 61+ 3.95
Bush adjusted: 35.05% = 39-.5* WPE = 39- 3.95
Small Cities: WPE = 8.5%
Kerry = 49%
Bush = 49%
Kerry adjusted: 53.25% = 49+.5* WPE = 49+ 4.25
Bush adjusted: 44.75% = 39-.5* WPE = 49- 4.25
Suburbs: WPE = 8.1%
Kerry = 47%
Bush = 52%
Kerry adjusted: 51.05% = 47+.5* WPE = 47+ 4.05
Bush adjusted: 47.95% = 52-.5* WPE = 52- 4.05
Small Towns: WPE = 4.9%
Kerry = 48%
Bush = 50%
Kerry adjusted: 50.45 = 48+.5* WPE = 48+ 2.45
Bush adjusted: 47.55 = 50-.5* WPE = 50- 2.45
Rural: WPE = 3.6%
Kerry = 40%
Bush = 59%
Kerry adjusted: 41.8 = 40+.5* WPE = 40+ 1.8
Bush adjusted: 57.2 = 59-.5* WPE = 59- 1.8
_____________________________________________________________________
Exit Poll Location-size
Response Optimizer
The True Vote: Kerry 52.15-Bush 47.85% (two-party)
Total True Vote: Kerry 51.62-Bush 47.37%
The Location optimizer matched and confirmed the following models:
(2-party vote shares)
1- Precinct Response Optimizer (5 partisanship groupings)
Kerry 52.15- Bush 47.85%
2- 7:33pm NEP: Location-size
Kerry 51.53- Bush 48.47%
3- Final NEP: Location-size (WPE-adjusted vote shares)
Kerry 52.22- Bush 48.78%
Given:
1- Recorded vote: Bush 50.73- Kerry 48.27%
(2-party: Bush 51.24%- Kerry 48.76%)
2- Location response rates
3- Location "Within Precinct Error" (WPE)
Calculate:
Vote share (aggregate and location)
Assume Census 125.74m total votes cast
WPE
Location Mix
Votes Mean Median Precinct Response
Big
City 13%
16.35 7.9 5.9
105 0.52
Small City
18% 22.63 8.5
7.7 236 0.54
Suburbs
45%
56.58 8.1 7.9
487 0.53
Small Town 8%
10.06 4.9 5.0
126 0.57
Rural
16%
20.12 3.6 3.6
296 0.55
TOTAL
125.74
7.2 6.7 1250 0.54
TRUE VOTE
Kerry
Bush
2-party
52.15%
47.85%
Total
51.62%
47.37%
Vote
64.91
59.57
%Deviation
-3.39%
3.39%
2-party
-6.50%
7.08%
Vote
Deviation
-5.88 p;
2.47
%Deviation
9.06%
-4.15% &nbssp;
PROBABILITY of 3.39% discrepancy: 1 in
65
TRILLION
WEIGHTED AVERAGE
(AGGREGATE)
Response rate:
53.98%
PERCENT OF REFUSERS REQUIRED TO MATCH
OFFICIAL VOTE
Kerry
44.83%
Bush
55.17%
Rural SmTown Suburb SmCity BigCity
Prcts
296 126
487 236
105
23.7% 10.1% 39.0% 18.9%
8.4%
Votes 20.1
10.1 56.6 22.6
16.4
16% 8%
45% 18%
13%
Kerry NEP share
733pm 42%
51% 49%
52% 64%
Final
40% 48% 47%
49% 61%
TRUE
40% 50% 49%
59% 73%
.......RANGE
CONSTRAINTS
KERRY
WIN%
Min
35% 45%
45% 45%
60%
Max
55% 55%
55% 60% 100%
RESPONSE
Min
55% 57%
53% 54%
52%
Max
55% 57%
53% 54%
52%
ALPHA
(K/B)
Min
0.50 0.50 0.50
0.50 0.50
Max
3.00 3.00 3.00
3.00 3.00
WPE
Min
-3.6% -4.9% -8.11% -8.5%
-7.9%
Max
-3.6% -4.9% -8.11% -8.5%
-7.9%
E-M
-3.6% -4.9% -8.11% -8.5%
-7.9%
OPTIMIZER
SUMMARY
........True
Count
Diff True Count Diff
Kerry 52.15% 48.76% -3.39% 64.91
60.69 -4.21
Bush 47.85%
51.24% 3.39% 59.57 63.78 4.21
Diff
4.29% -2.48% -6.77%
5.34 -3.09 -8.43
..... Rural
SmTown Suburb SmCit BigCit Total
Prcts
296 126
487 236
105 1250
2-pty 29.48
12.55 48.50 23.50 10.46 124.5
Pct
23.7% 10.1% 39.0% 18.9%
8.4% 100%
RESP 55.0%
57.0% 53.0% 54.0% 52.0% 53.98%
ALPHA
K/B
0.792 0.800 0.840 0.835
0.800 0.820
K/50B 39.6
40.0 42.0 41.8
40.0 41.0
VOTE
Kerry 12.69
6.10 21.82 11.75
8.34 60.70
Pct
43.0% 48.6% 45.0% 50.0%
79.7% 48.76%
Bush 16.79
6.45 26.67 11.75
2.12 63.78
Pct
57.0% 51.4% 55.0% 50.0%
20.3% 51.24%
RESPONDERS
Kerry 13.22
6.41 23.79 12.75
8.75 64.91
Pct
44.8% 51.1% 49.1% 54.3%
83.7% 52.15%
Bush 16.26
6.14 24.71 10.75
1.71 59.57
Pct
55.2% 48.9% 51.0% 45.8%
16.3% 47.85%
REFUSERS (Required to match the recorded
vote)
Kerry 40.8%
45.4% 40.4% 45.0% 75.4% 44.83%
Bush 59.2%
54.6% 59.6% 55.0% 24.6% 55.17%
VOTE
DEVIATION
Kerry -0.53
-0.31 -1.96 -1.000 -0.41 -4.21
Pct
-4.0% -4.8% -8.33% -7.8%
-4.7% -6.49%
WPE
Calc -3.6%
-4.9% -8.1% -8.55% -7.9% -6.77%
E-M
-3.6% -4.9% -8.11% -8.5%
-7.9% -6.77%
_____________________________________________________________________
The Bush 48.5% average approval rating on Election Day is a key indicator of fraud, based on the following correlation analysis of pre-election national polls and the mysterious divergence of the National Exit Poll approval weights from the average.
There was a near-perfect 0.87 statistical correlation between Bush monthly approval and the national pre-election poll average.
Poll
Jan Feb
Mar April
May June
July Aug
Sept Oct
Mean
Kerry
40.78 47.80 47.58
46.31 46.86 46.64
47.47 47.40 44.33 47.17
Bush
51.56 46.10 44.83
45.62 44.71 45.71
45.20 45.40 48.28 46.89
Approval 54.4 49.5
48.8 48.6
45.2 47.0
47.8 48.0
49.1 48.5
Poll/Appr 0.95
0.93
0.92 0.94
0.99 0.97
0.95 0.95
0.98 0.97
2004
Bush ratings
Date
Nwk Fox
CNN Pew
Harris CBS
ABC Time
NBC AP
Zogby Mean
Jan-04
50 58
60 56
na 50
58 54
54 56
49 54.5
Feb-04
48 48
51 48
51 50 50
54 na
47
na 49.7
Mar-04
48 48
49 46
na 51
50 na
50 48 na
48.8
Apr-04
49 50
52 48
48 46 51
49 na
48
47 48.8
May-04
42 48
47 44
na 41 47
46 47
48
42 45.2
Jun-04
na 48
49 48
50 42 47
na 45
48
46 47.0
Jul-04
48 47
47 46
na 45 50
50 48 50
49 48.0
Aug-04
45 51
51 46
48 46 50
51 47
49
44 48.0
Sep-04
48 50
52 46
45 48 50
53 47
54
47 49.1
Oct-04
46 49
46 44
na 49
53 53
49 47
49 48.5
National Exit Poll Approval Weightings
This analysis shows that the final exit polls were manipulated to match a fraudulent vote count through the use of inflated Bush approval weightings. "Voted 2000" weights have already been proven to be mathematically impossible. The "Urban Legend" myth has been exposed by the totally implausible growth of Bush urban and suburban vote shares from 2000.
Bush's average approval rating was 48.5% on Election Day (based on 11 national polls). But Edison-Mitofsky used 53% for the Bush approval weighting in both the Final National Exit and the Florida Exit polls. In the 7:33pm NEP update, Bush approval was 51%. Bush vote shares were inflated in the Final – just like the “Voted 2000” and “Location-size” demographics.
Adjusting Bush approval to his actual 48.5% national average resulted in the following:
In the Florida Exit Poll, Kerry's share increased from 49.4% to 53.3%.
In the National Exit Poll, posted at 7:33pm on Nov.2, Kerry's share increased from 51.2% to 53.2%.
In the Final National Exit Poll, posted at 1:25pm on Nov.3, Kerry's share increased from 48.5% to 52.3%.
Note: Value in parenthesis refers to the number of respondents to the Bush approval question.
(2,409 respondents)
Bush approval:
53%
Approval Weight
KERRY
BUSH Other
Strong
35.0
4
96 0
Approve
18.0
17
82 1
Disapprove 12.0
84
13 3
Strong
35.0
98
1 1
Total
100.0 48.8
50.3 0.9
Approve
53.0
9 91 0
Disapprove 47.0
95
4 1
Total
100.0
49.4 50.1 0.5
Bush approval:
48.5%
Approval Weight
KERRY
BUSH Other
Strong
30.5
4
96 0
Approve
18.0
17
82 1
Disapprove 14.0
84
13 3
Strong
37.5
98
1 1
Total
100.0
52.8 46.2 1.0
Approve
48.5
9
91 0
Disapprove
51.5
95
4 1
Total
100.0
53.3 46.2 0.5
(5666 respondents)
Bush approval: 51%
Approval
Weight KERRY
BUSH Other
Strong
32
7
93 0
Approve
19
17
80 3
Disapprove 12
81
16 3
Strong
37
97
2 1
Total
100%
51.1%
47.6% 1.3
Approve
51
11
88
1
Disapprove 49
93
5
2
Total
100%
51.2% 47.3%
1.5%
Bush approval: 48.5%
Approval
Weight KERRY
BUSH
Other
Strong
30.5%
7% 93%
0
Approve
18
17
80
3
Disapprove 14
81 16
3
Strong
37.5
97
2
1
Total
100% 52.9%
45.8%
1.3%
Approve
48.5
11 88
1
Disapprove
51.5
93
5
2
Total
100%
53.2% 45.3%
1.5%
(6961 respondents)
Bush approval: 53%
Approval
Weight KERRY
BUSH Other
Strong
33%
5%
94% 1%
Approve
20
15
83
2
Disapprove 12
80
18
2
Strong
35
97
2
1
Total
100%
48.2% 50.5%
1.3%
Approve
53
9
90
1
Disapprove 47
93
6
1
Total
100%
48.5% 50.5% 1%
Bush approval: 48.5%
Approval
Weight KERRY
BUSH Other
Strong
30.5%
5%
94% 1%
Approve
18
15
83
2
Disapprove 14
80
18 2
Strong
37.5
97
2
1
Total
100%
51.8%
46.9% 1.3%
Approve
48.5
9
90
1
Disapprove
51.5
93
6
1
Total
100%
52.3%
46.7% 1%
_______________________________________________________________
One month prior to the 2004 election, state and national pre-election polls indicated that the race was a virtual tie. But according to the Final National Exit Poll "When Decided" category, Bush won the vote of those who decided one month prior to the election by 53-46% and was a 51.2-47.5% overall winner. On the other hand, the 12:22am NEP showed a virtual 50-50 tie among those who decided a month before and Kerry led by 51.2-47.9%. No surprise there. Like all demographic categories, the weights and vote shares were adjusted to force a match to the recorded vote.
According to the Final NEP, Kerry won the 9% who decided within 3 days of the election by 53-44% ( 55-45% of the two-party vote). The 12:22am update had it at 53-40% (57-43% two-party). Pollsters Zogby and Harris estimated that Kerry won 75% of the late undecided vote. Therefore his True Vote was probably better than the 51.2% indicated by the 12:22am NEP “When Decided” cross-tabs.
The True Vote (Kerry 52.5-Bush 46.5%) was previously calculated based on the "Voted 2000" category using adjusted, feasible weights applied to 12:22am NEP vote shares (the Final NEP Bush/Gore 43/37% "Voted 2000" weights were mathematically impossible). The adjusted Bush/Gore weights were the ratio of a) 95% turnout of Bush and Gore 2000 voters (assuming 3.5% mortality) to b) the 2004 total votes cast. Therefore, the 12:22am NEP "When Decided" Kerry vote shares were increased (see the True Vote cross-tab).
Science works by assuming that the explanation that best fits the data is correct - and is tested against new data, which either strengthens those assumptions or causes them to be rejected in favor of a better explanation. The Final Exit Poll “When Decided” weights and vote shares do not agree with historical polling statistics and the conclusions of two well-respected pollsters with a combined 70 years experience. Therefore, we must conclude that the 12:22am NEP
is close to the True Vote. The Final NEP is once again exposed for forcing a match to a fraudulent recorded vote through the use of bogus weights and vote shares.
This is what the Gallup poll said
about undecided voters: “In the final USA TODAY/CNN/GALLUP poll before
the election, President Bush held a 49-47 edge over Sen. John Kerry when the
undecided voters were not allocated to a particular candidate. When Gallup, using a statistical model that
assumes that 9 of 10 of those voters would support Kerry, allocated the
voters, the poll ended as a dead heat with each candidate garnering 49%. The Gallup allocation formula is based on
analyses of previous presidential races involving an incumbent”.
This is what Zogby said a few days before the election:
“The key reason why I still think that Kerry will win… That traditionally, the undecideds break for the challenger against the incumbent on the basis of the fact, simply, that the voters already know the incumbent, and it's a referendum on the incumbent. And if the incumbent is polling, generally, under 50 percent and leading by less than 10, historically, incumbents have lost 7 out of 10 times. In this instance you have a tie, a President who is not going over 48, undecideds who tell us by small percentages that the President deserves to be reelected. And in essence, it gives all the appearances that the undecideds -- the most important people in the world today -- have made up their minds about President Bush. The only question left is: Can they vote for John Kerry? If it's a good turnout, look for a Kerry victory. If it's a lower turnout, it means that the President has succeeded in raising questions about John Kerry's fitness”.
Note: Final Zogby Election Day polling had Kerry winning by 50-47%, with 311 electoral votes, indicating that 75% of undecided voters broke for Kerry. It was not a good turnout; it was a great turnout. Officially, 122 million voted in 2004, compared to 105m in 2000, a net increase of 17m. But a closer analysis indicates that there must have been close to 30 million new voters. Here’s why: Approximately five million 2000 voters died prior to 2004. Assuming 95% turnout, another five million did not vote, so only 95m former 2000 voters returned to the polls in 2004. In addition, approximately three million ballots in 2004 were uncounted (a total of 125m were cast). Preliminary National Exit Polls indicated that Kerry won 57-62% of new voters, or 6 million more than Bush.
This is what Harris Interactive said about undecided voters on Election Day:
“The final Harris Polls show Senator John Kerry making modest gains at the very end of the campaign in an election that is still too close to call using telephone methods of polling. At the same time, the final Harris Internet-based poll suggests that Kerry will win the White House today in a narrow victory. Harris Interactive’s final online survey of 5,508 likely voters shows a three-point lead for Senator Kerry. The final Harris Interactive telephone survey of 1,509 likely voters shows a one-point lead for President Bush. Both surveys are based on interviews conducted between October 29, 2004 and November 1, 2004. The telephone survey is consistent with most of the other telephone polls, which show the race virtually tied.
If this trend is real, then Kerry may actually do better than these numbers suggest. In the past, presidential challengers tend to do better against an incumbent President among the undecided voters during the last three days of the election, and that appears to be the case here. The reason: undecided voters are more often voters who dislike the President but do not know the challenger well enough to make a decision. When they decide, they frequently split 2:1 to 4:1 for the challenger.”
This is what Frank Newport, Editor in Chief of the Gallup Poll, said on Election Day:
Is the presidential race
still too close to call?
Yes. No matter how you look at the data, the two major-party candidates are neck and neck. Gallup's final Oct. 29-31 CNN/USA Today/Gallup poll shows that if all registered voters actually turn out (which is not likely to happen, of course), John Kerry wins over George W. Bush by two points. Among likely voters, including our estimate of what the remaining undecided voters will do on Election Day, the race is dead even at 49% for each candidate.
Analyzing the data in other ways, such as modifying likely voter assumptions and changing turnout estimates, doesn't make a substantial difference in the election predictions. The support for both candidates is basically in the upper-40% range, and the final popular vote may well depend on which side is best able to mobilize its voters to go to the polls.
How does Gallup decide how to
"allocate" undecided voters?
The allocation procedure is a Gallup tradition, and represents Gallup scientists' best estimate of what the final popular vote will be on Election Day.Here's how it works. The unallocated numbers in the pool of likely voters (that is, the percentages of likely voters supporting Bush and Kerry, not including undecided voters) are 49% for Bush and 47% for Kerry. We assume, based on an analysis of previous presidential and other elections, that there is a high probability that the challenger (in an incumbent race) will receive a higher percentage of the popular vote than he did in the last pre-election poll, while there is a high probability that the incumbent will maintain his share of the vote without any increase. This has been dubbed the "challenger rule." There are various explanations for why this may occur, including the theory that any voter who maintains that he or she is undecided about voting for a well-known incumbent this late in the game is probably leaning toward voting for the challenger.
This persistent historical
pattern is the basis for Gallup's decision to allocate the 3% undecided vote to
Kerry and Nader/other, making the
final estimate 49% Bush, 49% Kerry, and 2% Nader/other.
Certainly I believe that Florida is the place to start. With 27 electoral votes, Florida is the biggest prize of all the states that are still considered to be in play.
Our final poll in Florida gives Kerry the edge, although not outside the margin of error.
How might the president's job
approval rating influence the outcome of the election?
A president's job approval rating is an important indicator of re-election probabilities. But like so much else in this election, this measure isn't giving us a great deal of direction right now. Bush's job approval has slipped to 48% among national adults and is thus below the symbolically important 50% point. If we take that 50% line seriously, then Bush is in a less-than-auspicious position. No president since Harry Truman has won re-election with a job approval rating below 50%.
But the last two presidents who lost (George H. W. Bush and Jimmy Carter) had job approval ratings much worse than George W. Bush's 48%. He is clearly not as bad off as they were. On the other hand, the winners all had job approval ratings well above 50%. Bush is in a gray zone when it comes to his job approval rating.
What is the impact of turnout
among younger voters?
We've heard a lot about the impact of younger voters this year. The data indeed show that Kerry does better among younger voters -- that is, those under age 30. Among all national adults in that age group, Kerry wins by a 59% to 34% margin.
________________________________________________________________________________________________
National Exit Poll
When Decided
Composite NEP (12:22am)
Decided Weight Kerry Bush
Other
Today 6%
53% 40% 7%
3 days 3% 53%
41% 6%
7 days 2% 48%
50% 2%
30 days 10% 60%
38% 2%
Over 30 79% 50%
50% 0%
Total 100% 51.2%
47.9% 0.8%
Votes 122.3 62.6 58.6
1.0
Final NEP
Decided Weight Kerry Bush Other
Today 5%
52% 45% 3%
3 days 4%
55% 42% 3%
7 days 2%
48% 51% 1%
30 days 0% 54%
44% 2%
Over 30 79% 46%
53% 1%
Total 100% 47.5% 51.2%
1.3%
Votes 122.3 58.1 62.6
1.6
True Vote
Decided Votes Weight Kerry Bush Other
Today 7.54 6%
66% 33% 1%
3 days 3.77 3%
66% 33% 1%
7 days 2.51 2%
50% 49% 1%
30 days 12.57 10% 61% 38% 1%
Over 30 99.33 79% 50% 49% 1%
Total Share 100% 52.5% 46.5% 1.0%
Votes (census) 125.7 66.1 58.4 1.3
Sensitivity Analysis
Voted for Kerry
Over ----------------Decided
Today------------------
30days 52.0% 53.0% 54.0% 55.0% 56.0% 57.0% 58.0%
Kerry national vote share
46% 48.5% 48.6% 48.7% 48.7% 48.8% 48.8%
48.9%
47% 49.3% 49.4% 49.5% 49.5% 49.6% 49.6%
49.7%
48% 50.1% 50.2% 50.2% 50.3% 50.4% 50.4%
50.5%
49% 50.9% 51.0% 51.0% 51.1% 51.2% 51.2%
51.3%
50% 51.7% 51.8% 51.8% 51.9% 51.9% 52.0%
52.1%
51% 52.5% 52.6% 52.6% 52.7% 52.7% 52.8%
52.9%
52% 53.3% 53.3% 53.4% 53.5% 53.5% 53.6%
53.6%
53% 54.1% 54.1% 54.2% 54.3% 54.3% 54.4%
54.4%
_______________________________________________________________
National Exit Poll
Voted 2000
Composite NEP (12:22am)
Weight Kerry Bush Other
New 11% 55% 43% 2%
Other 6% 61%
37% 2%
DNV 17% 57% 41% 2%
Gore 39% 91% 8% 1%
Bush 41% 10% 90% 0%
Other 3%
64% 17% 19%
Share 100% 51.2% 47.5% 1.3%
Votes 122.3 62.6 58.1 1.6
Final NEP
Weight Kerry Bush Other
DNV 17% 54% 45% 1%
Gore 37% 90% 10% 0%
Bush 43% 9% 91% 0%
Other 3% 71% 21% 8%
Share 100%
48.5% 51.1% 0.4%
Votes 122.3 59.3
62.5 0.5
True Vote
(95% turnout)
New Votes Weight Kerry Bush Other
DNV 27.02 21.49% 57% 41%
2%
Gore 48.08 38.23% 91% 8%
1%
Bush 47.56 37.83% 10% 90%
0%
Other 3.08 2.45% 64% 17%
19%
Share Total 100% 52.4% 46.3% 1.3%
Votes 125.7
65.9 58.3 1.6
_______________________________________________________________________________________________________________________
Party ID:
Further Confirmation of a Kerry Landslide
Among the many myths surrounding the 2004 election was Karl Rove’s vaunted effort in mobilizing the Christian fundamentalist vote. The media once again succumbed to the BushCo propaganda and happily promoted the fiction to explain the Bush “mandate”. But it’s an established fact that the Democratic GOTV effort overwhelmed the GOP. There were approximately 26 million new voters and Kerry won 57-61% of them. Over three million ballots (75% of them for Kerry) were never counted. And probably one million disenfranchised Democrats were disenfranchised. What the GOP calls “voter fraud” is just another scam in their arsenal of election fraud.
The 12:22am National Exit Poll update had a Party ID mix of 38% Democrats, 35% Republicans and 27% Independents. The corresponding Kerry vote shares were 91%, 7% and 52%. In the Final NEP the mix was changed to 37/37/26 with Kerry vote shares of 89%, 6% and 49% respectively. The adjustments turned Kerry's 51-48% win into a 51-48% loss.
But the changes to the weights and vote shares left footprints which exposed the fraud. A Pew study shows that the Democrats have held a steady 4-5 point Party ID advantage in the four presidential elections since 1992. And the 1992-2004 Final National Exit polls indicate that the Democratic candidate won first-time voters by an average 14% margin. It’s only logical to conclude that a solid majority of first-timers were Democrats.
So why should we believe the 3% red-shift to the Republicans from the 12:22am NEP to the Final?
Science works by assuming that the explanation that best fits the data is correct. But new data must always be tested to either strengthen the case or cause it to be rejected in favor of a better explanation. The Final Exit Poll does not pass the plausibility test. Since it was forced to match the recorded vote, we must reject the fictional narrative of a Bush victory. To believe that Bush won the election despite the following facts, one must suspend reality and
believe in Rovian faith-based mathematics.
1) The first-time voter trend has been heavily Democratic since 1992 (14% average margin)
2) Gore won the popular vote by more than his 540,000 official margin (5% of total votes cast were uncounted)
3) There were over 15m first-time voters and Kerry won them by 55-43%
4) Kerry’s share of Democratic
voters was 3% greater than Gore’s share
5) Kerry’s share of Independent voters was 3% greater than Gore’s share
6) Final Exit Poll weights and vote shares were forced to match the official vote.
7) The Democrats have held a steady 4-5% lead in Party ID in every election since 1992.
Journalist Ron Suskind relates a chilling conversation he had in 2002 with a senior aide to George W. Bush, who taunted
Suskind for being a person from “what we call the reality-based community.
”The Bush aide said this
“reality-based community” consists of people who “believe that solutions emerge
from
your judicious study of
discernible reality.” Suskind nodded in agreement and muttered something
favorable about
the principles of the Enlightenment, only to be cut off by the aide.
“That’s not the way the world
really works anymore,” the Bush aide told the journalist. “We’re an empire now,
and when we act, we create our own reality. And while you’re
studying that reality – judiciously, as you will –
we’ll act again, creating other
new realities, which you can study too, and that’s how things will sort out.
We’re history’s actors … and you, all of you, will be left to study what we do.”
Final National Exit Poll
Party ID Historical Trend
1972 1976 1980 1984 1988 1992 1996 2000 2004 Chg
Republicans Dem 6 9 9 7 8 10 13 8 6 (2)
Rep 93 90 86 92 91 73 80 91 93 2
Ind -- -- 4 -- -- 17 6 1 1 0
Independents Dem 33 43 30 36 43 38 43 45 49 4
Rep 65 54 55 63 55 32 35 47 48 1
Ind -- -- 12 -- -- 30 17 8 3 (5)
Democrats Dem 33 77 67 74 82 77 84 86 89 3
Rep 64 22 26 25 17 10 10 11 11 0
Ind -- -- 6 -- -- 13 5 3 0 (3)
_________________________________________________________________________________________________________________________________
First-time Voters
2004F: 2:04pm Final NEP (13660 respondents)
2004P: 12:22am NEP (13047 respondents)
……… 84 88
92 96 00 2004P 2004F
Dem 38 47 46 54
52 55 53
Rep 61 51 32 34
43 43 46
2004 Mix Total Kerry Votes Bush Votes
1st-time 11% 13.453 55% 7.40 43% 5.78
Other 6% 7.338 61% 4.45 37% 2.74
DNV2k 17% 20.791 57% 11.85 41% 8.52
_________________________________________________________________________________________________________________________________
2004 National Exit Poll
Party-ID Timeline
Updated 3:59pm
7:33pm 12:22am Final
3:59pm
7:33pm 12:22am Final
Sampled 8349
11027 13047 13660
Change 8349 11027
13047 13660 Change
Category
Weight
Kerry Vote
Share
Dem
39 38
38 37
-1
90 90
90 89 -1
Rep
36
36 35
37 +2
7
7
7 6
-1
Ind
25 26
27 26
-1
52 52
52 49 -3
Share
100 100
100
100
50.62 50.24 50.69 47.89
Votes
61.89 61.42 61.97 58.55
Vote
Share Calculation
12:22am
Final
Weight Kerry Bush
Other
Weight Kerry Bush Other
Dem
38% 91%
9%
0%
37% 89%
11% 0%
Rep
35% 7%
93%
0%
37% 6%
93% 1%
Ind
27% 52%
44%
4%
26% 49%
49% 2%
Share
100% 51.07% 47.85%
1.08%
100% 47.89% 51.22% 0.89%
Votes
122.30 62.46 58.52
1.32
122.3 58.57 62.64 1.09
_________________________________________________________________________________________________________________________________
True
Vote Estimate
(adjusted
shares)
Votes Weight Kerry
Bush Other
Dem
47.78 38.0% 91.0%
8.0% 1.0%
Rep
44.01 35.0% 8.0%
91.0% 1.0%
Ind
33.95 27.0% 56.0%
43.0% 1.0%
Share
Total 100.0% 52.5%
46.5% 1.0%
Votes
125.74 125.74 66.01
58.47 1.26
Sensitivity Analysis
(True Vote adjusted shares)
Kerry share of Democrats
Dem ID
86.0% 87.0% 88.0%
89.0% 90.0% 91.0% 92.0%
Kerry Vote Share
35%
48.0% 48.4% 48.7%
49.1% 49.4% 49.8% 50.1%
36%
48.9% 49.2% 49.6%
50.0% 50.3% 50.7% 51.0%
37%
49.7% 50.1% 50.5%
50.9% 51.2% 51.6% 52.0%
38%
50.6% 51.0% 51.4%
51.7% 52.1% 52.5%
52.9%
39%
51.5% 51.9% 52.2%
52.6% 53.0% 53.4% 53.8%
40%
52.3% 52.7% 53.1%
53.5% 53.9% 54.3% 54.7%
Kerry
Kerry
share of Democrats
share
88.0% 89.0% 90.0%
91.0% 92.0% 93.0% 94.0%
of
Ind
Kerry Vote Share
49%
49.5% 49.9% 50.2%
50.6% 51.0% 51.4% 51.8%
50%
49.7% 50.1% 50.5%
50.9% 51.3% 51.6% 52.0%
51%
50.0% 50.4% 50.8%
51.2% 51.5% 51.9% 52.3%
52%
50.3% 50.7% 51.0%
51.4% 51.8% 52.2% 52.6%
53%
50.6% 50.9% 51.3%
51.7% 52.1% 52.5% 52.8%
54%
50.8% 51.2% 51.6%
52.0% 52.3% 52.7% 53.1%
_________________________________________________________________________________________________________________________________
Ohio Exit Poll
The weights changed from 38D/37R to 35D/40R, a 7.9% shift.
With the original weights, Bush needed 17% of Democrats to match the
recorded vote. He had 8%.
12:22am
(1963)
Final (2020)
Mix Votes Kerry Bush
Mix
Kerry Bush
Dem
38% 2.14
91%
8%
35% 90% 9%
Rep
37% 2.08
6%
94%
40% 6% 94%
Ind
25% 1.41
60%
39%
25% 59% 40%
Total
51.80%
47.57%
48.65% 50.75%
2.919
2.681
2.741 2.860
Florida General Exit
Poll
(2743 respondents)
Mix KERRY
BUSH
Other
Dem
38 86
13
1
Rep
39
7
92
1
Ind
23 60
38
2
Total
100 49.21
49.56
1.23
True Vote
(registration mix)
Dem
41.4 86
13
1
Rep
37.8 7
92
1
Ind
20.8 60
38
2
Total
100 50.73
48.06 1.21
According to the Final National Exit Poll:
In 2000, Gore won 55.7% of women voters, but only 44.2% of men. Gore won the recorded vote by 51.0-50.46m.
In 2004, Kerry won 51.5% of women and 44.4% of men. Bush won the recorded vote by 62.0-59.0m.
How come Bush sharply increased his
share of Democratic women voters while his share of Republican males declined?
One would normally expect to see a positive correlation in the Demographic Trend between the two groups. There was a net 2% defection of Bush 2000 voters to Kerry
and returning Nader voters preferred Kerry by better than 3-1. These factors
produce a Kerry 64-57m margin - assuming 122.3m recorded votes. But
approximately 3.4m
ballots were uncounted and about 75% were for Kerry. Therefore his true margin was close to 9 million votes (66.6-57.9m).
To believe that Bush won by 62-59m, one must believe that his “mandate” was provided by women who in 2000 either a) did not vote, b) voted for Gore, or c) voted for Nader. But according to the NEP, Kerry won New voters by 57-41%, Gore voters by 91-8% and Nader voters by 64-17%. So why should you believe it?
The 12:22am National Exit Poll gender split matched to the census and weighted state exit polls. Kerry was leading in all of them.Three voter surveys matched the gender split to within 0.5%. Yet the final recorded vote deviated from the exit polls by 2.5%.
GENDER
SPLIT
Poll Sample Female
Male
Census 60000 53.51%
46.49%
National 13047 54.00% 46.00%
State 72714 53.76%
46.24%
STATE EXIT
POLLS
12:22am Composite
(72,714 respondents)
Gender Weight Votes
Kerry Bush
Nader
Female 53.76% 65.68
52.36% 47.04%
0.61%
Male 46.24% 56.49
47.97% 51.02%
1.01%
Vote share
- 50.33%
48.88%
0.79%
Votes
122.17 61.49 59.72
0.97
NATIONAL EXIT
POLL
Nov. 3, 12:22am, 13047
respondents
Weight Votes Kerry
Bush
Other
Female 54.00% 65.97
54.00% 45.00%
1.00%
Male 46.00% 56.20
47.00% 52.00%
1.00%
Vote share
- 500.78% 48.22%
1.00%
Votes
122.17 62.04 58.91
1.22
NATIONAL EXIT POLL
TIMELINE
Sample Weight
.......Kerry........
Update Size Female
Male Female Male
Total
3:39pm 8349
58% 42%
53% 47%
50.48
7:33pm 11027 54%
46% 54%
47% 50.78
12:22am 13047 54%
46% 54%
47%
50.78
1:25pm 13660 54%
46% 51%
44% 47.78
STATE GENDER VOTE
Total Gender split Vote
split -------------------- Kerry
----------------------
Vote Female Male
Female Male Female Male
Female Male Total Pct
122.17 53.76% 46.24% 65.683
56.488 52.36% 47.97% 34.391
27.098 61.489 50.33%
AL
1.883 54.92% 45.08%
1.034 0.849 46.0%
35.0% 0.476 0.297 0.773
41.04%
AK
0.312 52.48% 47.52%
0.164 0.148 45.0%
32.5% 0.074 0.048 0.122
39.06%
AZ
2.013 53.47% 46.53%
1.076 0.936 50.0%
43.5% 0.538 0.407 0.945
46.98%
AR
1.056 57.00% 43.00%
0.602 0.454 50.5%
41.0% 0.304 0.186 0.490
46.42%
CA
12.392 53.44% 46.56%
6.622 5.770 58.5%
52.5% 3.874 3.029
6.903 55.71%
CO
2.128 53.94% 46.06% 1.148
0.980 50.5% 47.0%
0.580 0.461 1.040
48.89%
CT
1.579 53.47% 46.53%
0.844 0.735 59.5%
55.5% 0.502 0.408 0.910
57.64%
DE
0.227 56.44% 43.56%
0.128 0.099 62.5%
51.5% 0.080 0.051
0.131 57.71%
DC
0.375 57.43% 42.57%
0.215 0.160 91.5%
87.5% 0.197 0.140 0.337
89.80%
FL
7.604 54.00% 46.00%
4.106 3.498 52.0%
47.0% 2.135 1.644 3.779
49.70%
GA
3.299 56.44% 43.56%
1.862 1.437 46.0%
39.5% 0.856 0.568 1.424
43.17%
HI
0.429 54.00% 46.00%
0.232 0.197 57.0%
49.0% 0.132 0.097 0.229
53.32%
ID
0.598 55.90% 44.10%
0.334 0.264 36.5%
30.0% 0.122 0.079 0.201
33.63%
IL
5.275 54.46% 45.54%
2.873 2.402 58.5%
55.5% 1.681 1.333
3.014 57.13%
IN
2.468 52.48% 47.52%
1.295 1.173 42.5%
39.5% 0.550 0.463 1.014
41.07%
IA
1.505 54.46% 45.54%
0.820 0.685 52.0%
47.5% 0.426 0.326 0.752
49.95%
KS
1.188 55.45% 44.55%
0.659 0.529 35.0%
33.5% 0.231 0.177
0.408 34.33%
KY
1.796 54.46% 45.54%
0.978 0.818 42.5%
38.5% 0.416 0.315 0.731
40.68%
LA
1.939 55.45% 44.55%
1.075 0.864 47.5%
40.5% 0.511 0.350 0.860
44.38%
ME
0.741 53.47% 46.53%
0.396 0.345 58.0%
49.5% 0.230 0.171 0.400
54.04%
MD
2.384 54.46% 45.54%
1.298 1.086 58.5%
54.5% 0.760 0.592
1.351 56.68%
MA
2.905 53.44% 46.56%
1.553 1.353 69.5%
62.5% 1.079 0.845 1.925
66.24%
MI
4.838 51.00% 49.00%
2.467 2.371 54.0%
50.0% 1.332 1.185 2.518
52.04%
MN
2.823 52.48% 47.52%
1.481 1.341 54.5%
53.5% 0.807 0.718 1.525
54.02%
MS
1.138 53.00% 47.00%
0.603 0.535 43.0%
43.0% 0.259 0.230 0.489
43.00%
MO
2.731 53.47% 46.53% 1.460
1.271 47.5% 47.5%
0.694 0.604 1.297 47.50%
MT
0.450 50.02% 49.98%
0.225 0.225 37.5%
39.0% 0.084 0.088 0.172
38.25%
NE
0.777 52.00% 48.00%
0.404 0.373 36.0%
36.0% 0.145 0.134
0.280 36.00%
NV
0.826 52.48% 47.52%
0.433 0.392 53.5%
45.5% 0.232 0.179 0.410
49.70%
NH
0.676 49.51% 50.49%
0.335 0.341 57.5%
52.5% 0.193 0.179 0.372
54.98%
NJ
3.610 53.37% 46.63%
1.927 1.683 56.0%
51.0% 1.079 0.858
1.937 53.67%
NM
0.756 54.46% 45.54%
0.412 0.344 51.5%
49.5% 0.212 0.170 0.383
50.59%
NY
7.389 53.00% 47.00%
3.916 3.473 67.0% 60.0%
2.624 2.084 4.707 63.71%
NC
3.501 53.00% 47.00%
1.855 1.645 51.0%
45.0% 0.946 0.740 1.687
48.18%
ND
0.313 51.49% 48.51%
0.161 0.152 36.5%
29.5% 0.059 0.045 0.104
33.10%
OH
5.625 53.00% 47.00%
2.981 2.644 53.0%
51.0% 1.580 1.348 2.929
52.06%
OK
1.464 52.48% 47.52%
0.768 0.696 36.0%
33.5% 0.277 0.233 0.510
34.81%
OR
1.828 56.35% 43.65%
1.030 0.798 57.5%
43.5% 0.592 0.347
0.939 51.39%
PA
5.766 53.00% 47.00%
3.056 2.710 56.5%
52.0% 1.727 1.409 3.136
54.39%
RI
0.436 53.47% 46.53%
0.233 0.203 65.0%
60.5% 0.152 0.123
0.274 62.91%
SC
1.616 57.43% 42.57%
0.928 0.688 49.0%
40.5% 0.455 0.279 0.733
45.38%
SD
0.388 49.51% 50.49%
0.192 0.196 38.0%
35.5% 0.073 0.070 0.143
36.74%
TN
2.437 52.48% 47.52%
1.279 1.158 42.0%
39.5% 0.537 0.457
0.995 40.81%
TX
7.410 54.92% 45.08%
4.070 3.341 34.5%
40.0% 1.404 1.336 2.740
36.98%
UT
0.927 54.92% 45.08%
0.509 0.418 30.0%
29.0% 0.153 0.121
0.274 29.55%
VT
0.311 55.00% 45.00%
0.171 0.140 65.5%
62.0% 0.112 0.087 0.199
63.93%
VA
3.193 53.00% 47.00%
1.692 1.501 52.0%
44.0% 0.880 0.660 1.540
48.24%
WA
2.857 57.86% 42.14%
1.653 1.204 58.0%
50.0% 0.959 0.602
1.561 54.63%
WV
0.756 53.47% 46.53%
0.404 0.352 45.0%
44.5% 0.182 0.157 0.338
44.77%
WI
2.993 53.47% 46.53%
1.600 1.393 53.0%
45.5% 0.848 0.634
1.482 49.51%
WY
0.243 50.02% 49.98%
0.122 0.121 34.5%
29.0% 0.042 0.035 0.077
31.75%
________________________________________________________________________________________________
Analysis of National Exit
Poll Demographic Changes in Gender
(2000 to 2004)
Consider these changes in Bush’s 2-party vote shares:
- Gender: females increased by 4.2%; males decreased by 0.2%
- Whites: females increased by 5.0%; males decreased by 0.9%
- Non-whites: females increased by 4.0%; males increased by 0.76%
- Independents: females increased by 1.8%; males decreased by 5.6%
Why would females defect to Kerry and males defect to Bush? Females voted 54-45% for Kerry. Why would heavily
Democratic non-white females defect to Bush? Why would independent males defect to Kerry at triple the rate
independent females defected to Bush? Independents split 52-44 for Kerry and he won Nader 2000 voters by better than 3-1.
NEP
2-party
2000 2004
Chg 2000
2004 Chg
GENDER
Male
Dem 42
44 2
44.21 44.44 0.23
Rep 53
55 2
55.79 55.56
Ind 5
1
(4)
Female
Dem 54
51 (3)
55.67 51.52 (4.15)
Rep 43
48 5
44.33 48.48
Ind 3
1
(2)
Dem 48.48
47.78 (0.70) 50.46
48.26 (2.20)
Rep 47.60
51.22 3.62 49.54
51.74
Ind 3.92
1
(2.92)
NEP
2-party
2000 2004
Chg 2000
2004 Chg
RACE/GENDER
White
Male
Dem 36
38 2
37.50 38.38 0.88
Rep 60
61 1
62.50 61.62
Ind 4
1
(3)
White
Female
Dem 48
44 (4)
49.48 44.44 (5.04)
Rep 49
55 6
50.52 55.56
Ind 3
1
(2)
Non-white
Male
Dem 85
86 1
87.63 86.87 (0.76)
Rep 12
13 1
12.37 13.13
Ind 3
1
(2)
Non-white
Female
Dem 94
90 (4)
94.00 90.00 (4.0)
Rep 6
10 4
6.00 10.00
Ind 0
0
NEP
2-party
2000 2004
Chg 2000
2004 Chg
AGE/GENDER
Men
18-29
Dem 41
51 10
44.57 52.04 7.47
Rep 51
47 (4)
55.43 47.96
Ind 8
2
(6)
Fem
18-29
Dem 53
56 3
55.79 56.57 0.78
Rep 42
43 1
44.21 43.43
Ind 5
1
Men
30-44
Dem 42 42
0 43.75
42.86 (0.89)
Rep 54
56 2
56.25 57.14
Ind 4
2
(2)
Fem
30-44
Dem 53
49 (4)
54.08 49.49 (4.59)
Rep 45
50 5
45.92 50.51
Ind 2
1
(1)
Men
45-59
Dem 41
45 4
42.71 45.45 2.74
Rep 55
54 (1)
57.29 54.55
Ind 4
1
(3)
Fem
45-59
Dem 53
50 (3)
54.64 50.51 (4.13)
Rep 44
49 5
45.36 49.49
Ind 3
1
(2)
Men
60+
Dem 44
39 (5)
45.36 39.39 (5.97)
Rep 53
60 7
54.64 60.61
Ind 3
1
(2)
Fem
60+
Dem 56
51 (5)
57.14 51.00 (6.14)
Rep 42
49 7
42.86 49.00
NEP
2-party
2000 2004
Chg 2000
2004 Chg
POLITICS/GENDER
Repub
Men
Dem 7
6 (1)
7.07 6.06 (1.01)
Rep 92
93 1
92.93 93.94
Ind 1
1 0
Repub
Women
Dem 9
7 (2)
9.09 7.00 (2.09)
Rep 90
93 3
90.91 93.00
Ind 1
0
(1)
Indep
Men
Dem 39
47 8
43.33 48.96 5.63
Rep 51
49 (2)
56.67 51.04
Ind 10
4
(6)
Indep
Women
Dem 51
52 1
54.84 53.06 (1.78)
Rep 42
46 4
45.16 46.94
Ind 7
2
(5)
Dem
Men
Dem 85
88 3
87.63 88.89 1.26
Rep 12
11 (1)
12.37 11.11
Ind 3
1
(2)
Dem
Women
Dem 87
89 2
88.78 89.90 1.12
Rep 11
10 (1)
11.22 10.10
Ind 2
1
(1)
NEP
2-party
2000 2004
Chg 2000
2004 Chg
EDUCATION/GENDER
Men-no
college
Dem 46
44 (2)
46.94 44.44 (2.50)
Rep 52
55 3
53.06 55.56
Ind 2
1
(1)
Women-no college
Dem 53
50 (3)
54.64 50.51 (4.13)
Rep 44
49 5
45.36 49.49
Ind 3
1
(2)
Men-some
college
Dem 40
42 2
41.67 42.42 0.75
Rep 56
57 1
58.33 57.58
Ind 4
1
(3)
Women-some
college
Dem 50
49 (1)
51.02 49.00 (2.02)
Rep 48
51 3
48.98 51.00
Ind 2 0
(2)
Men-college
grad
Dem 39
44 5
40.63 44.90 4.37
Rep 57
54 (3)
59.38 55.10
Ind 4
2
(2)
Women-college
grad
Dem 57
54 (3)
58.76 54.55 (4.21)
Rep 40
45 5
41.24 45.45
Ind 3
1
(2)
_____________________________________________________________________
Did Kerry Win More Than 360 Electoral Votes?
In 2004 Bush officially won by 286-251 electoral votes. But who really believes it? This analysis shows that Kerry may very well have won over 360 Electoral votes. The sensitivity analysis tables display Kerry's popular and electoral vote over a range of assumptions.
Key Results
Popular vote:
Kerry Bush
67.3m 57.5m
53.5% 45.7%
Electoral vote: Kerry 367, Bush 171
Kerry won the following 11 states which were recorded for Bush: AZ, AR, CO, FL, IA, MO, NV, NM, OH, TN, WV
Base Case Assumptions
1- 110.8m Census 2000 votes cast (105.4m recorded)
2- 125.7m Census 2004 votes cast (122.3m recorded)
3- Uncounted votes: Gore 70%; Bush 25%
4- 2000 voter mortality prior to 2004: 5% Gore; 4.8% Bush
5- 2000 voter turnout in 2004: 95% for Gore, Bush, Nader
6- Kerry won 71% of Nader 2000 voters (12:22am NEP)
7- Kerry won 57% of DNV2k (did not vote in 2000)
8- Kerry won 10% of Bush 2000 voters; Bush won 8% of Gore voters
9- Mortality and uncounted vote rates constant in all states
State Recorded Vote Adjustments
(in thousands of votes)
2000 Recorded Vote
Uncounted
4 year Mortality Turnout
in 2004
48.7% 48.2%
3.1%
70% 25%
5.0%
4.8%
95% 95%
Gore Bush
Nader Gore
Bush
Gore
Bush
Gore Bush
State
51,004 50,459
3,275
3,745
1,338
2,737
2,486
49,411 46,845
AL
692 941
25
59 21
38
48
678 868
AK
79 167
33
10 4
4
9
80 154
AZ
685 781
56
54
19
37
40
667 722
AR
422 472
23
33 12
23
24
410 437
CA
5,861 4,567
459
389
139
313
235
5,641 4,247
CO
738 883
101
62 22
40 45
722 817
CT
816 561
68
52 18
43 29
783 523
DE
180 137
9
12 4
10
7
173 127
DC
171 18
11
7 3
9
1
161 19
FL
2,912 2,912
115
212
76
156
149
2,820 2,697
GA
1,116 1,419
11
91 33
60
73
1,089 1,310
HI
205 137
23
13 5
11
7
197 128
ID
138 336
8
17 6
8
17
140 309
IL
2,589 2,019
120
169
60
138
104
2,489 1,877
IN
901 1,245
17
77 28
49
64
883 1,149
IA
638 634
37
47
17
34
33
618 587
KS
399 622
43
38 14
22
32
394 574
KY
638 872
27
55 20
35
45
625 805
LA
792 927
36
63 22
43
47
771 857
ME
319 286
41
23 8
17 15
309 266
MD
1,144 813
58
72 26
61
42
1,097 757
MA
1,616 878
185
96
34
86
46
1,545 823
MI
2,170 1,953
84
150 54
116
100
2,094 1,811
MN
1,168 1,109
159
87
31
63
57
1,133 1,029
MS
404 572
10
35 13
22
29
396 528
MO
1,111 1,189
49
84 30
60
61
1,078 1,100
MT
137 240
30
15 5
8
12
137 221
NE
231 433
28
25 9
13
22
231 399
NV
279 301
20
21 8
15
15
271 279
NH
266 273
25
20
7
14 14
258 253
NJ
1,788 1,284
101
113
41
95
66
1,716 1,195
NM
287 286
22
21 8
15
15
278 265
NY
4,112 2,405
278
243
87
218
125
3,930 2,249
NC
1,257 1,631
9
104 37
68
83
1,228 1,505
ND
95 174
17
10 4
5
9
95 160
OH
2,186 2,351
144
167
60
118 121
2,124 2,176
OK
474 744
9
44 16
26
38
467 686
OR
720 713
17
52 19
39
37
697 660
PA
2,485 2,281
120
175
62
133 117
2,400 2,115
RI
249 130
27
15 5
13
7
238 122
SC
566 786
24
49
18
31
40
555 725
SD
118 190
3
11 4
6
10
117 175
TN
981 1,061
24
74
26
53
54
952 981
TX
2,433 3,799
150
228
82
133
194
2,402 3,502
UT
203 515
45
27 10
12
26
208 474
VT
149 119
23
10 4
8
6
144 111
VA
1,217 1,437
65
97 35
66
74
1,186 1,328
WA
1,247 1,108
108
88
31
67
57
1,205 1,028
WV
295 336 14
23
8
16
17
287 311
WI
1,242 1,237
105
92
33
67
63
1,204 1,146
WY
60 147
3
8 3
3
7
61 135
Nader Allocation Defection New
Voters
Adjusted True Vote
Electoral
71% 21%
8% 10%
57% 41%
Vote
Kerry Bush
Gore Bush
Kerry
Bush
Kerry Bush Kerry
Bush Kerry
State
2,301 681
3,953 4,684 14,883
10,705
67,327 57,499 53.54% 45.73% 367
AL
18
5
54 87
157 197
885 1,038
45.7% 53.6%
AK
23
7
6 15
20
33
133 185
41.5% 57.7%
AZ
40 12
53 72
321 297
1,047 1,012 50.4%
48.7% 10
AR
16
5
33 44
107 98
544 529
50.4% 49.0% 6
CA
326 96
451 425
1,628 712
7,568 5,082 59.4%
39.9% 55
CO
72 21
58 82
276
261
1,093 1,075 50.0%
49.2% 9
CT
48 14
63 52
187 57
1,008 604
62.1% 37.2% 7
DE
6
2
14 13
52
22
230 153
59.7% 39.6% 3
DC
8
2
6
1 245
10
408 36
91.5% 8.2% 3
FL
82 24
226 270
1,201 931
4,146 3,608 53.1%
46.2% 27
GA
8
2
87 131
440 515
1,581 1,784 46.6%
52.6%
HI 16
5
16 13
73
19
283 155
64.2% 35.1% 4
ID
6
2
11 31
45 109
210 400
34.2% 65.1%
IL
85 25
199 188 626
287
3,189 2,200 58.8%
40.6% 21
IN
12
4
71 115
206 268
1,145 1,376 45.1%
54.3%
IA
26
8
49 59
170 128
824 713
53.2% 46.1% 7
KS
31
9
32 57
85 120
536 677
43.9% 55.5%
KY
19
6
50 80
168
211
843 991
45.7% 53.7%
LA
26
8
62 86
160 160
981 1,000
49.2% 50.2%
ME
29
9
25 27
92
52
431 324
56.7% 42.6% 4
MD
41 12
88 76
388 138
1,514 919 61.8%
37.5% 10
MA
131 39
124 82
396 31
2,031 935
68.0% 31.3% 12
MI
60 18
168 181
585 372
2,753 2,188 55.4%
44.0% 17
MN
113 33
91 103
350
221
1,608 1,271 55.4%
43.8% 9
MS
7
2
32 53
98 131
523 640
44.7% 54.7%
MO
35 10
86 110
303 262
1,440 1,349 51.3%
48.1% 11
MT
21
6
11 22
30 44
199 261 43.0%
56.3%
NE
20
6
18 40
50 88
322 471
40.3% 59.0%
NV
14
4
22 28
147 126
439 402
51.7% 47.4% 5
NH
18 5
21 25
88
67
369 321
53.1% 46.2% 4
NJ
72 21
137 120
500 181
2,270 1,416 61.2%
38.2% 15
NM
16
5
22 27
119 88
417 354
53.6% 45.5% 5
NY
197 58
314 225
959 153
4,997 2,550 65.8%
33.6% 31
NC
6
2
98 151
377 456
1,663 1,911 46.2%
53.1%
ND
12
4
8
16 18
30
134 185
41.6% 57.7%
OH
102 30
170 218
705 603
2,979 2,761 51.5%
47.7% 20
OK
6
2
37 69
131 202
636 858
42.3% 57.0%
OR
12
4
56 66
277 215
996 869
53.0% 46.2% 7
PA
85 25
192 211
762 498
3,267 2,619 55.1%
44.2% 21
RI
19
6
19 12
58 3
308 137
68.7% 30.7% 4
SC
17
5
44 73
152
195
752 897
45.3% 54.0%
SD
2
1
9
18 39
62
166 230
41.7% 57.6%
TN
17
5
76 98
280 253
1,271 1,217 50.8%
48.6% 11
TX
107 32
192 350
616 908
3,282 4,283 43.1%
56.2%
UT
32
9
17 47
68 154
338 606
35.5% 63.7%
VT
16
5
12 11
29 12
189 128
59.2% 40.1% 3
VA
46 14
95 133
342
344
1,612 1,648 49.1% 50.2%
WA
77 23
96 103
368 215
1,656 1,260 56.4%
42.9% 11
WV
10
3
23 31
82 79
387 384
49.9% 49.5% 5
WI
75 22
96 115
351 257
1,648 1,407 53.6%
45.7% 10
WY
2
1
5
14 14
35
86 162
34.4% 64.9%
Sensitivity Analysis I
Given: Kerry won 57% of New Voters
Worst case scenario:
Gore won 65% of the uncounted votes in 2000
Kerry won 50% of Nader voters
Kerry wins 52.8% of the popular vote and 337
electoral votes
Best case scenario:
Gore won 80% of uncounted votes in 2000
Kerry won 80% of Nader voters
Kerry wins 54.1% of the popular vote and 389
electoral votes
Gore
Unctd
Kerry % of Nader
voters
Share
50% 60%
71% 80%
Kerry Vote Share
80%
53.3% 53.6% 53.9% 54.1%
75%
53.2% 53.4% 53.7% 53.9%
70%
53.0% 53.3% 53.5% 53.8%
65%
52.8% 53.1% 53.4% 53.6%
Kerry Electoral Vote
80%
358 367
367 389
75%
353 358
367 367
70%
343 353
367 367
65%
337 353
362 367
Sensitivity Analysis II
Given: Kerry won 71% of Nader Voters
Worst case scenario:
Gore won 65% of uncounted votes
Kerry won 52% of new voters (DNV2k)
Kerry wins 52.3% of the popular vote and 326
electoral votes
Best case scenario:
Gore won 80% of uncounted votes
Kerry won 61% of new voters
Kerry wins 54.7% of the popular vote and 389
electoral votes
Gore
Unctd
Kerry % of New
Voters
Share
52% 54%
57% 59% 61%
Kerry Vote Share
80%
52.8% 53.2% 53.9%
54.3% 54.7%
75%
52.7% 53.1% 53.7%
54.1% 54.5%
70%
52.5% 52.9% 53.5%
54.0% 54.4%
65%
52.3% 52.8% 53.4%
53.8% 54.2%
Kerry Electoral
Vote
80%
343 367
367 389 389
75%
343 353
367 389 389
70%
337 353
367 367 389
65%
326 337
362 367 367
Sensitivity Analysis III
Worst case scenario:
Gore voter defection: 10%
Bush voter defection: 8%
Kerry wins 52.0% of the popular vote and 290
electoral votes
Best case scenario:
Gore voter defection: 6%
Bush voter defection: 12%
Kerry wins 55.1% of the popular vote and 389
electoral votes
Bush
Gore Defection
Defect 10% 9%
8% 7%
6%
Kerry Vote Share
12%
53.5% 53.9% 54.3%
54.7% 55.1%
11%
53.1% 53.5% 53.9%
54.3% 54.7%
10%
52.8% 53.1% 53.5%
53.9% 54.3%
9%
52.4% 52.8% 53.2%
53.6% 54.0%
8%
52.0% 52.4% 52.8%
53.2% 53.6%
Kerry Electoral Vote
12%
367 389
389 389 389
11%
353 367
389 389 389
10%
326 353
367 389 389
9%
315 326
353 367 367
8%
290 315
326 353 367
___________________________________________________________________________________
According to the U.S. Census, 125.7 million votes were cast in 2004. The recorded vote was 122.3m. The published Census survey margin of error is 0.30%. Therefore, there is a 95% probability that 125.3-126.1m votes were cast. According to data provided by investigative reporter Greg Palast, 3.006m of 125.3m votes cast were never counted, comprised of 1.389m spoiled, 1.091m provisional and .0.526m absentee ballots. There is just a 400,000 discrepancy between the Census and Palast - a 0.31% deviation.
Given the Kerry true vote of 66.1 million (based on the 12:22am NEP with feasible weights) and his recorded vote (59.0m) we can calculate the number of votes which were switched from Kerry to Bush. If we assume that Kerry won 75% (2.6 of 3.4mm) of the uncounted votes based on the Census total of 125.7mm, then 4.5m (6.8%) Kerry votes must have been switched. Furthermore, if we assume that 6.8% of the votes were switched uniformly in each state and allocate the uncounted votes to each state based on population and racial mix, the True Vote Model indicates that Kerry won 336 electoral votes (Sensitivity Analysis I). This result matched the pre-election Monte Carlo Electoral Vote Simulation base case forecast that Kerry would win 337 electoral votes (the average of 5000 election trials). The assumption was that Kerry would win 75% of the undecided vote.
12:22am National Exit Poll
Voted in 2000
Weight
Votes Kerry
Bush Other
DNV
21.49% 27.02 57%
41% 2%
Gore
38.23% 48.08 91%
8% 1%
Bush
37.83% 47.56 10%
90% 0%
Nader
2.46% 3.09
71% 21%
8%
Total
100%
52.57% 46.43% 1.00%
Votes
125.74
66.10
58.38 1.26
Given:
125.74m votes cast (2004 Census)
122.295m votes recorded
3.445m votes uncounted
Assume:
2.584m (75%) uncounted votes for Kerry
95% turnout of Gore and Bush 2000 voters
Calculate:
The number of votes cast for Kerry switched
to Bush.
Solution:
True Vote (T) = Recorded (R) + Uncounted (U)
+ Switched (S)
S = T - R - U = 66.097 - 59.027 - 2.582 =
4.488m
Switched vote rate:
SVR = S / T = 4.488 / 66.097 = 6.79%
True Vote
Reconciliation
Recorded Share
Uncounted Switched
True Vote
Kerry
59.027 75% 2.584
61.611 4.488 6.79%
66.097
52.57%
Bush
62.040 24% 0.827
62.867 -4.488 -7.69% 58.375 46.43%
Other
1.228 1%
0.034 1.262 0.000
0.00% 1.262
1.01%
Total
122.30 100% 3.445
125.74 0.000 0.00%
125.74 100.0%
VOTE
DISCREPANCY ASSUMPTIONS
(Votes
in thousands)
UNCOUNTED
VOTE SHARE
Kerry 75%: 2,582
Bush 24%: 826
Other 1%: 34
Total 100%: 3,443 (2.74% of Census
125.7mm)
SWITCHED
VOTES
4,488 (6.79%) of Kerry Votes were switched
to Bush
KERRY
VOTE RECONCILIATION
TrueVote 66,097 100.0%
Unctd -2,582 3.91%
Net 63,515
96.09%
Switch -4,488 6.79%
Recorded 59,027 89.30%
EFFECT
ON POPULAR AND ELECTORAL VOTE
True Vote Electoral Vote
Kerry Bush Kerry
Bush
Actual 59027
62040
252
286
Change 7070
-3662 97
-97
TRUE
66097 58378
336
202
VOTE
52.57%
46.43%
BASE
CASE SUMMARY
Switched votes: 6.8%
Share RECORDED
UNCOUNTED
SWITCHED TRUE VOTE
Kerry
75% 59027 48.27%
2582 61609 49.0%
2.11% 4488 66097
52.57%
Bush
24% 62040
50.73% 826 62866
50.0% 0.68% -4488
58378 46.43%
Other
1% 1228
1.00% 34
1262 1.0% 0.03%
0 1262 1.00%
Total
2.74% 122295 100%
3442 125737 100%
2.81% 0
125737 100%
SENSITIVITY
ANALYSIS I
Various
effects of incremental switched vote rates (SVR)
(Kerry
75% share of uncounted votes)
Vote Share Vote
Count Kerry Electoral Vote
Kerry
Bush Kerry
Bush Margin Kerry
Bush States which
Recorded 48.27% 50.73% 59027
62040 -3013
252 286 flipped to Bush
SVR
6.8%
52.57% 46.43% 66097
58383 7714
336 202 CO FL IA MO
NV NM OH
6.5%
52.42% 46.58% 65906
58570 7336
325 213 CO FL IA NV
NM OH
6.0%
52.15% 46.84% 65575
58901 6675 325
213 CO FL IA NV NM OH
5.0%
51.63% 47.37% 64914
59562 5353
325 213 CO FL IA NV
NM OH
4.0%
51.10% 47.90% 64253
60223 4031
325 213 CO FL IA NV
NM OH
3.0%
50.58% 48.42% 63592
60883 2709
289 249 IA NV NM
2.0%
50.05% 48.95% 62931
61544 1387
289 249 IA NV NM
1.0%
49.52% 49.47% 62270
62205 65
264 274 IA
NM
0.0%
49.00% 50.00% 61609 62866
-1257 264 &
274 IA NM
SENSITIVITY
ANALYSIS II:
Effect
of incremental uncounted and switched votes on Kerry electoral vote
Kerry Electoral
Vote
Uncounted Vote
Share
50%
55% 60%
65% 70%
75% 80%
SVR
6.8%
325 325
325 325
325 336 336
6.5%
325 325
325 325
325 325 336
6.0%
325 325
325 325
325 325 325
5.0%
298 298
325 325
325 325 325
4.0%
289 289
289 289
289 325 325
3.0%
289 289
289 289 289
289 289
2.0%
264 284
284 284
289 289 289
1.0%
264 264
264 264
264 264 284
0.0%
252 252
252 252
259 264 264
SENSITIVITY
ANALYSIS III
Effect
of incremental uncounted and switched votes on Kerry vote share
Kerry Vote
Share
Uncounted Vote
Share
50%
55% 60%
65% 70%
75% 80%
SVR
6.8%
51.89% 52.03% 52.16% 52.30%
52.44% 52.57% 52.71%
6.5%
51.73% 51.87% 52.00% 52.14%
52.28% 52.42% 52.55%
6.0%
51.47% 51.60% 51.74% 51.88%
52.02% 52.15% 52.29%
5.0%
50.94% 51.08% 51.22% 51.35%
51.49% 51.63% 51.76%
4.0%
50.42% 50.55% 50.69% 50.83%
50.96% 51.10% 51.24%
3.0%
49.89% 50.03% 50.16% 50.30%
50.44% 50.58% 50.71%
2.0%
49.36% 49.50% 49.64% 49.78%
49.91% 50.05% 50.19%
1.0%
48.84% 48.98% 49.11% 49.25%
49.39% 49.52% 49.66%
0.0%
48.31% 48.45% 48.59% 48.72%
48.86% 49.00% 49.14%
SENSITIVITY
ANALYSIS IV
Effect
of incremental uncounted and switched votes on Kerry margin
Kerry Margin (in
thousands)
Uncounted Vote
Share
50%
55% 60%
65% 70%
75% 80%
SVR
6.8%
6011 6355
6699 7044
7388 7732 8077
6.5%
5614 5958
6303 6647
6991 7336 7680
6.0%
4953 5297
5642 5986
6330 6675 7019
5.0%
3631 3975
4320 4664
5008 5353 5697
4.0%
2309 2654
2998 3342
3686 4031 4375
3.0%
987 1332
1676 2020
2365 2709 3053
2.0%
-335 10 &nbbsp;
354 698
1043 1387 1731
1.0%
-1657 -1312 p; -968
-624 -279 &
65 409
0.0%
-2979 -2634 p; -2290
-1946 -1601 p; -1257 -913
SENSITIVITY
ANALYSIS V:
Probability
of Kerry Vote Discrepancy
MoE:
1.0%
Probability of Vote
Discrepancy
Uncounted Vote
Share
50% 55%
60% 65%
70% 75% 80%
SVR
6.8%
6E-13 9E-14 1E-14
1E-15 1E-16
0 0
6.5%
6E-12 8E-13 1E-13
2E-14 2E-15 2E-16 0
6.0%
2E-10 3E-11 5E-12
7E-13 1E-13 1E-14 2E-15
5.0%
8E-08 2E-08 4E-09
7E-10 1E-10 2E-11 4E-12
4.0%
1E-05 4E-06 1E-06
3E-07 6E-08 1E-08 3E-09
3.0%
7E-04 3E-04 1E-04
3E-05 1E-05 3E-06 8E-07
2.0%
2E-02 8E-03 4E-03
2E-03 6E-04 2E-04 8E-05
1.0%
1E-01 8E-02 5E-02
3E-02 1E-02 7E-03 3E-03
0.0%
5E-01 4E-01 3E-01
2E-01 1E-01 8E-02 4E-02
Analysis of Uncounted and
Switched Votes by State
(in thousands)
Recorded
Vote
Uncounted Switched TRUE
Vote
Total Kerry Bush
Kerry Bush Kerry
Bush Kerry Kerry
Bush
Kerry
Bush Margin EVote
122295 59027 62040
48.27% 50.73% 2582
826 4488 66097
58378 52.57% 46.43%
Change Flip
AL
1877 694
1176 37.0% 62.7%
42 14
47 784
1142 40.5%
59.1% 6.4%
AK
307 111
191 36.2%
62.2% 7
2
8 125
186
39.7% 58.7%
6.3%
AZ
1998 894
1104 44.7% 55.3%
31 10
61 986
1053
48.3% 51.6%
7.0%
AR
1049 470
573 44.8%
54.6% 19
6
32 521
547
48.5% 50.9%
7.2%
CA
12255 6745
5510 55.0% 45.0%
246 79
458 7449
5131
59.2% 40.8%
8.6%
CO
2116 1002
1101 47.4% 52.0%
31 10
68 1101 1043
51.0% 48.3%
7.3% 9
CT
1564 857
694 54.8%
44.4% 26
8
58 941
644
58.9% 40.3%
8.4%
DC
226 203
21 89.8%
9.3% 10
3
14 227
10
94.8%
4.3% 14.4%
DE
373 200
172 53.6%
46.1% 8
2
14 221
161
57.7% 42.0%
8.5%
FL
7582 3584
3965 47.3% 52.3%
140 45 243
3967 3766
51.1% 48.5%
7.5% 27
GA
3280 1366
1914 41.6% 58.4%
81 26
93 1540
1847
45.4% 54.5%
7.1%
HI
426 232
194 54.5%
45.5% 18
6
16 265
184
59.0% 40.9%
9.7%
ID
590 181
409 30.7%
69.3% 7
2 12
201 399
33.5% 66.5%
4.9%
IL
5238 2892
2346 55.2% 44.8%
99 32
196 3187
2181
59.4% 40.6%
8.6%
IN
2448 969
1479 39.6% 60.4%
37 12
66 1072
1425
42.9% 57.1%
6.3%
IA
1500 742
752 49.5%
50.1% 19
6 50
811 708
53.2% 46.4%
7.4% 7
KS
1180 435
736 36.9%
62.4% 18
6
30 482
712
40.1% 59.2%
5.9%
KY
1791 713
1069 39.8% 59.7%
26 8
48 788
1029
43.1% 56.4%
6.3%
LA
1929 820
1102 42.5% 57.1%
49 16
56 925
1062
46.4% 53.2%
7.3%
ME
735 397
330 54.0%
44.9% 9
3
27 433
306
57.9% 41.0%
8.0%
MD
2370 1334
1024 56.3% 43.2%
60 19
91 1484
952
60.6% 38.9%
9.1%
MA
2875 1804
1071 62.7% 37.3%
46 15
122 1972
963
67.2% 32.8%
9.4%
MI
4816 2479
2313 51.5% 48.0% 89
28 168
2736 2173
55.4% 44.0%
8.0%
MN
2811 1445
1347 51.4% 47.9%
41 13
98 1584
1262
55.3% 44.0%
7.8%
MS
1146 458
685 40.0% 59.8%
31 10
31 520
664
43.8% 55.9%
7.0%
MO
2715 1259
1456 46.4% 53.6% 45
15 85
1390 1385
50.1% 49.9%
7.3% 11
MT
446 174
266 39.0%
59.6% 6
2
12 192
256
42.3% 56.4%
6.1%
NE
773 254
513 32.9% 66.4%
11
3
17 282
499 35.8%
63.4% 5.3%
NV
821 397
419 48.4%
51.0% 14
5
27 438
397
52.2% 47.2%
7.6% 5
NH
675 340
331 50.4%
49.0% 8
3
23 371
311 54.1%
45.3% 7.5%
NJ
3600 1911
1670 53.1% 46.4%
72 23
130 2113
1563
57.2% 42.3%
8.4%
NM
751 370
377 49.3%
50.2% 13
4
25 408
356
53.1% 46.4%
7.7% 5
NY
7377 4314
2963 58.5% 40.2%
158 50
293 4764
2720 62.8%
35.9% 9.1%
NC
3487 1526
1961 43.8% 56.2%
74 24
104 1704
1881
47.5% 52.5%
7.2%
ND
312 111
197 35.6%
63.1% 4
1
8 123
191
38.7% 60.1%
5.7%
OH
5601 2741 2860
48.9% 51.1%
94 30
186 3021
2704 52.8%
47.2% 7.6% 20
OK
1464 504
960 34.4%
65.6% 28
9
34 566
935
37.7% 62.3%
5.8%
OR
1810 943
867 52.1%
47.9% 26
8
64 1033 811
56.0% 44.0%
7.9%
PA
5732 2938
2794 51.3% 48.7%
93 30
199 3231
2624
55.2% 44.8%
7.9%
RI
434 260
169 59.9%
38.9% 7
2 18
284 153
64.2% 34.7%
9.0%
SC
1606 662
938 41.2%
58.4% 38
12 45
745 905
45.0% 54.6%
7.0%
SD
386 149
233 38.6%
60.4% 6
2
10 165
225
41.9% 57.1%
6.1%
TN
2429 1036
1384 42.7% 57.0%
45 14
70 1151
1328
46.3% 53.4%
6.9%
TX
7360 2833
4527 38.5% 61.5%
129 41 192
3155 4376
41.9% 58.1%
6.3%
UT
916 241
664 26.3%
72.5% 12
4 16
269 651
28.9% 69.9%
4.4%
VT
309 184
121 59.5%
39.2% 4
1 12
200 110
63.8% 34.9%
8.7%
VA
3172 1455
1717 45.9% 54.1%
68 22
99 1622
1640
49.7% 50.3%
7.5%
WA
2838 1510
1305 53.2% 46.0%
47 15
103 1660
1218
57.2% 42.0%
8.2%
WV
755 327
424 43.3%
56.2% 9
3
22 359
405
46.7% 52.7%
6.6%
WI
2984 1490
1478 49.9% 49.5%
44 14
101 1635
1391
53.7% 45.7%
7.6%
WY
242 71
168 29.3%
69.4% 3
1
5
79 164
32.0% 66.7%
4.8%
___________________________________________________________________________________________________
Reconciling
the Final 5 Million Votes
The 12% difference in margin between the initial 117 million recorded votes (Bush 51-Kerry 48%) and the late 5.0m (Kerry 53-Bush 44%) caused a 0.5m decline in the official Bush margin (3.5 to 3.0m). Was this due to the fact that the election was already decided at the 117m mark and vote-rigging was no longer necessary? Late votes (absentees, etc.) were irrelevant as soon as Bush was declared the winner. Many still recall that the day after the election the media reported that Bush won by 3.5m votes, and remain unaware of the 5.0m late votes. Edison-Mitofsky matched the Final Exit Poll to the initial 117m recorded votes.
Kerry's 52.98% share (2.65 of the 5.01m late votes) of the 122.29m recorded total is 64.79m. Adding his 75% share of uncounted votes (2.58 of 3.45m) brings his final total to 67.37m (53.5%). This is quite close to the Election Calculator model which determined that Kerry won by 53.2-45.4%. The model accounted for total votes cast in 2000 (recorded plus uncounted) less mortality and assumed a 95% turnout of 2000 voters in 2004. The 12:22am NEP vote shares were used to calculate the national vote.
There was a 0.72 correlation between the late state vote shares and the exit polls. For states which had more than 40k late votes, the correlation statistic was a much stronger 0.93, as one would expect. This is further evidence that the "pristine" exit polls were close to the true vote:
1) the high correlation between state exit polls and late vote shares
2) the small discrepancies between the exit polls and the late vote shares
3) the consistent pattern of a higher Kerry share of late votes compared to initial recorded votes
How does one explain the discrepancies between the initial and late recorded state vote shares? Kerry’s late vote share exceeded his initial share in 38 states (15 of 19 battleground states). Corresponding vote discrepancies were significant in the East but near zero in the Far West, strongly suggesting election fraud in early-reporting, vote-rich battleground states. A false impression was created that Bush was winning the popular vote while the state and national exit polls indicated that Kerry was winning big. In the Far Western states there was virtually no difference between the 15.6m initial and 3.3m late recorded vote shares; Kerry was a steady 53% winner. But the Far West average exit poll WPE was 6.4%, indicating a 56% Kerry share. Was vote-padding still in effect?
Not a single media pundit has ever noted the following:
1) Final state exit polls and a mathematically impossible National Exit poll were adjusted to match the recorded vote.
2) Unadjusted “pristine” state exit polls were close to the True vote.
3) Final 5 million recorded votes were close to the True vote.
Final
Recorded Vote
Bush
62,040,610 50.73%
Kerry
59,028,439 48.27%
Other
1,224,499 1.00%
Total
122,293,548
100%
Initial
117.28m votes
Bush
59,834,866 51.02%
Kerry
56,373,514 48.07%
Other
1,073,874
0.91%
Total
117,282,254
100%
Late
5.01m votes
Bush
2,205,744 44.02%
Kerry
2,654,925 52.98%
Other
150,625
3.00%
Total
5,011,294
100%
Other:
Nader
406,940 0.35%
Badnarik
384,174
0.33%
Peroutka
132,054
0.11%
Cobb
107,400 0.09%
Peltier
21,616
0.02%
Brown
10,283 0.01%
Harris
6,962 0.01%
Calero
4,445 0.00%
Kerry
Vote Share Summary
Recorded Kerry
Votes
Final
48.27% 122.29m
Initial 48.07%
117.28m
Late
52.98% 5.01m
State
Exit Polls based on weighted average WPE
Method
Kerry Avg WPE Wtd Avg
Description
VNS
51.81% 5.95%
7.09% VNS: 4 outliers removed from average
DSS
52.15% 6.73% 7.77% Decision Summary
Screen: 4 outliers removed
IMS
51.91% 6.29% 7.37% Input Mgt Screen:
no outliers removed
National
Exit Poll Timeline (Gender demographic)
3:59pm 50.48% 8349
respondents
7:33pm 50.78%
11027
12:22am 50.78% 13047
Final
47.78% 13660 (matched to initial 117m recorded votes)
Model
53.23% (Election Calculator-see below)
______________________________________________________________________________
The Final 5.6 Million
Recorded Votes
http://www.usatoday.com/news/politicselections/vote2004/president.htm
Kerry
2-party Unweighted Average Vote
Share
States
grouped by Total Late Votes
Late
Exit Late Diff
100k+
55.1% 54.8% 0.3%
30-100k 47.0%
49.5% -2.6%
10-30k
50.2%
54.6% -4.4%
0-10k
48.3% 51.4% -3.2%
All
50.0% 52.5% -2.5%
Kerry 2-party Regional
Weighted Average Vote
Share
* indicates state had less than 2000 late
votes
Final
Initial Late Change
WPE Exit
Wtd
48.8% 48.5% 54.3%
5.8% 5.8% 51.6%
Unwtd
48.4% 48.4% 52.0%
3.7% 6.0% 51.5%
Weighted
East
56.5% 56.2% 62.4%
6.2% 9.7% 61.3%
Midw
48.1% 48.1% 56.1%
8.1% 3.4% 49.8%
South
42.7% 42.6% 46.6%
4.0% 5.8% 45.6%
West
41.7% 41.7% 41.9%
0.2% 4.8% 44.1%
FarW
53.2% 53.3% 53.0%
-0.2% 6.4% ; 56.4%
Final Initial Late
Change WPE
Exit
East
CT
55.3% 55.3% 56.3%
1.0% 15.7% 63.3%
DC*
90.5% 90.5% 90.5%
0.0% 3.4% 92.2%
DE*
53.8% 53.8% 67.3%
13.4% 15.9% 61.9%
MA
62.7% 62.7% 71.5%
8.8% 5.8% 65.7%
MD
56.6% 56.2% 60.3%
4.1% 8.1% 60.7%
ME*
54.6% 54.5% 87.3%
33.0% 3.8% 56.5%
NH*
50.7% 50.7% 55.8%
5.2% 13.6% 57.6%
NJ
53.4% 53.1% 57.6%
4.5% 9.7% 58.3%
NY
59.3% 58.8% 65.8%
7.0% 11.4% 65.1%
PA
51.3% 51.1% 58.6%
7.5% 8.8% 55.7%
RI
60.6% 60.5% 62.6% 2.1%
4.7% 63.0%
VT*
60.3% 60.3% 48.7%
-11.6% 15.0% &nbssp; 68.0%
Final Initial Late
Change WPE
Exit
Midwest
IA
49.7% 49.5% 62.1%
12.6% 3.0% 51.2%
IL
55.2% 55.1% 70.3%
15.2% 4.4% 57.4%
IN
39.6% 39.5% 62.0%
22.6% 1.5% 40.3%
KS
37.1% 37.0% 42.7%
5.8% 1.7% 38.0%
OH
48.9% 48.7% 56.2%
7.4% 10.9% 54.4%
MI
51.7% 51.7% 58.4%
6.7% 6.3% 54.9%
MN
51.8% 51.8% 47.9%
-3.9% 9.3% ; 56.5%
MO
46.4% 46.3% 63.8%
17.5% 5.8% 49.3%
ND*
36.1% 36.1% 37.4%
1.3% -5.2% 33.4%
NE
33.2% 33.0% 43.6%
10.6% 8.1% 37.3%
OK*
34.4% 34.4% 34.4%
0.0% -1.9% 33.5%
SD 39.1%
39.1% 32.8% -6.3%
-4.2% 37.0%
WI
50.2% 50.2% 36.3%
-13.9% 4.7% p; 52.6%
Final
Initial Late Change
WPE Exit
South
AL*
37.1% 37.1% 67.6%
30.6% 11.3% 42.8%
AR
45.1% 45.0% 48.2%
3.2% 0.5% 45.3%
FL
47.5% 47.5% 50.5%
3.0% 7.6% 51.3%
GA
41.6% 41.6% 46.2%
4.6% 2.2% 42.8%
LA
42.7% 42.6% 79.5%
36.9% 3.8% 44.6%
KY*
40.0% 40.0% 30.2%
-9.8% -0.1% p; 39.9%
MS
40.1% 40.0% 44.2%
4.3% 11.3% 46.2%
NC
43.8% 43.7% 45.4%
1.6% 11.3% 49.4%
SC
41.4% 41.3% 45.1%
3.8% 10.0% 46.4%
TN*
42.8% 42.8% 56.0%
13.2% 0.5% 43.1%
VA
45.9% 45.8% 48.8%
3.0% 7.9% 49.8%
WV
43.5% 43.6% 40.5%
-3.0% -5.8% p; 40.6%
TX
38.5% 38.5% 45.3%
6.8% 4.8% 40.9%
Final
Initial Late Change
WPE Exit
West
CO
47.6% 47.3% 53.6%
6.3% 6.1% 50.7%
ID*
30.7% 30.7% 15.4%
-15.3% 1.0% p; 31.2%
MT*
39.5% 39.5% 37.0%
-2.5% -1.8% p; 38.6%
NM
49.6% 49.4% 61.4%
11.9% 7.8% 53.5%
NV
48.7% 48.7% 50.4%
1.8% 10.1% 53.8%
UT
26.7% 27.1% 21.4%
-5.7% 6.4% ; 29.9%
WY*
29.7% 29.7% 23.8%
-5.9% 4.3% ; 31.9%
Final
Initial Late Change
WPE Exit
Far
West
AK
36.8% 36.2% 39.0%
2.8% 9.6% 41.7%
AZ
44.7% 44.7% 44.7%
-0.1% 4.6% ; 47.0%
CA
55.0% 55.2% 54.4%
-0.8% 10.9% p; 60.6%
HI*
54.4% 54.4% 82.6%
28.3% 4.7% 56.8%
OR
52.1% 52.0% 54.6%
2.6% 0.0% 52.1%
WA
53.6% 53.5% 57.7%
4.2% 8.4% 57.9%
State Recorded Votes
(in thousands)
Final
Initial
Late
TOTAL KERRY
BUSH OTHER TOTAL
KERRY BUSH NADER
TOTAL KERRY BUSH Other
122294 59028 62041
1224 116654 56404
59834 414 5640
2624 2207 810
East
26421 14744 11361
316 25262
14112 10980
170 1159
632 381 146
Midwest 32404
15470 16670 264
31960 15320 16552
87 444
150 117 177
South
37662 15943 21436
284 37142
15790 21261
90 521
153 175 194
West
5936 2437
3404 96
5699 2360
3298 41
238 76
106 56
Far West 19870
10435 9171
264 16592
8822 7743
26 3278
1613 1428 238
East
CT
1579 857
694 27
1544 846 685
13 35
11
9 15
DC*
228 203
21 3
226 203
21
1
2
0
0 2
DE*
375 200
172 3
374 200 172
2
2
0
0 1
MA
2912 1804
1071 37
2861 1794
1067 0
51 10
4 37
MD
2387 1334
1025 27
2186 1224
952 11
200 111
73 17
ME*
741 397
330 14
734 395 330
8
7
1
0 5
NH*
678 341
331 6
675 340 331
4
2
0
0 2
NJ
3612 1911
1670 30
3405 1799
1587 19
206 112
83 12
NY
7391 4314
2963 114
6892 3993
2796 104
499 321
167 11
PA
5770 2938
2794 38
5643 2886
2757 0
127 52
37 38
RI
437 260
169 8
413 247 162
4
24 12
7 4
VT*
312 184
121 7
309 184 121
4
4
0
0 3
Final
Initial
Late
TOTAL KERRY
BUSH OTHER TOTAL
KERRY BUSH NADER
TOTAL
KERRY BUSH Other
122294 59028 62041
1224 116654 56404
59834 414 5640
2624 2207 810
Midwest
IA
1507 742
752 13
1486 733 747
6
21
9
5 7
IL
5274 2892
2346 37
5208 2871
2337 0
67 21
9 37
IN
2468 969
1479 20
2435 961 1474
0
33
8
5 20
KS
1188 435
736 16
1147 421 718
9
40 14
19 7
OH
5628 2741
2860 27
5456 2660
2796 0
172 82 64
27
MI
4839 2479
2314 46
4810 2475
2311 24
29
4
3 22
MN
2828 1445
1347 37
2807 1444
1345 19
21
1
2 18
MO
2731 1259
1456 16
2707 1254
1453 0
25
5 3
16
ND*
313 111
197 5
310 111 196
4
2
0
1 1
NE
778 254
513 11
762 249 507
6
17
5
6 5
OK*
1464 504
960 0
1464 504 960
0
0
0
0 0
SD
388 149
233 6
386 149 233
4
2
0
0 2
WI
2997 1490
1478 29
2982 1489
1477 16
15
1
1 13
Final
Initial
Late
TOTAL KERRY
BUSH OTHER TOTAL
KERRY BUSH NADER
TOTAL KERRY BUSH Other
122294 59028 62041
1224 116654 56404
59834 414 5640
2624 2207 810
South
AL*
1883 694
1176 13
1876 693
1176 7
8
1
0 6
AR
1055 470
573 12
1037 464 567
6
18
6
6 6
FL
7610 3584
3965 62
7563 3575
3956 33
47
9
9 29
GA
3302 1366
1914 21
3235 1345
1890 0
67 21
24 21
LA
1943 820
1102 21
1928 819 1102
7
15
1
0 14
KY*
1796 713 1069
14 1790
712 1069
9
6 0
1 5
MS
1152 458
685 9
1118 445 669
3
35 13
16 6
NC
3501 1526
1961 14
3395 1484 1911
0 106
42 50
14
SC
1618 662
938 18
1580 650 924
5
38 11
14 13
TN*
2437 1036
1384 16
2437 1036
1384 16
0
0 0
0
VA
3198 1455
1717 27
3095 1417
1678 0
103 37
39 27
WV
756 327
424 6
744 322
418 4
12
4
6 2
TX
7411 2833
4527 51
7344 2826
4518 0
67
7
8 51
Final
Initial
Late
TOTAL KERRY
BUSH OTHER TOTAL
KERRY BUSH NADER
TOTAL KERRY BUSH Other
122294 59028 62041
1224 116654 56404
59834 414 5640
2624 2207 810
West
CO
2130 1002
1101 27
2018 950
1056 12
112 52
45 15
ID*
598 181
409 8
589 181
408 0
9
0
1 8
MT*
450 174
266 11
445 173 265
6
5
0
1 5
NM
756 371
377 8
742 365
373 4
14
6
4 4
NV
830 397
419 14
813 393 415
5
16
4
4 9
UT
928 241
664 23
851 227 613
11 77
14 51
12
WY*
243 71
168 5
240 71
167 3
3
0
1 2
Far
West
AK
313 111
191 11
242 86 152
4
71 25
39 7
AZ
2013 894
1104 15
1644 735
908 0
369 158
196 15
CA
12420 6745
5510 165
9831 5427
4403 0
2589 1318 1106
165
HI*
429 232
194 3
425 231 194
0
4
0
0 3
OR
1837 943
867 27
1714 891 823
0 123
52 44
27
WA
2859 1510
1305 44
2736 1452
1262 22
123 58
43 22
Calculated True Vote
Late Share Recorded
+Unctd = True Vote
Kerry
2.65 53.0% 64.79
2.58 67.37 53.6%
Bush
2.21 44.0% 53.80
0.79 54.59 43.4%
Other
0.15 3.0%
3.71 0.07 3.78
3.0%
Total
5.01 100%
122.30 3.45 125.74 100%
Election Calculator
Assumptions:
Uncounted Votes
Cast
Census Uncounted
2004
2.74% 125.74 3.45
2000
4.86% 110.80 5.38
Uncounted Vote share
2004
2000
Kerry
75% Gore 75%
Bush
23% Bush 20%
Other
2% Nader 5%
2000 Annual Voter Mortality
Total
1.22%
Gore share
50.4%
2000 Voter Turnout in
2004
Gore
95%
Bush
95%
Other
95%
2000
Recorded
Voted
Rec Unctd
Cast Deaths Alive
Gore
51.00 4.04 55.04
2.71 52.33
Bush
50.46 1.08 51.53
2.47 49.07
Other
3.96 0.27
4.23 0.21
4.02
Total
105.42 5.38 110.80
5.38 105.42
2004 Calculated
Turnout
Voted Weight Kerry
Bush Other
DNV
- 255.59 20.4%
57% 41% 2%
Gore
95% 49.71 39.5%
91% 8% 1%
Bush
95% 46.61 37.1%
10% 90% 0%
Other
95% 3.82
3.0% 64%
17% 19%
100.15 125.74 100% 53.23%
45.39% 1.38%
66.93 57.07 1.74
True Vote Analysis: Models,
Counties, Machines
County Vote
Database (2000-2004)
http://www.geocities.com/electionmodel/CountyVoteDatabase.htm
Note:
County vote data are not the final recorded totals.
Gore (13.2%) and Kerry (7.4%) margins were much higher in the missing, late votes. Why?
2000
Total GORE
BUSH NADER GORE
BUSH NADER
Recorded
104.30 51.0 50.46 2.83
48.9% 48.4% 2.7%
Database
101.73 49.55 49.34 2.85
48.7% 48.5% 2.8%
Difference
2.57 1.46 1.12
-.15 56.9% ; 43.7% -0.6%
Pct Total
2.46% 2.86% 2.22% -0.53%
0.20% -0.12% -0.08%
2004
Total KERRY
BUSH OTHER KERRY
BUSH OTHER
Recorded
122.29 59.03 62.04 1.22 48.27%
50.73% 1.00%
Database
116.64 56.40 59.83 .407
48.35% 51.30% 0.35%
Difference
5.65 2.63 2.21
.813 46.50% 39.10% 14.40%
Pct Total
4.62% 4.45% 3.56% 66.64% -0.09%
-0.56% 0.65%
_____________________________________________________________________
Counties with over 200,000 votes where Bush's net percentage margin
increased the most from 2000
http://www.usatoday.com/news/politicselections/vote2004/countymap.htm
State
County
GORE BUSH
KERRY BUSH Net Vote Net Pct
CA
Fresno
43.7% 53.4% 41.7%
58.3% 15,759 6.9%
CA
Riverside 45.6%
51.8% 41.6% 58.4%
49,470 10.4%
CA
San Bernard 48.0% 49.3%
43.7% 56.3% 45,122 11.3%
FL
Brevard 44.9%
53.1% 41.7% 57.9%
24,818 7.9%
FL
Broward 67.7%
31.1% 64.6% 34.8%
577 6.8%
FL
Palm Beach 63.8%
36.2% 60.6% 39.2%
977 6.2%
FL
Polk
44.9%
53.9% 40.9% 58.7%
22,454 8.8%
FL
Volusia 53.3%
45.1% 50.6% 49.0%
11,172 6.5%
HI
Honolulu 55.0%
39.9% 51.4% 48.6%
29,968 12.3%
MD
An Arundl 45.2%
52.1% 43.2% 56.3%
15,760 6.2%
MI
Genesee 63.0%
35.1% 60.2% 39.4%
8,703 7.1%
NJ
Bergen
55.5% 41.9% 51.7%
47.8% 32,297 9.7%
NJ
Camden
64.7% 31.8% 62.5%
37.0% 8,129 7.4%
NJ
Middlesex 60.1%
36.5% 56.3% 43.1%
22,636 10.4%
NJ
Monmouth 50.6%
46.0% 44.6% 54.7%
41,656 14.7%
NJ
Ocean
47.6% 48.9% 38.9%
60.4% 48,420 20.2%
NY
Bronx
86.0% 11.9% 82.7%
16.7% -3,055 8.0%
NY
Brooklyn 79.9%
16.1% 74.3% 24.8%
43,936 14.4%
NY
Nassau
57.6% 38.7% 52.3%
46.7% 71,250 13.3%
NY
Queens
74.2% 22.5% 71.2%
28.0% 23,052 8.5%
NY
Suffolk 53.2%
41.8% 49.1% 48.8%
59,633 11.2%
TN
Davidson 58.9%
41.0% 54.9% 44.7%
11,625 7.6%
_____________________________________________________________________
Largest Recorded Bush County
Vote Gains
Minimum 30,000 increase from 2000 to 2004
Vote share = Bush share of county vote in
2004
Increase Votes = Bush increase in recorded
votes from 2000
Pct Change = Bush percentage increase in
votes from 2000
Net Gain = Bush percent change from Bush 2000
– Kerry percent change from Gore 2000
Vote Increase Pct
Net
Voting
ST
County Precincts
Share Votes Change
Gain Incidents Method
AZ
Maricopa
1004 57.2% 145,697
27.0% 8.6%
32 Optical
CA
Los Angeles 4963
36.4% 142,610 14.9%
10.6% 36 Optical
CA
Riverside 1093
58.4% 49,812 18.9%
18.7% 2 DRE
CA
San Diego 3568
52.7% 46,329 10.5%
3.7% 9
Optical
FL
Brevard
177 57.9% 37,653
24.6% 13.0%
4 Optical
FL
Broward
618 34.8% 66,376
27.2% 12.7%
56 DRE
FL
Miami-Dade 614
46.8% 69,080 19.3%
0.2% 54 DRE
FL
Duval
268 57.9% 67,153
30.6% -1.2% 12
Optical
FL
Hillsboro
320 53.2% 63,846
26.1% 5.6%
21 DRE
FL
Lee
150
60.1% 38,273 26.5%
4.5% 0 Optical
FL
Orange
232 49.7% 57,873
30.1% 2.7% 16
Optical
FL
Palm Beach 531
39.2% 58,943 27.8%
10.1% 88 DRE
FL
Pasco
132 54.5% 34,616
33.5% 15.6%
0 DRE
FL
Pinellas
345 49.8% 40,804
18.1% 7.1%
6 DRE
FL
Polk
163
58.7% 33,237 26.9%
14.4% 5
Optical
FL
Seminole
133 58.2% 32,449
30.0% 6.9%
4 Optical
GA
Cobb
152
62.5% 32,712 18.9%
2.5% 2
DRE
GA
Gwinnett
133 66.3% 38,257
23.9% -0.6%
2 DRE
HI
Honolulu
214 48.6% 42,859
29.7% 21.3%
2 Optical
IL
Cook
5016
29.4% 50,230 8.5%
-0.4% 84 &nnbsp; Punch
IL
Will
352
52.8% 33,592 26.0%
4.4% 4
Other
MI
Macomb
406 50.4% 37,063
18.4% 6.6%
1 Lever
MI
Oakland
608 49.5% 42,285
13.4% 1.3% 10
Punch
MI
Wayne
1511 30.0% 37,960
14.8% -0.9% 59
DRE
NV
Clark Co
677 47.3% 82,500
32.6% 2.7%
24 DRE
NJ
Bergen
554 47.8% 34,462
19.3% 18.2% 4
DRE
NJ
Monmouth
428 54.7% 42,999
26.6% 25.6%
0 Lever
NJ
Ocean
292 60.4% 41,758
29.0% 36.2%
0 DRE
NY
Brooklyn
1888 24.8% 67,235
42.9% 38.0%
63 Lever
NY
Nassau
1070 46.7% 64,523
23.1% 25.3% 2
Lever
NY
Queens
1470 28.0% 41,325
26.4% 21.8%
23 Lever
NY
Suffolk
1006 48.8% 77,671
25.7% 19.8%
0 Lever
NY
Westchester 948
40.7% 38,923 25.4%
7.3% 6
Lever
NC
Wake
169
51.5% 30,069 17.4%
-6.7% 1 &nbbsp;
Optical
OH
Cuyahoga
1506 33.2% 30,935
14.3% -6.8%
75 Punch
OH
Franklin
760 45.9% 41,170
17.6% -11.3%
82 DRE
OK
Oklahoma
273 64.2% 35,629
20.4% 4.3%
0 Optical
PA
Allegheny 1309
42.5% 33,311 12.4%
2.6% 31 Lever
PA
Bucks
298 48.6% 31,835
20.7% 2.5% 3
Lever
PA
Montgomery 405
44.2% 30,938 18.0%
-2.3% 5 &nbbsp; DRE
TX
Bexar
626 55.3% 44,226
17.0% 5.0% 6
DRE
TX
Collin
127 71.7% 44,854
25.9% -11.3% 0
DRE
TX
Denton
126 70.4% 38,403
27.3% -4.8%
0 Paper
TX
Harris
935 55.1% 54,874
9.5% -2.6% 37
DRE
TX
Tarrant
535 62.8% 62,451
17.9% 1.7% 2
Optical
UT
Salt Lake
688 60.5% 38,415
18.4% 0.1%
0
WA
King
2707
34.1% 44,058 15.2%
-7.2% 0 &nbbsp;
Optical
WA
Pierce
635 48.5% 39,987
27.5% 8.9% 0
Optical
_____________________________________________________________________
Counties where Bush’s
recorded vote increased by at least:
1) 20,000 over his 2000 vote;
2) 16% over his 2000 vote;
3) 2% greater than Kerry's percentage increase over Gore’s recorded vote.
Recorded vote (000)
Chg
from 2000
%Change Net
ST
County
Kerry Bush Kerry
Bush Kerry Bush
Kerry Bush
Bush Incidents
Total
9244
9062 46.7% 52.8%
1161 2226
15.4% 26.7%
11.3% 607
AZ
Maricopa
404 540
42.8% 57.2%
74 146
18.4% 27.0% 8.6% 32
Optical
AZ
Pima
154
138 52.7%
47.3% 16
23 10.6%
16.3% 5.7% 8 Optical
CA
Placer
50 85
36.9% 63.1%
11 22
21.8% 25.8% 4.0%
0 Optical
CA
Riverside 188
263 41.6%
58.4% 0
50 0.2%
18.9% 18.7% 2 DRE
FL
Brevard
110 153
41.7% 57.9%
13 38
11.7% 24.6% 13.0% 4
Optical
FL
Broward
452 244
64.6% 34.8%
66 66
14.5% 27.2% 12.7% 56 DRE
FL
Clay
19
62 23.3%
76.4% 4
20 22.6%
32.6% 10.0% 0 Optical
FL
Escambia
48 93
33.9% 65.7%
7
20 15.1%
21.8% 6.7% 1 Optical
FL
Hillsboro 213
245 46.4%
53.2% 44 64
20.5% 26.1% 5.6% 21
DRE
FL
Lake
48
74 39.1%
60.3% 12
24 24.2%
32.8% 8.6% 3 DRE
FL
Lee
94
144 39.3%
60.1% 21
38 22.0%
26.5% 4.5% 0 Optical
FL
Manatee
61 81
42.8% 56.8%
12 23
19.7% 28.7% 9.0%
0 Optical
FL
Marion
57 81
41.1% 58.4%
13 26
22.0% 32.1% 10.2% 2
Optical
FL
Orange
193 192
50.0% 49.7%
53 58
27.4% 30.1% 2.7% 16
Optical
FL
Palm Beach 328
212 60.6% 39.2%
58 59
17.7% 27.8% 10.1% 88 DRE
FL
Pasco
85 103
44.7% 54.5%
15 35
17.9% 33.5% 15.6% 0
DRE
FL
Pinellas
225 226
49.7% 49.8%
25 41
11.0% 18.1% 7.1%
6 DRE
FL
Polk
86
124 40.9%
58.7% 11
33 12.5%
26.9% 14.4% 5 Optical
FL
Sarasota
88 105
45.5% 53.9%
16 22
17.6% 20.6% 3.0%
2 DRE
FL
Seminole
77 108
41.4% 58.2%
18 32
23.1% 30.0% 6.9%
4 Optical
FL
Volusia
115 112
50.6% 49.0%
18 29
15.6% 26.2% 10.5% 8
Optical
GA
Cobb
104
173 37.5%
62.5% 17
33 16.4%
18.9% 2.5% 2 DRE
HI
Honolulu
152 144
51.4% 48.6%
13 43
8.5% 29.7% 21.3%
2 Optical
IL
Will
115
129 47.2%
52.8% 25
34 21.6%
26.0% 4.4% 4
MD
An Arundl
95 124
43.2% 56.3%
9 25
9.6% 20.1% 10.5%
0 DRE
MD
Baltimore
170 155
52.0% 47.5%
16 28
9.1% 18.1%
9.0% 0 DRE
MI
Macomb
196 201
49.0% 50.4%
23 37
11.8% 18.4% 6.6%
1 Lever
MN
Anoka
80 92
46.4% 53.1% 12
23 15.2%
24.6% 9.4% 2 Optical
MO
Jackson
181 130
58.3% 41.7%
21 25
11.5% 19.6% 8.1%
0 Punch
MO
St. Charles 67
96 80.8%
19.2% 13 24
19.5% 24.7% 5.2%
0 Optical
NE
Douglas
81 118
40.3% 59.0%
17 30
21.1% 25.0% 3.9%
0
NV
Clark Co
280 253
52.2% 47.3%
83 83
29.9% 32.6% 2.7% 24
DRE
NJ
Bergen
193 178
51.7% 47.8%
2
34 1.1%
19.3% 18.2% 4 DRE
NJ
Burlington 104
90 53.3%
46.2% 9 22
8.6% 24.2% 15.7%
1 DRE
NJ
Middlesex 156
119 56.3%
43.1% 5
28 3.4%
23.4% 20.0% 2 DRE
NJ
Monmouth
132 162
44.6% 54.7%
1 43
1.0% 26.6% 25.6%
0 Lever
NJ
Ocean
93 144
38.9% 60.4% -7
42 -7.2%
29.0% 36.2% 0 DRE
NM
San Miguel 21
22 48.3%
51.2% 15 20
69.2% 90.1% 21.0% 1
DRE
NY
Brooklyn
468 157
74.3% 24.8%
23 67
5.0% 42.9% 38.0% 63
Lever
NY
Erie
231
171 56.2%
41.6% 13
28 5.7%
16.2% 10.5% 2 Lever
NY
Monroe
166 159
50.4% 48.1%
14 26
8.3% 16.6%
8.2% 0 Lever
NY
Nassau
312 279
52.3% 46.7%
-7 665
-2.2% 23.1% p; 25.3% 2
Lever
NY
Queens
398 157
71.2% 28.0%
18 41
4.6% 26.4% 21.8% 23
Lever
NY
Staten Island 63
84 42.3%
56.9% -6
24 -9.9% 28.8%
38.7% 0
NY
Suffolk
303 302
49.1% 48.8%
18 78
5.9% 25.7% 19.8%
0 Lever
NY
Westchester 218
153 57.9%
40.7% 40
39 18.1%
25.4% 7.3% 6 Lever
OH
Butler
54 107
33.7% 66.3%
10 23
17.6% 21.6% 4.0%
0 Punch
OK
Oklahoma
97 175
35.8% 64.2%
16 36
16.1% 20.4% 4.3%
0 Optical
OK
Tulsa
90 163
35.6% 64.4% 9
29 9.5%
17.9% 8.4% 3 Optical
PA
Bucks
162 153
51.4% 48.6%
30 32
18.2% 20.7% 2.5%
3 Lever
PA
Philadelphia 525
126 80.7%
19.3% 83
26 15.8%
21.1% 5.3%
196 DRE
PA
York
64
115 35.7%
64.3% 12
27 18.3%
23.7% 5.4% 0 Lever
TN
Davidson
132 108
54.9% 44.7%
12 24
9.4% 22.3% 13.0%
1 DRE
TN
Knox
66
111 37.2%
62.4% 5
24 7.8%
21.8% 14.0% 0 DRE
TX
Bexar
210 260
44.7% 55.3%
25 44
12.0% 17.0% 5.0%
6 DRE
TX
Montgomery 29
104 21.5%
78.5% 5 24
18.5% 22.8% 4.3%
0 Optical
UT
Davis
20 84
19.3% 79.8%
2
20 7.7%
23.9% 16.2% 0
VA
Bedford City 9
22 29.2%
70.8% 8 21
88.1% 94.2% 6.1%
0 Lever
VA
Virginia Beach 71
104 40.5%
59.5% 8 20
11.9% 19.3% 7.5%
0 Lever
WA
Pierce
152 146
50.7% 48.5%
28 40
18.5% 27.5% 8.9%
0 Optical
WA
Spokane
84 107
43.5% 55.6%
15 26
17.8% 24.0% 6.2%
1 Optical
_____________________________________________________________________
106 Counties with 100,000+
votes in 2004 and at least a 2% increase in Bush margin from 2000
2000
2004
Chg from 2000
Bush
ST
County
Total GORE
BUSH Total KERRY
BUSH
KERRY BUSH Increase
Total
25122
28342
1087 2712 in Margin
AL
Jefferson 271.8
47.8% 51.0% 291.6
45.3% 54.3% 2.3
20.0 5.9% Optical
AL
Madison 112.0
43.0% 55.5% 130.4
40.4% 59.2% 4.5
15.1 6.3% Optical
AL
Mobile
138.4 42.4% 56.5%
156.3 40.8% 58.9%
5.1 13.8
4.0% Optical
AZ
Maricopa 742.4
44.4% 53.1% 943.7
42.8% 57.2% 74.4
145.7 5.7% Optical
AZ
Pima
265.2 52.0%
43.7% 292.7 52.7%
47.3% 16.4
22.6 2.9% Optical
CA
Fresno
190.9 43.7% 53.4%
206.2 41.7% 58.3%
2.6 18.4
6.9% Optical
CA
Kern
163.1 36.6%
61.5% 175.7 32.5%
67.5% -2.5
18.3 10.0% Optical
CA
Los Angeles 2,488
64.2% 32.6% 2625
63.6% 36.4% 72.0 142.6
4.3% Optical
CA
Orange
827.5 40.9% 56.3%
756.0 39.7% 60.3% -37.6
-10.7 5.0% ; DRE
CA
Placer
105.4 36.7% 59.5%
134.1 36.9% 63.1%
10.8 21.8
3.4% Optical
CA
Riverside 411.5
45.6% 51.8% 451.0
41.6% 58.4% 0.3
49.8 10.4% DRE
CA
Sacramento 389.8
49.9% 45.9% 347.3
50.6% 49.4% -18.9 -7.5
2.8% Optical
CA
San Bernard 419.9
48.0% 49.3% 401.7
43.7% 56.3% -26.2
18.9 11.3% DRE
CA
San Diego 789.2
46.6% 49.8% 834.0
47.3% 52.7% 27.1
46.3 2.1% Optical
CA
San Joaquin 151.5
48.0% 49.5% 162.2
46.2% 53.8%
2.1 12.4
6.2% Optical
CA
Stanislaus 105.4
45.3% 52.1% 120.6
41.2% 58.8%
1.9 16.0
10.8% Optical
CA
Ventura 227.9
48.3% 48.0% 212.4
48.7% 51.3% -6.6
-0.5 2.9% & Punch
CO
Adams
105.8 51.1% 44.9%
128.3 50.7% 48.7%
11.0 15.0
4.2% Optical
FL
Alachua
84.7 55.9% 40.3%
110.5 56.4% 43.1%
15.0 13.5
2.3% Optical
FL
Brevard 217.0
44.9% 53.1% 264.2
41.7% 57.9% 12.8
37.7 7.9% Optical
FL
Broward 571.0
67.7% 31.1% 699.9
64.6% 34.8% 65.8
66.4 6.8% DRE
FL
Escambia 115.7
35.4% 63.1% 142.2
33.9% 65.7% 7.3
20.4 4.0% Optical
FL
Hillsboro 357.8
47.4% 50.5% 460.0
46.4% 53.2% 43.9
63.8 3.7% DRE
FL
Lake
88.0
41.5% 56.8% 123.3
39.1% 60.3% 11.6
24.4 6.0% DRE
FL
Lee
183.3 40.5%
57.9% 240.2 39.3%
60.1% 20.8
38.3 3.1% Optical
FL
Manatee 109.6
44.9% 52.9% 143.2
42.8% 56.8% 12.1
23.3 6.0% Optical
FL
Marion
101.6 44.0% 54.3%
139.2 41.1% 58.4%
12.6 26.1
6.9% Optical
FL
Palm Beach 422.7
63.8% 36.2% 541.2
60.6% 39.2% 58.0 58.9
6.2% DRE
FL
Pasco
141.5 49.1% 48.5%
189.4 44.7% 54.5% 15.2
34.6 10.4% DRE
FL
Pinellas 395.5
50.7% 46.7% 453.4
49.7% 49.8% 24.7
40.8 4.1% DRE
FL
Polk
167.6
44.9% 53.9% 210.3
40.9% 58.7% 10.8
33.2 8.8% Optical
FL
Seminole 136.8
43.3% 55.3% 185.6
41.4% 58.2% 17.8
32.4 4.7% Optical
FL
Volusia 182.6
53.3% 45.1% 227.8
50.6% 49.0% 18.0
29.2 6.5% Optical
HI
Honolulu 253.9
55.0% 39.9% 296.6
51.4% 48.6% 12.9
42.9 12.3% Optical
IL
Madison
110.3 53.6% 44.3%
122.5 51.6% 48.4%
4.2 10.4
6.0% Punch
IL
St. Clair 99.4
56.0% 42.4% 112.5
55.4% 44.6%
6.7 8.0
2.7% Optical
IL
Will
189.7
47.7% 50.3% 244.5
47.2% 52.8% 25.0
33.6 2.9%
IN
Lake
172.5
63.2% 36.8% 176.7
61.2% 38.8% -0.9
5.1 4.0% DRE
IN
St Joseph 94.5
50.2% 49.8% 107.9
48.8% 51.2% 5.2
8.2 2.8% DRE
KS
Sedgwick 161.0
38.9% 58.2% 168.1
36.5% 62.7% -1.1
11.7 6.8% DRE
LA
Caddo
95.1 50.0% 49.2%
106.2 48.7% 51.1%
4.2 7.5
3.2% DRE
LA E
Baton Rouge 167.7 45.6%
53.1% 182.9 45.0%
54.7% 5.8 10.8
2.1% DRE
LA
Jefferson 177.7
39.6% 59.1% 190.6
37.7% 61.8%
1.5 12.7
4.5% Lever
LA
St Tammany 83.1
27.3% 71.2% 100.2
24.6% 75.0% 1.9
15.9 6.5% DRE
MD
An Arundl 190.5
45.2% 52.1% 220.4
43.2% 56.3%
9.1 24.9
6.2% DRE
MD
Baltimore 290.1
53.3% 43.9% 327.4
52.0% 47.5% 15.5
28.1 4.9% DRE
MD
Harford
86.7 39.4% 58.1%
104.8 35.2% 64.3%
2.8 17.0
10.4% DRE
MI
Genesee 190.1
63.0% 35.1% 213.2
60.2% 39.4% 8.5
17.3 7.1% Optical
MI
Macomb
342.9 50.3% 47.9%
399.0 49.0% 50.4%
23.1 37.1
3.8% Lever
MI
Saginaw
93.4 54.4% 44.1%
102.5 53.5% 46.0%
4.1 6.0
2.8% Paper
MN
Anoka
143.9 47.3% 48.1%
173.1 46.4% 53.1% 12.2
22.6 5.9% Optical
MO
Greene
102.0 40.3% 58.0%
124.5 37.5% 62.5%
5.5 18.7
7.4% Punch
MO
Jackson 269.3
59.5% 38.7% 310.6
58.3% 41.7% 20.8
25.5 4.2% Punch
NE
Douglas 158.8
40.1% 55.8% 200.4
40.3% 59.0% 17.1
29.6 3.0%
NE
Lancaster 99.8
42.0% 52.3% 120.5
42.6% 56.6% 9.5
16.0 3.6%
NJ
Bergen
343.6 55.5% 41.9%
373.0 51.7% 47.8%
2.2 34.5
9.7% DRE
NJ
Burlington 168.1
56.6% 40.6% 195.0
53.3% 46.2% 8.9
21.8 8.8% DRE
NJ
Camden
185.5 64.7% 31.8%
207.7 62.5% 37.0%
9.9 18.0
7.4% Lever
NJ
Essex
250.6 71.6% 26.2%
273.9 70.1% 29.5%
12.6 15.2
4.8% Lever
NJ
Gloucester 105.7 57.3%
39.7% 127.0 52.4%
47.1% 5.9
17.8 12.3% DRE
NJ
Hudson 160.4
70.6% 26.7% 170.0
66.8% 32.7%
0.4 12.7
9.7% DRE
NJ
Mercer
126.4 62.1% 34.6%
139.9 61.2% 38.2%
7.2 9.8
4.5% DRE
NJ
Middlesex 251.0
60.1% 36.5% 277.3 56.3%
43.1% 5.3
27.9 10.4% DRE
NJ
Monmouth 258.0
50.6% 46.0% 295.5
44.6% 54.7% 1.3
43.0 14.7% Lever
NJ
Morris
204.9 42.8% 54.1%
218.4 41.4% 58.0%
2.7 15.9
5.4% DRE
NJ
Ocean
208.5 47.6% 48.9%
238.0 38.9% 60.4% -6.7
41.8 20.2% DRE
NJ
Passaic 147.2
58.3% 39.3% 166.3
55.3% 44.2% 6.1
15.8 8.0% DRE
NJ
Union
176.8 60.7% 36.7%
191.1 58.9% 40.6%
5.3 12.8
5.7% DRE
NY
Albany
130.4 59.7% 34.0%
135.6 60.2% 37.8%
3.8 6.9
3.3% Lever
NY
Bronx
279.0 86.0% 11.9%
317.6 82.7% 16.7%
22.8 19.7
8.0% Lever
NY
Brooklyn 556.9
79.9% 16.1% 630.3
74.3% 24.8% 23.3
67.2 14.4% Lever
NY
Dutchess 105.0
46.7% 47.1% 114.0
46.5% 51.9%
4.0 9.7
4.9% Lever
NY
Erie
383.5
56.8% 37.4% 411.0
56.2% 41.6% 13.3
27.7 4.8% Lever
NY
Monroe
300.4 50.8% 44.1%
330.4 50.4% 48.1%
13.9 26.3
4.4% Lever
NY
Nassau
554.0 57.6% 38.7%
597.1 52.3% 46.7%
-6.7 64.5 &
13.3% Lever
NY
Onondaga 189.6
53.8% 40.9% 198.7
54.1% 44.1% 5.4
10.1 3.0% Lever
NY Orange
117.7
45.8% 49.6% 135.1
43.6% 55.0%
5.1 16.0
7.6% Lever
NY
Queens
511.7 74.2% 22.5%
559.4 71.2% 28.0%
18.3 41.3
8.5% Lever
NY
Rockland 116.8 55.9%
40.2% 121.8 48.7%
49.8% -6.0
13.7 16.8% Lever
NY
Staten Island 133.1 51.8%
45.2% 148.4 42.3%
56.9% -6.2 24.3
21.3%
NY
Suffolk 536.3
53.2% 41.8% 618.3
49.1% 48.8% 18.0
77.7 11.2% Lever
NY
Westchester 306.2
58.4% 37.4% 377.3
57.9% 40.7% 39.5
38.9 3.8% Lever
OH
Butler
130.9 34.1% 63.9%
160.9 33.7% 66.3%
9.5 23.1
2.9% Punch
OK
Oklahoma 220.7
37.0% 63.0% 272.0
35.8% 64.2% 15.7
35.6 2.4% Optical
OK
Tulsa
215.8 37.8% 62.2%
253.6 35.6% 64.4%
8.5 29.3
4.5% Optical
OR
Marion
111.6 44.3% 51.5%
114.1 45.1% 54.9%
2.0 5.2
2.7%
PA
Lackawanna 93.7
60.8% 37.0% 103.9
57.1% 42.9% 2.4
9.9 9.5% Lever
PA
Luzerne 117.3 52.7%
44.4% 133.4 51.5%
48.5% 6.8
12.7 5.4% Lever
PA
North Hampton 102.5 51.3%
45.8% 124.6 50.5%
49.5% 10.3 14.7
4.5% Lever
PA
Westmoreland 154.1 46.4%
52.0% 175.8 43.8%
56.2% 5.5
18.7 6.8% Lever
PA
York
142.8
36.4% 61.2% 178.2
35.7% 64.3% 11.6
27.2 3.8% Lever
TN
Davidson 203.7
58.9% 41.0% 241.0
54.9% 44.7% 12.4 24.1
7.6% DRE
TN
Hamilton 118.6
43.6% 56.2% 136.3
42.0% 57.6% 5.6
11.9 3.0% Optical
TN
Knox
147.7
41.2% 58.6% 177.3
37.2% 62.4%
5.1 24.1
7.8% DRE
TX
Bexar
410.4 45.1% 52.5%
470.1 44.7% 55.3%
25.2 44.2
3.1% DRE
TX
El Paso 144.2
58.1% 39.9% 167.9
56.5% 43.5% 11.1
15.5 5.2% Optical
TX
Galveston 92.6
43.2% 54.4% 105.2
41.7% 58.3%
3.9 10.9
5.3% Optical
TX
Hidalgo
96.7 60.7% 38.4%
114.5 55.1% 44.9%
4.4 14.3
12.2% Lever
TX
Montgomery 105.7
22.0% 76.2% 132.9
21.5% 78.5%
5.3 23.8
2.8% Optical
TX
Nueces
96.8 46.8% 51.5%
103.7 42.8% 57.2% -0.9
9.5 9.7% Optical
UT
Davis
87.6 21.5%
73.3% 105.8 19.3%
79.8% 1.6
20.2 8.7%
UT
Utah
119.8 13.7%
81.7% 108.2 11.0%
87.9% -4.5
-2.9 8.8% &
VA
Virginia Beach 148.3 42.0%
56.4% 174.4 40.5%
59.5% 8.4 20.1
4.5% Lever
WA
Pierce
237.2 52.3% 44.5%
300.1 50.7% 48.5%
28.2 40.0
5.5% Optical
WA
Spokane 156.6
44.2% 52.2% 193.4
43.5% 55.6% 15.0
25.8 4.1% Optical
WI
Brown 106.7
46.0% 50.9% 122.7
44.7% 54.7%
5.8 12.9
5.1%
___________________________________________________________________________________
In every election, millions of
votes are never counted. They represent a significant component of the exit
poll discrepancies. According to the 2000 Census, 110.8m votes were cast but
only 105.4m recorded, leaving 5.4m uncounted. Most were from heavily Democratic
minority districts. Assuming that 75%
were Gore votes, his true margin was close to 3 million, not the 540,000
recorded. But that doesn’t include
likely vote-switching to Bush on DREs and optical scanners. And don’t forget the millions of disenfranchised Democrats who never even
got to the voting booth. Gore’s 540,000
“official” vote margin is a long-running media myth. The 2000 election wasn’t even close, although the media would like us
to believe it was. Only the 5-4 Supreme Court decision was close.
Consider the Florida 2000 fiasco.
Bush “won” by 537 “official” votes before the Supreme Court aborted the recount
– and 175,010 spoiled (under-punched and
over-punched) ballots were never counted. Since approximately 75% were intended
for Gore, he probably won Florida by more than 80,000 votes. And don’t forget the thousands of Butterfly
ballots which fooled Gore voters into voting for Buchanan.
Approximately 54% of the spoiled ballots were in black districts where Gore won 91% of the vote. Assuming the other 46% were evenly split between Gore and Bush, then 126,000 (72%) of the spoiled ballots were Gore votes. And the infamous “Butterfly” ballot caused several thousand Gore voters to mistakenly vote for Buchanan in Palm Beach County. Buchanan's vote share was 0.80% in Palm Beach and just 0.25% elsewhere.
Dan Rather's expose on voting machines in Florida 2000 showed that poor-quality paper used in punch card machines was a major cause of ballot spoilage in highly Democratic precincts. Faulty paper had never before been considered a factor in mechanical voting failure. The spoiled punched cards in Florida 2000 were just the tip of the national iceberg.
Kerry had a 100,000 built-in vote advantage going into the election. He could count on a solid majority (70-80%) of 90,000 returning Nader voters. No more hanging chads from spoiled punch cards; Touch screens and Optical scanners would be used for input to the central tabulators. Furthermore, the Democrats had a remarkable voter registration and GOTV effort. In the strongest Democratic areas, the pace of new registration was 60 percent higher than in 2000,
while it was just 12 percent higher in the heaviest Republican areas. Of course, they had to overcome Bush’s popularity; he had a whopping 48.5% approval rating on Election Day.
The Florida pre-election polls were
trending to Kerry. After allocating the undecided vote, Kerry led the final
10-poll average by 51.1-48.8%. Kerry
was on track to a 200,000 vote win. Bush “won” the official vote by 52.1-47.1%,
a 381,000 margin. Kerry won TS counties
by 51.3-47.8%, but Bush won
OS counties by a whopping 57.0-42.3%. Kerry’s low vote shares in the three most heavily populated Democratic TS counties (Palm Beach, Broward, Dade) are highly suspect. The TS county vote share matched the exit poll to within 1%, but the OS county share deviated by 9% in favor of Bush. The probability was virtually zero that Kerry's TS vote share would exceed his state-wide share by 4.2% and his OS county share by 9%.
Consider Florida’s implausible vote count by machine type and 2004 Voter Registration. The Democrats had a 41.6- 36.1% registration advantage in Touch Screen (TS) counties and a 41.1-39.5% edge in Optical Scan (OS) counties. Bush’s vote share was 131% of his registration share in TS (DRE) counties and 145% in Optiscan counties. For Kerry, the corresponding percentages were 125% and 102%. Was the vote suppressed in TS (Democratic) counties and padded in Optiscan (Republican) counties? Since Bush was first selected in 2000, the Florida Republican vote share to registration share ratio has increased sharply compared to the Democrats.
There has been a dramatic increase in the ratio of Republican (Bush) vote share to registration share:
In 1996, Dole’s vote share was 106% of the registered Republican share.
Clinton’s share was equal (100%) to the registered Democratic share.
In 2000, Bush’s vote share was 128% of the registered Republican share.
Gore’s share was 109% of the registered Democratic share.
In 2004, Bush’s vote share was 138% of the registered Republican share.
Kerry’s share was 114% of the registered Democratic share.
In 2004, the Kerry
vote/registration ratio was 84%; for Bush, it was 102%. Democrats outnumbered
Republicans by 369,000, yet Bush won by 381,000 votes. Bush received 61,000
more votes than registered Republicans; Kerry had 689,000 fewer votes than
registered Democrats. Was the vote suppressed in TS (Democratic) counties and
padded in Optiscan (Republican) counties?
To match the recorded vote, Bush needed 21.3% of the statewide Democratic vote (15% in TS counties and 28% in OS counties). If Kerry won 7% (his National Exit Poll share) of Florida Republicans, he needed just 79% of Democrats in OpScan counties and 86% in TS (DRE) counties to win the state.
So how did Bush do it?
Could it have been the Independent vote?
No,
according to the Composite Florida exit poll, Independents voted 60-38% for
Kerry.
Could it have been late undecided voters who made up their minds in the month prior to the election?
No, undecideds voted 61-38% for Kerry.
Could it have been new voters?
No,
Kerry won first-timers by 58-41%. The Democratic GOTV effort overwhelmed the
Republicans.
Could it have been that voters favored an AWOL “War President” over a Medal of Honor winner?
No,
Bush average approval rating was 48% on Election Day (11 national polls).
Could it have been the 90,000 returning Nader 2000 voters?
No,
the Composite National Exit Poll (13047 respondents) indicated that Kerry led
Bush by 64-17%.
The
Final NEP (13660 respondents) had the spread as 71-21%, a 45,000 vote margin.
Could it have been the voting machines?
Do you believe in magic?
HAVA seat.
Let’s crunch some numbers.
Science works by assuming that the explanation that best fits the data is correct. But new data must always be tested to either strengthen the case or cause it to be rejected in favor of a better explanation.
The unadjusted, "pristine" Florida exit poll had Kerry leading by 51.0-48.2%. The Florida General Exit Poll indicated that the election was a virtual tie (see the Gender demographic). The Final State and National Exit poll demographic weights and/or vote shares are forced to match the recorded vote count. It’s standard operating procedure.
But
a closer analysis shows significant Bush bias in exit poll weights and vote
shares. County registration data, the pre-election polling trend, Bush’s
approval and exit poll demographics indicate that Kerry won Florida by
200-300,000 votes.
The
Florida Exit Poll raised these red flags:
1)
Party-ID weights: Dem 38/Rep 39%
* The actual Florida 2004 Voter Registration
shares were Dem 41.6 / Rep 36.1%
2) Bush
led voters who decided one month before the election by 54-46%.
* Late September pre-election polls indicated
that the race was tied.
* Kerry led voters who decided in the final
month by 61-38%.
3) Bush
approval: 53% (35% strong)
* Actual approval was 48.5% (average of 11
national polls).
4) Urban
Vote Share:
The Florida exit poll indicated Bush led
by 53-46%.
* The 7:33pm National Exit Poll update
indicated that Kerry led by 57-41%.
The
pre-election 10-poll moving average projected Kerry by 51.1-48.8%.
The
unadjusted exit poll (WPE method) had Kerry winning by 51.0-48.2%.
The following post-election models confirmed the pre-election and unadjusted exit polls:
1) Election Calculator:
Final NEP vote shares with weights calculated from the 2000 vote, uncounted votes, voter mortality and 95% turnout of 2000 voters in 2004. Kerry won by 51.4-48.0%, a 260,000 vote margin.
2) DRE (TS) Optical Scan (OS) county registration weight with plausible vote shares.
Kerry won by 52.0-46.8%, a 400,000 vote margin.
3) Uncounted and switched vote adjustments to the final 2004 recorded vote.
Kerry won by 51.3-48.2%, a 240,000 vote margin.
Florida
Recorded Vote (in thousands)
2000 Vote Pct
2004 Vote Pct
Gore 2912 48.8%
Kerry 3584 47.1%
Bush 2913 48.8%
Bush 3965 52.1%
Other 139 2.4%
Other 62 0.8%
Recorded
Vote by County Voting Machine Type
County Vote Kerry Bush Other
Kerry Bush Other
DRE
3.90 51.3% 47.8%
0.9% 2.00 1.86 .04
OS
3.71 42.3% 57.0%
0.7% 1.57 2.11 .03
Total
7.61 47.1% 52.1%
0.8% 3.57 3.98 .06
Florida
General Exit Poll
Bush
wins by 49.6-49.2% (30,000 votes)
Reg Votes Kerry Bush Other Kerry Bush Other
Dem 38% 2.89
86% 13% 1% 2.49 0.38 0.03
Rep 39% 2.97
7% 92% 1% 0.21 2.73 0.03
Ind 23% 1.75
60% 38% 2% 1.05 0.67 0.04
Total 7.61 7.61
49.2% 49.6% 1.2% 3.74 3.77 0.09
Evaluation of Edison/Mitofsky Election System
2004
(see pg.32 for state WPE measures)
Florida
Kerry Bush
IM WPE
51.0% 48.2%
Best GEO
49.2 50.3
Composite
49.3 50.1
Best SPM
48.6 51.0
Recorded
47.1 52.1
IM
WPE
The statewide WPE (Within Precinct Error) is the average difference in margin between the raw, unadjusted exit poll and recorded vote. Florida precincts had an average 7.8% WPE. The unadjusted exit poll result was not provided by E-M in their Evaluation Report. But given the WPE, the raw, unadjusted exit poll shares can be calculated from the recorded vote shares:
Kerry = Final Recorded + .5* WPE = 47.1 + 3.9 = 51.0%.
Bush = Final Recorded – .5* WPE = 52.1 - 3.9 = 48.2%
Best GEO Survey Estimate
The Best GEO is the estimate with
the lowest Standard Error on the Difference (SEDF) using the cumulative
precinct tallies for each candidate.
Prior Estimate
Prior Estimates are based upon pre-election surveys conducted in each state. It is used in combination with the Best Survey Estimate on Election Day to create the Composite Estimate.
Composite Estimate
The Composite is the weighted average of the Prior Estimate and Best Survey Estimate. It is most often the estimate used in the survey weighting process to create the exit poll analysis data on Election Day before the actual vote is reported.View the Florida General Exit Poll demographic calculations below.
Best SPM
The Best SPM is the adjusted estimate computed using actual vote returns for each sampled precinct.
Implausible Bush Vote Shares
The following analysis shows that the Bush Florida vote was implausible. He needed 21.3% of the statewide Democratic vote, 15% in DRE (TS) counties and a whopping 28% in OS counties.
County Mix Votes Kerry Bush Other Kerry Bush Other
DRE
Dem 41.57% 1.62 84% 15% 1% 1.36 0.24 0.02
Rep 36.13% 1.41 6% 93% 1% 0.08 1.31 0.01
Ind 22.30% 0.87 60% 38% 2% 0.52 0.33 0.02
Vote 3.903 3.90 50.5% 48.3% 1.2% 1.97 1.89 0.05
OS
Dem 41.15% 1.53 71% 28% 1% 1.08 0.43 0.02
Rep 39.52% 1.47 5% 94% 1% 0.07 1.38 0.01
Ind 19.33% 0.72 60% 38% 2% 0.43 0.27 0.01
Vote 3.707 3.71 42.8% 56.0% 1.2% 1.59 2.08 0.04
Total
Dem 41.37% 3.15 77.7% 21.3% 1.0% 2.45 0.67 0.03
Rep 37.79% 2.88 5.5% 93.5% 1.0% 0.16 2.69 0.03
Ind 20.85% 1.59 60.0% 38.0% 2.0% 0.95 0.60 0.03
Vote 7.610 7.61 46.7% 52.1% 1.2% 3.56 3.96 0.09
___________________________________________________________________________________________
Model I
Election Calculator
Kerry wins by 51.4-48.0%
(260,000 vote margin)
Assumptions:
Uncounted Votes
Pct Cast Unctd
2004 3.0% 7.813 0.234
2000 2.85% 6.137 0.175
2004 Share 2000 Share
Kerry 75% Gore 75%
Bush 23% Bush 22%
Other 2% Nader 3%
2000 Voter Mortality
Total Voters 1.22%
Gore share 52%
2000 Voter Turnout in 2004
Gore 95%
Bush 95%
Nader 95%
|
|
|
|
|
|
|
|
|
|
|
|
|
|
|
|
|
2000 Recorded |
|
|
|
|
|
2004 Calculated |
|
|||
|
Voted |
Recorded |
Uncounted |
Cast |
Deaths |
Alive |
|
Turnout |
Voted |
Weight |
Kerry |
Bush |
Other |
|
DNV |
|
|
|
|
|
|
DNV |
2.27 |
29.0% |
54% |
45% |
1% |
|
Gore |
2.91 |
0.13 |
3.04 |
0.16 |
2.89 |
|
95% |
2.74 |
35.1% |
90% |
10% |
0% |
|
Bush |
2.91 |
0.04 |
2.95 |
0.14 |
2.81 |
|
95% |
2.67 |
34.2% |
9% |
91% |
0% |
|
Nader |
0.14 |
0.01 |
0.14 |
0.01 |
0.14 |
|
95% |
0.13 |
1.6% |
64% |
19% |
17% |
|
|
|
|
|
|
|
|
|
|
|
|
|
|
|
Total |
5.96 |
0.17 |
6.14 |
0.30 |
5.84 |
|
5.55 |
7.81 |
100% |
51.41% |
48.02% |
0.57% |
|
|
|
|
|
|
|
|
|
|
7.81 |
4.02 |
3.75 |
0.04 |
|
|
|
|
|
|
|
|
|
|
|
|
|
|
|
|
|
|
|
|
|
|
|
|
|
|
||
|
|
|
|
|
|
|
|
|
|
|
|
|
|
|
|
|
|
|
|
|
|
|
|
|
|
|
|
|
|
|
Kerry Vote Share |
|
|
|
|
Kerry Vote Share |
|
||||
|
|
|
|
|
|
|
|
|
|
|
|
|
|
|
Gore share of |
Bush 2000 Turnout: |
95.0% |
|
|
Kerry share of |
Bush 2000 voters: |
9.0% |
|
||||
|
Uncounted |
|
Gore Voter Turnout |
|
|
|
Gore voters |
New voters (DNV in 2000) |
|
||||
|
51.4% |
91% |
93% |
95% |
97% |
99% |
|
51.4% |
50% |
52% |
54% |
56% |
58% |
|
85% |
51.0% |
51.3% |
51.6% |
51.8% |
52.1% |
|
94% |
51.6% |
52.2% |
52.8% |
53.4% |
54.0% |
|
80% |
51.0% |
51.2% |
51.5% |
51.8% |
52.0% |
|
92% |
50.9% |
51.5% |
52.1% |
52.7% |
53.3% |
|
75% |
50.9% |
51.1% |
51.4% |
51.7% |
51.9% |
|
90% |
50.2% |
50.8% |
51.4% |
52.0% |
52.6% |
|
70% |
50.8% |
51.1% |
51.3% |
51.6% |
51.9% |
|
88% |
49.5% |
50.1% |
50.7% |
51.3% |
51.9% |
|
65% |
50.7% |
51.0% |
51.2% |
51.5% |
51.8% |
|
86% |
48.8% |
49.4% |
50.0% |
50.6% |
51.2% |
|
|
|
|
|
|
|
|
|
|
|
|
|
|
|
|
|
Kerry Margin |
|
|
|
|
|
Kerry Margin |
|
|
||
|
|
|
|
|
|
|
|
|
|
|
|
|
|
|
0.26 |
91% |
93% |
95% |
97% |
99% |
|
0.26 |
50% |
52% |
54% |
56% |
58% |
|
85% |
0.21 |
0.25 |
0.29 |
0.33 |
0.38 |
|
94% |
0.30 |
0.39 |
0.48 |
0.57 |
0.67 |
|
80% |
0.19 |
0.24 |
0.28 |
0.32 |
0.36 |
|
92% |
0.19 |
0.28 |
0.37 |
0.46 |
0.56 |
|
75% |
0.18 |
0.22 |
0.26 |
0.31 |
0.35 |
|
90% |
0.08 |
0.17 |
0.26 |
0.35 |
0.45 |
|
70% |
0.17 |
0.21 |
0.25 |
0.29 |
0.33 |
|
88% |
(0.03) |
0.06 |
0.15 |
0.25 |
0.34 |
|
65% |
0.15 |
0.20 |
0.24 |
0.28 |
0.32 |
|
86% |
(0.14) |
(0.05) |
0.04 |
0.14 |
0.23 |
|
|
|
|
|
|
|
|
|
|
|
|
|
|
Model II – Adjusted Florida General Exit Poll (Composite)
County Registration Weights and Vote shares
Unadjusted
Exit Poll
The WPE (Within Precinct Error) is the average difference in margin between the raw, unadjusted exit poll and the recorded vote. Kerry won the unadjusted exit poll by 51.0-48.2% (210,000 votes).
Composite Estimate
The Composite is the adjusted weighted average of the Prior Estimate and Best Survey Estimate.
Florida
General (Composite) Exit Poll
Bush won
the poll by 49.6-49.2% (30,000 votes)
Reg Votes Kerry Bush Other Kerry Bush Other
Dem 38% 2.89
86% 13% 1% 2.49 0.38 0.03
Rep 39% 2.97
7% 92% 1% 0.21 2.73 0.03
Ind 23% 1.75
60% 38% 2% 1.05 0.67 0.04
Total 7.61 7.61
49.2% 49.6% 1.2% 3.74 3.77 0.09
Adjust
Exit Poll weights to actual voter registration shares
Kerry
wins by 50.7-48.1% (200,000 votes)
Mix
Votes Kerry Bush Other Kerry Bush Other
Dem 41.37% 3.15 86% 13% 1% 2.71 0.41 0.03
Rep 37.79% 2.88 7% 92% 1% 0.20 2.65 0.03
Ind 20.85% 1.59 60% 38% 2% 0.95 0.60 0.03
Vote
7.610 7.61 50.73% 48.06% 1.21% 3.86 3.66 0.09
Adjust
to plausible DRE and Opscan county vote shares
Kerry
wins by 52.0-46.8% (400,000 votes)
DRE Mix Votes Kerry Bush Other Kerry Bush Other
Dem 41.57% 1.62 90% 9% 1% 1.46 0.15 0.02
Rep 36.13% 1.41 7% 92% 1% 0.10 1.30 0.01
Ind 22.30% 0.87 62% 36% 2% 0.54 0.31 0.02
Vote 3.903 3.90 53.8% 45.0% 1.2% 2.10 1.76 0.05
OS
Dem 41.15% 1.53 87% 12% 1% 1.33 0.18 0.02
Rep 39.52% 1.47 7% 92% 1% 0.10 1.35 0.01
Ind 19.33% 0.72 60% 38% 2% 0.43 0.27 0.01
Vote 3.707 3.71 50.2% 48.6% 1.2% 1.86 1.80 0.04
Total
Dem 41.37% 3.15 88.5% 10.5% 1.0% 2.79 0.33 0.03
Rep 37.79% 2.88 7.0% 92.0% 1.0% 0.20 2.65 0.03
Ind 20.85% 1.59 61.1% 36.9% 2.0% 0.97 0.59 0.03
Vote 7.610 7.61 52.0% 46.8% 1.2% 3.96 3.56 0.09
Sensitivity Analysis I
Calculate Kerry’s Florida vote share and margin over a range of TS and OS county registration/vote share scenarios.
If Kerry won 7% (his National Exit Poll share) of Florida Republicans, then to win the state he needed just 79% of Democrats in OpScan counties and 86% in TS (DRE) counties.
Kerry share of DRE county Democrats
share 86.0% 88.0% 90.0% 92.0% 94.0%
of OS
Cty Kerry Vote share
91% 52.0% 52.4% 52.8% 53.2% 53.7%
89% 51.6% 52.0% 52.4% 52.8% 53.3%
87% 51.2% 51.6% 52.0% 52.4% 52.9%
85% 50.8% 51.2% 51.6% 52.0% 52.5%
83% 50.4% 50.8% 51.2% 51.6% 52.1%
81% 50.0% 50.4% 50.8% 51.2% 51.7%
79% 49.6% 50.0% 50.4% 50.8% 51.3%
Kerry
Vote margin
91% 0.39 0.46
0.52 0.59
0.65
89% 0.33 0.39
0.46 0.52
0.59
87% 0.27 0.33
0.40 0.46
0.53
85% 0.21 0.27
0.34 0.40
0.47
83% 0.15 0.21
0.28 0.34
0.41
81% 0.09 0.15
0.22 0.28
0.35
79% 0.02 0.09
0.15 0.22
0.28
Sensitivity Analysis II
Calculate
Kerry’s Florida vote share for various combination shares of Democrats and
Independents.
Kerry
wins the state if he captures 84% of Democrats and 58% of independents.
Base Case Scenario
Mix Votes Kerry Bush Other Kerry Bush Other
Dem 41.37%
3.15 86% 13% 1% 2.71 0.41 0.03
Rep 37.79%
2.88 7% 92% 1% 0.20 2.65 0.03
Ind 20.85%
1.59 60% 38% 2% 0.95 0.60 0.03
Vote
7.61 7.61 50.7% 48.1% 1.2% 3.86 3.66 0.09
Kerry % Dem
Kerry
84.0% 85.0% 86.0% 87.0% 88.0%
% Ind
Kerry Vote share
64% 50.7% 51.1% 51.6% 52.0% 52.4%
62% 50.3% 50.7% 51.1% 51.6% 52.0%
60% 49.9% 50.3% 50.7% 51.1% 51.6%
58% 49.5% 49.9% 50.3% 50.7% 51.1%
56% 49.1% 49.5% 49.9% 50.3% 50.7%
54% 48.7% 49.1% 49.5% 49.9% 50.3%
Kerry Vote margin
64%
0.20 0.27 0.33 0.39 0.46
62%
0.14 0.20 0.27 0.33 0.39
60%
0.08 0.14 0.20 0.27 0.33
58%
0.01 0.08 0.14 0.20 0.27
56%
(0.05) 0.01 0.08 0.14 0.20
54%
(0.11) (0.05) 0.01 0.08 0.14
____________________________________________________________________________________________
Model III
Uncounted and Switched vote adjustments
Kerry wins by 51.3-48.2%
(241,000 vote margin)
Assumptions:
3.0% of
total votes cast uncounted
176k
uncounted to Kerry (75%)
56k
uncounted to Bush (24%)
251k
Kerry votes switched to Bush (7%)
Total Kerry
Bush Other
Actual 7582 3584 3965 33
Unctd 234
176 56 2
Total 7816 3760 4021 35
Switch 7.0% 251 -251
0
True 7816 4011 3770 35
Share 100% 51.3% 48.2% 0.5%
____________________________________________________________________________________________
Florida Pre-election Polls
Kerry was leading the final moving average
projection by 51.1-48.8%
Projection Moving Average
Date Pollster Kerry Bush Nader Kerry Bush Nader Kerry Bush
23-May Zogby
49 48 1 50.4 48.6 1.0
31-May Rasmussen 39 51 1 45.3 53.7 1.0
06-Jun Zogby
50 48 1 50.7 48.3 1.0
14-Jun Survey
USA
43 50 1 47.2 51.8 1.0
17-Jun Rasmussen 48 44 1 52.9 46.1 1.0
20-Jun Zogby
46 50 1 48.1 50.9 1.0
22-Jun Rasmussen 48 42 1 54.3 44.7 1.0
23-Jun ARG
47 46 1 51.2 47.8 1.0
27-Jun Quinnipiac 43 43 5 49.3 45.7 5.0
30-Jun Rasmussen 48 43 0 54.3 45.7 0.0 50.4 48.3
11-Jul Survey
USA
47 44 0 53.3 46.7 0.0 50.7 48.1
15-Jul ARG
47 44 3 51.2 45.8 3.0 51.3 47.4
21-Jul LA
Times 44 45 2 50.3 47.7 2.0 51.2 47.3
22-Jul Gallup 46 50 1 48.1 50.9 1.0 51.3 47.2
23-Jul Zogby
48 49 1 49.4 49.6 1.0 51.0 47.6
30-Jul Zogby
50 47 2 50.7 47.3 2.0 51.2 47.2
05-Aug ARG
50 43 2 53.5 44.5 2.0 51.1 47.2
10-Aug Quinnipiac 47 41 4 52.6 43.4 4.0 51.3 46.7
21-Aug Zogby
50 49 0 50.7 49.3 0.0 51.4 47.1
22-Aug Gallup 46 48 2 48.8 49.2 2.0 51.2 47.3
24-Aug Rasmussen 47 49 2 48.4 49.6 2.0 50.9 47.5
25-Aug Research2k 46 46 2 50.2 47.8 2.0 50.6 47.7
11-Sep Rasmussen 47 48 1 49.8 49.2 1.0 50.3 47.9
14-Sep Survey
USA
45 51 0 47.8 52.2 0.0 50.0 48.4
16-Sep Rasmussen 47 48 0 50.5 49.5 0.0 50.0 48.5
17-Sep Zogby
48 48 1 50.1 48.9 1.0 50.2 48.4
20-Sep ARG
46 45 2 50.9 47.1 2.0 50.3 48.2
22-Sep Gallup 45 47 2 49.2 48.8 2.0 50.2 48.3
26-Sep Rasmussen 49 48 0 51.1 48.9 0.0 50.0 48.7
27-Sep Gallup 44 49 2 47.5 50.5 2.0 49.6 49.3
29-Sep Rasmussen 47 50 0 49.1 50.9 0.0 49.5 49.4
03-Oct Survey
USA
46 51 0 48.1 51.9 0.0 49.4 49.6
04-Oct Rasmussen 46 52 0 47.4 52.6 0.0 49.3 49.9
05-Oct Mason-Dixon 44 48 0 49.6 50.4 0.0 49.3 50.1
05-Oct ARG
47 45 2 51.2 46.8 2.0 49.4 49.9
05-Oct Zogby
50 49 1 50.0 49.0 1.0 49.6 49.6
05-Oct Rasmussen 45 52 0 47.1 52.9 0.0 49.3 49.9
10-Oct Rasmussen 45 49 0 49.2 50.8 0.0 49.2 50.1
10-Oct Wash
Post
47 47 1 50.5 48.5 1.0 49.2 50.2
14-Oct Rasmussen 46 48 0 50.2 49.8 0.0 49.3 50.3
16-Oct Mason-Dixon 45 48 0 49.9 50.1 0.0 49.2 50.4
17-Oct Survey
USA
50 49 0 50.7 49.3 0.0 49.4 50.3
18-Oct Zogby
49 50 0 49.7 50.3 0.0 49.5 50.2
18-Oct Rasmussen 47 47 0 51.2 48.8 0.0 49.7 49.9
21-Oct Research
2000
48 47 2 50.1 47.9 2.0 50.0 49.6
23-Oct Rasmussen 48 48 0 50.8 49.2 0.0 50.1 49.5
24-Oct Survey
USA
50 48 0 51.4 48.6 0.0 50.1 49.6
25-Oct ARG
49 46 0 52.5 47.5 0.0 50.3 49.5
26-Oct Quinnipiac 44 44 1 51.7 47.3 1.0 50.7 49.0
26-Oct Rasmussen 48 48 0 50.8 49.2 0.0 50.8 48.9
27-Oct Zogby
46 48 0 50.2 49.8 0.0 50.8 49.0
27-Oct NY
Times 48 47 2 50.1 47.9 2.0 50.8 48.8
28-Oct Rasmussen 46 49 0 49.5 50.5 0.0 50.7 48.9
29-Oct Mason-Dixon 45 49 0 49.2 50.8 0.0 50.6 49.0
29-Oct Zogby
47 45 0 52.6 47.4 0.0 50.8 48.7
29-Oct Rasmussen 47 48 0 50.5 49.5 0.0 50.8 48.8
30-Oct Gallup 49 45 0 53.2 46.8 0.0 51.0 48.7
30-Oct Zogby
49 47 0 51.8 48.2 0.0 51.1 48.6
30-Oct Rasmussen 47 49 0 49.8 50.2 0.0 51.0 48.8
31-Oct Opinion
Dyn
49 44 1 53.2 45.8 1.0 51.1 48.6
31-Oct Survey
USA
48 49 0 50.1 49.9 0.0 50.9 48.8
31-Oct Zogby
48 47 0 51.5 48.5 0.0 51.0 48.8
31-Oct Rasmussen 47 50 0 49.1 50.9 0.0 50.9 48.9
01-Nov ARG
50 48 0 51.4 48.6 0.0 51.0 48.9
01-Nov Zogby
48 48 0 50.8 49.2 0.0 51.1 48.8
____________________________________________________________________________________________
Florida 2004 Exit Poll
(Composite)
Party-ID (2743 respondents)
Mix Votes Kerry Bush Other Kerry Bush Other
Dem 38% 2.89
86% 13% 1% 2.49 0.38 0.03
Rep 39% 2.97
7% 92% 1% 0.21 2.73 0.03
Ind 23% 1.75
60% 38% 2% 1.05 0.67 0.04
Total 7.61 7.61
49.2% 49.6% 1.2% 3.74 3.77 0.09
Adjusted
to party registration weights
Dem 41.37% 3.15
86% 13% 1% 2.71 0.41 0.03
Rep 37.79% 2.88
7% 92% 1% 0.20 2.65 0.03
Ind 20.85% 1.59
60% 38% 2% 0.95 0.60 0.03
Vote 7.610
7.61 50.7% 48.1% 1.2% 3.86 3.66 0.09
_____________________________________________________________________
Bush Approval (2409)
Approval Pct Kerry
Bush Other
Strong 35 4 96
0
Approve 18 17 82
1
Disapprove 12 84 13
3
Strong 35 98 1
1
Total 100
48.8 50.3 0.9
3720
3828 69
Adjusted
to 48.5% average approval
Strong 33.0 4 96
0
Approve 15.5 17 82
1
Disapprove 14.5 84
13 3
Strong 37.0 98 1
1
Total 100 52.4 46.7
0.9
7610
3988 3554 69
_____________________________________________________________________
When Decided (2162)
Decided Pct Kerry Bush Other
3days 8 53 45 2
Week 3 70 27 3
Month
12 61 38 1
Before
77 46 54 0
Total 100 49.1 50.6 0.4
7610 3735 3847 28
Adjusted
30+days to 50/50
3days
8 53 45 2
Week
3 70 27 3
Month 12 61 38 1
Before 77 50 50 0
Total 100 52.2 47.5 0.4
7610 3969 3612 28
_____________________________________________________________________
Florida Exit Poll
Demographics
Mix
KERRY BUSH Other Bush change from 2000
GENDER
Male 46 47 52 1 -2
Males shifted to Kerry from Bush?
Female 54 52 48 0 +3
Females shifted to Bush from Gore?
TOTAL 100 49.7 49.8 0.5
GENDER/RACE
WMale 33 42 57 1
WFem 38 46 53 1
NWMale 13 59 40 1
NWFem 16 64 36 0
TOTAL 100 49.3 49.9 0.8
RACE
White 70 44 55 1 -2
Whites move away from Bush?
Black 12 87 12 1 +5
Blacks shifted to Bush by 5%?
Hisp 15 46 54 0 +5
Hispanics shifted to Bush by 5%?
Asian 1 - - -
Other 2 34 66 -
TOTAL 100 48.8 49.4 0.8
AGE
18-29
17 60 39 1 -1
30-44
27 48 51 1 +1
45-59
28 44 55 1 +6 Baby boomers for Bush?
60+
28 49 50 1 -1
TOTAL
100 49.2 49.8 1.0
18-64
81 49 50 1 2
65+
19 51 49 0 -3
TOTAL
100 49.4 49.8 0.8
INCOME
<15k 9 61 38 1
15-30 15 61 37 2
30-50 22 53 46 1
50-75 21 47 52 1
75-100 14 40 60 0
100-150 10 46 54 0
150-200 4 41 58 1
200+ 5 43 56 1
TOTAL 100 50.2 48.9 0.9
<50k 46 57 42 1
50k+ 54 44 55 1
TOTAL 100 50.0 49.0 1.0
50-100 81 52 48 0
100+ 19 44 56 0
TOTAL
100 50.5 49.5 0
EDUCATION
NoHS 3 55 43 2 -4
HighS 20 53 47 0
5 Big Bush gain in HS Grads while
losing the other 80%?
Coll 34 50 49 1
0
ColG 27 46 54 0 -3
PostG 16 48 51 1 -1
TOTAL 100 49.3 50.1 0.6
COLLEGE
No 57 52 48 0
Yes 43 46 53 1
TOTAL 100 49.4 50.2 0.4
IDEOLOGY
Liber 20 82 16 2 -1
Moder 47 59 41 0 -5
Big Moderate shift to Kerry
Cons 33 14 85 1
8 Conservatives overwhelmed the Libs and Mods?
TOTAL 100 48.8 50.5 0.7
FIRST-TIME VOTER
Yes 13 58 41 1
No 87 48 51 1
TOTAL 100 49.3 49.7 1.0
RELIGION
Protestant 51 42 57 1
2
Catholic
27 45 55 0 2
Jewish
6 81 19 0 0
Other
6 71 28 1 -12
None
10 68 30 2 4 Atheists for Bush?
TOTAL
100 49.5 49.7 0.8
FINANCIAL SITUATION
Better 34 16 84 0 48
Worse 28 87 12 1 -50
Same 38 51 48 1 -16
TOTAL 100 49.2 50.2 0.6
DID CANDIDATE CALL YOU?
Kerry 16 81 18 1
Bush 15 13 86 1
Both 20 57 43 1
None 49 48 51 1
TOTAL 100 49.8 49.4 1.0
POPULATION- 5 CATEGORIES
Urban 7 35 65 0
50-500k 19 50 49 1
Suburb 61 52 47 0
10-50k
9 45 54 1
Rural 4 34 66 0
TOTAL 100 49.7 50.0 0.3
POPULATION- 3 CATEGORIES
Urban 26 46 53 1 4
Bush Urban Legend?
Suburb 61 52 48 0 1
Rural 13 42 57 1 1
TOTAL 100 49.1 50.5 0.4
____________________________________________________________________________________________
2000 Recorded Vote by County
County
Precincts Total Gore
Bush Buchanan Nader
Other Gore Bush Buchanan Nader
Totals
5884 5963
2912 2913
17 97
24 48.83% 48.85%
0.29% 1.63%
Alachua
53
86 47
34 0
3
1 55.2%
39.8% 0.3%
3.8%
Baker
8
8
2
6
0
0
0 29.3%
68.8% 0.9%
0.6%
Bay
47 59
19 39
0
1
0 32.1%
65.7% 0.4%
1.4%
Bradford
21
9
3
5
0
0
0 35.5% 62.4%
0.7% 1.0%
Brevard
177
218 97
115 1
4
1 44.6%
52.7% 0.3%
2.0%
Broward
618
573 387
177 1
7
2 67.4%
30.9% 0.1%
1.2%
Calhoun
13
5
2
3 0
0
0 41.7%
55.5% 1.7%
0.8%
Charlotte
63
67 30
35
0 1
0 44.3%
53.0% 0.3%
2.2%
Citrus
35
57 26
30 0
1
0 44.6%
52.0% 0.5%
2.4%
Clay
51 57
15 42
0
1
0 25.5%
72.8% 0.3%
1.0%
Collier
96
92 30
60 0
1
0 32.5%
65.6% 0.1%
1.5%
Columbia
31
19
7
11 0
0
0 38.1%
59.2% 0.5%
1.4%
Miami-Dade
614
625 329
290 1
5
1 52.6%
46.3% 0.1%
0.9%
DeSoto
15
8
3
4 0
0
0 42.5%
54.5% 0.5%
2.0%
Dixie
11
5
2
3
0
0
0 39.1% 57.8%
0.6% 1.6%
Duval
268
265 108
152 1
3
1 40.8%
57.5% 0.2%
1.0%
Escambia
108
117 41
73 1
2
0 35.1%
62.6% 0.4%
1.5%
Flagler
27
27 14
13 0
0
0 51.3%
46.5% 0.3%
1.6%
Franklin
8
5
2
2 0
0
0 44.1%
52.8% 0.7%
1.8%
Gadsden
16
15 10
5 0
0
0 66.1%
32.4% 0.3%
0.9%
Gilchrist
10
5
2
3 0
0
0 35.4%
61.2% 0.5%
1.8%
Glades
13
3
1
2 0
0
0 42.9%
54.7% 0.3%
1.7%
Gulf
14 6
2 4
0
0
0 39.0%
57.8% 1.2%
1.4%
Hamilton
8
4
2
2
0 0
0 43.4%
54.1% 0.6%
0.9%
Hardee
12
6
2
4 0
0
0 37.5%
60.4% 0.5%
1.2%
Hendry
22
8
3
5
0
0
0 39.8%
58.3% 0.3%
1.3%
Hernando
51
65 33
31
0 2
0 50.1%
47.0% 0.4%
2.3%
Highlands
28
35 14
20 0
1
0 40.3%
57.5% 0.4%
1.6%
Hillsboro
320
360 170
181 1
7
2 47.1%
50.2% 0.2%
2.1%
Holmes
16
7
2
5 0
0
0 29.4%
67.8% 1.0%
1.3%
Indian River
41 50
20 29
0 1
0 39.8%
57.7% 0.2%
1.9%
Jackson
27
16
7
9 0
0
0 42.1%
56.1% 0.6%
0.8%
Jefferson
13
6
3
2 0
0
0 53.9%
43.9% 0.5%
1.3%
Lafayette
5
3
1
2 0
0
0 31.5%
66.7% 0.4%
1.0%
Lake 86
89 37
50
0 1
0 41.3%
56.5% 0.3%
1.6%
Lee
150
184 74
106 0
4
1 39.9%
57.6% 0.2%
1.9%
Leon
95
103 61
39
0
2
0 59.6% 37.9%
0.3% 1.9%
Levy
21
13
5
7 0
0
0 42.4%
53.9% 0.5%
2.2%
Liberty
8
2
1
1 0
0
0 42.2%
54.6% 1.6%
0.8%
Madison
11
6
3
3 0
0
0 48.9%
49.3% 0.5%
0.9%
Manatee
135
110 49
58
0 2
0 44.6%
52.6% 0.2%
2.3%
Marion
96
103 45
55 1
2
1 43.4%
53.6% 0.5%
1.8%
Martin
40
62 27
34 0
1
0 42.9%
54.8% 0.2%
1.8%
Monroe
33
34 16
16 0
1
0 48.7%
47.4% 0.1%
3.2%
Nassau
21
24
7
16 0
0
0 29.2%
69.0% 0.4%
1.1%
Okaloosa
48
71 17
52
0 1
0 24.0%
73.7% 0.4%
1.4%
Okeechobee
18
10
5
5
0 0
0 46.6%
51.3% 0.4%
1.3%
Orange
232
280 140
135 0
4
1 50.1%
48.1% 0.0%
1.4%
Osceola
66
56 28
26 0
1
0 50.6%
47.1% 0.3%
1.3%
Palm
Beach 531
433 270
153 3
6
2 62.3%
35.3% 0.8%
1.3%
Pasco
132
143 70
69 1
3
1 48.7%
48.0% 0.4%
2.4%
Pinellas
345
398 201
185 1
10 2
50.3% 46.4%
0.3% 2.5%
Polk
163 169
75 90
1
2
1 44.6%
53.6% 0.3%
1.2%
Putnam
50
26 12
13 0
0
0 46.2%
51.3% 0.6%
1.4%
St. Johns
57
61 20
40
0 1
0 32.1%
65.1% 0.4%
2.0%
St. Lucie
78
78 42
35
0 1
0 53.3%
44.5% 0.2%
1.8%
Santa Rosa
36
50 13
36
0 1
0 25.4%
72.1% 0.6%
1.4%
Sarasota
142
161 73
83
0 4
1 45.3%
51.6% 0.2%
2.5%
Seminole
133
138 59
76
0
2
1 43.0% 55.0%
0.1% 1.4%
Sumter
24
22 10
12 0
0
0 43.3%
54.5% 0.5%
1.4%
Suwannee
16
12
4
8 0
0
0 32.8%
64.4% 0.9%
1.4%
Taylor
14
7
3
4 0
0
0 38.9%
59.6% 0.4%
0.9%
Union
11
4
1
2 0
0
0 36.8%
61.0% 0.9%
0.9%
Volusia
172
184 97
82
0 3
1 53.0%
44.8% 0.3%
1.6%
Wakulla
12
9
4
5 0
0
0 44.7%
52.5% 0.5%
1.7%
Walton
33
18
6
12 0
0
0 30.8%
66.5% 0.7%
1.4%
Washington
15
8
3
5
0
0
0 34.9%
62.3% 1.1%
1.2%
____________________________________________________________________________________________
2000 Recorded Vote by County
Adjusted
for 175,000 uncounted ballots
(2.85% of
6138k total votes cast)
Uncounted
Votes (000):
Gore 126.3
72.1%
Bush
45.0 25.7
Nader
2.6 1.5
Buchanan 0.5 0.3
Other
0.7 0.4
Total 175.1
100%
Allocating
the uncounted ballots, Gore won Florida by a minimum of 80,000 votes
(49.5-48.2%).
This is a
conservative estimate as it does not include butterfly ballots or electronic
vote miscounts.
Unctd
Total Unctd% Adjusted Count (total
votes cast) Adjusted Vote Share
Total Cast Total Gore
Bush Buchanan Nader
Other
Gore Bush
175 6138
2.85% 3039
2958 18
100 23
49.51% 48.19%
Alachua
0.33
86 0.38%
48 34
0.3 3.2 0.8
55.3% 39.8%
Baker
0.14
8 1.69%
2
6 0.1
0.1 0.0
30.1% 68.1%
Bay
0.66
59 1.11%
19
39 0.2 0.8
0.2 32.5% 65.3%
Bradford
0.73
9 7.80%
4
6 0.1
0.1 0.0
38.3% 59.6%
Brevard
1.03
219 0.47%
98 115
0.6 4.5 0.9
44.7% 52.6%
Broward
14.61
588 2.48%
397 181 0.8
7.3 1.7
67.5% 30.8%
Calhoun
0.08
5 1.49%
2
3 0.1
0.0 0.0
42.1% 55.1%
Charlotte
3.16
70 4.51%
32
36 0.2 1.5
0.2 45.6% 51.7%
Citrus
0.22
57 0.38%
26
30 0.3 1.4
0.3 44.7% 51.9%
Clay
0.15
58 0.27%
15
42 0.2 0.6
0.2 25.6% 72.6%
Collier
3.18
95 3.34%
32
61 0.1 1.4
0.3 33.8% 64.3%
Columbia
0.69
19 3.61%
8
11 0.1 0.3
0.2 39.3% 58.0%
Miami-Dade
28.60
654 4.37%
349 297 0.6
5.8 1.3 53.4%
45.4%
DeSoto
0.70
9 8.24%
4
4 0.0
0.2 0.0
45.0% 52.2%
Dixie
0.33
5 6.64%
2
3 0.0
0.1 0.0
41.3% 55.7%
Duval
26.91
292 9.23%
127 159 0.7
3.2 1.4
43.7% 54.5%
Escambia
4.37
121 3.61%
44
74 0.5 1.8
0.5 36.4% 61.3%
Flagler
0.06
27 0.23%
14
13 0.1 0.4
0.1 51.3% 46.5%
Franklin
0.42
5 8.28%
2
3 0.0
0.1 0.0
46.4% 50.6%
Gadsden
2.07
17 12.3%
11
5 0.0
0.2 0.1
66.8% 31.5%
Gilchrist
0.29
6 5.07%
2
3 0.0
0.1 0.1
37.3% 59.4%
Glades
0.37
4 9.98%
2
2 0.0
0.1 0.0
45.8% 51.8%
Gulf
0.41
7 6.27%
3 4
0.1 0.1 0.0
41.1% 55.8%
Hamilton
0.39
4 8.94%
2
2 0.0
0.0 0.0
46.0% 51.6%
Hardee
0.41
7 6.14%
3
4 0.0
0.1 0.0
39.7% 58.3%
Hendry
0.80 9
8.95% 4
5 0.0
0.1 0.0
42.7% 55.4%
Hernando
0.25
65 0.38%
33
31 0.2 1.5
0.2 50.1% 46.9%
Highlands
1.01
36 2.79%
15 20
0.1 0.6 0.1
41.2% 56.6%
Hillsboro
9.17
369 2.48%
176 183 0.9
7.6 1.7
47.7% 49.6%
Holmes
0.14
8 1.84%
2
5 0.1
0.1 0.0
30.2% 67.0%
Indian River
1.94 52
3.76% 21
29 0.1 1.0
0.2 41.1% 56.5%
Jackson
1.16
17 6.63%
8
9 0.1
0.2 0.1
44.1% 54.0%
Jefferson
0.57
6 9.22%
3
3 0.0
0.1 0.0
55.6% 42.2%
Lafayette
0.17
3 6.39%
1
2 0.0
0.0 0.0
34.1% 64.0%
Lake
3.61
92 3.92%
39
51 0.3 1.5
0.3 42.5% 55.2%
Lee
4.57
189 2.42%
77 107
0.3 3.7 0.8
40.7% 56.8%
Leon
0.18
103 0.18%
62
39 0.3 1.9
0.4 59.6% 37.9%
Levy
0.76
13 5.64%
6
7 0.1
0.3 0.1
44.1% 52.3%
Liberty
0.19
3 7.24%
1
1 0.0
0.0 0.0
44.4% 52.6%
Madison
0.48
7 7.23%
3
3 0.0
0.1 0.0
50.6% 47.6%
Manatee
1.41
112 1.26%
50
58 0.3 2.5
0.3 45.0% 52.2%
Marion
3.35
106 3.15%
47
56 0.6 1.9
0.8 44.3% 52.7%
Martin
0.61 63
0.97% 27
34 0.1 1.1
0.2 43.2% 54.5%
Monroe
0.18
34 0.53%
17
16 0.0 1.1
0.2 48.8% 47.3%
Nassau
1.58
25 6.28%
8
17 0.1 0.3
0.1 31.9% 66.3%
Okaloosa
0.77
71 1.07%
17
52 0.3 1.0
0.4 24.5% 73.2%
Okeechobee
0.86
11 8.01%
5
5 0.0 0.1
0.0 48.6% 49.3%
Orange
2.40
278 0.86%
142 135 0.0
3.9 1.1
50.3% 47.9%
Osceola
1.68
57 2.94%
29
27 0.1 0.8
0.4 51.3% 46.5%
Palm Beach
29.70
457 6.49%
291 161 3.5
6.0 1.6
62.9% 34.7%
Pasco
3.92
147 2.67%
72
70 0.6 3.5
0.6 49.4% 47.5%
Pinellas
8.49
407 2.09%
207 187 1.0
10.1 2.0
50.8% 46.0%
Polk 0.90
170 0.53%
76
91 0.5 2.1
0.5 44.7% 53.4%
Putnam
0.17
26 0.64%
12
13 0.1 0.4
0.1 46.3% 51.1%
St. Johns
3.24
64 5.06%
22 40
0.2 1.3 0.3
34.1% 63.1%
St. Lucie
0.34
78 0.43%
42
35 0.1 1.4
0.2 53.4% 44.4%
Santa Rosa
0.37
51 0.72%
13
36 0.3 0.7
0.2 25.8% 71.8%
Sarasota
0.56 162
0.35% 73
83 0.3 4.1
0.6 45.4% 51.5%
Seminole
0.65 138
0.47% 60
76 0.2 2.0
0.6 43.1% 54.8%
Sumter
0.76
23 3.31% 10
12 0.1 0.3
0.1 44.2% 53.5%
Suwannee
0.73 13
5.56% 5
8 0.1
0.2 0.1
34.9% 62.2%
Taylor
0.60
7 8.09%
3
4 0.0
0.1 0.0 41.6%
56.8%
Union
0.26
4 6.32%
2
2 0.0
0.0 0.0
39.0% 58.8%
Volusia
0.50
184 0.27%
98
82 0.5 2.9
0.6 53.0% 44.8%
Wakulla
0.42
9 4.68%
4
5 0.0
0.2 0.0
46.0% 51.3%
Walton
0.22
19 1.18%
6
12 0.1 0.3
0.1 31.3% 66.0%
Washington
0.33
8 3.94%
3
5 0.1
0.1 0.0
36.4% 60.8%
____________________________________________________________________________________________
County Vote changes from 2000 by Machine
Type
2000 2004 Vote Change
Bush Incr Machine
............ Vote GORE BUSH OTHER Vote KERRY BUSH OTHER KERRY BUSH
OTHER Margin Incidents
DRE 3078 53.9% 44.7% 1.4% 3835 51.3% 47.8% 0.9% 342 443 -27 5.7% 231
Optiscan 2831 44.2% 54.2% 1.6% 3728 42.3% 57.0% 0.7% 323 602 -28 4.7% 81
Total
5909 48.8% 48.8% 2.3% 7563 47.1% 52.1% 0.8% 664 1045 -55 5.0% 312
DRE
Broward 571 67.7% 31.1% 1.2% 700 64.6% 34.8% 0.5% 65.8 66.4 -3.3 6.8% 56
Charlotte 67 44.6% 53.2% 2.2% 79 43.2% 56.1% 0.7% 4.6 9.0 -0.9 4.2% 0
Collier 92 32.6% 65.9% 1.5% 128 34.2% 65.3% 0.5% 13.8 23.1 -0.8 -2.1% 0
Miami-Dade 624 52.7% 46.4% 0.9% 767 53.0% 46.8% 0.3% 77.3 69.1 -3.4 0.1% 54
Hillsboro 358 47.4% 50.5% 2.1% 460 46.4% 53.2% 0.4% 43.9 63.8 -5.5 3.7% 21
Indian River 49 40.1% 58.0% 1.9% 61 39.2% 60.3% 0.5% 4.2 8.2 -0.7 3.2% 0
Lafayette 2 31.8% 67.2% 1.0% 3 25.5% 74.2% 0.3% 0.1 0.8 0.0 13.3% 0
Lake 88 41.5% 56.8% 1.7% 123 39.1% 60.3% 0.5% 11.6 24.4 -0.8 6.0% 3
Martin 62 43.1% 55.0% 1.8% 72 42.0% 57.5% 0.6% 3.6 7.4 -0.7 3.6% 1
Nassau 23 29.4% 69.5% 1.1% 32 26.3% 73.1% 0.6% 1.7 7.5 -0.1 6.6% 0
Palm Beach 423 63.8% 36.2% 0.0% 541 60.6% 39.2% 0.3% 58.0 58.9 1.6 6.2% 88
Pasco 142 49.1% 48.5% 2.4% 189 44.7% 54.5% 0.8% 15.2 34.6 -2.0 10.4% 0
Pinellas 395 50.7% 46.7% 2.5% 453 49.7% 49.8% 0.5% 24.7 40.8 -7.6 4.1% 6
Sarasota 160 45.5% 51.9% 2.5% 194 45.5% 53.9% 0.6% 15.5 21.5 -2.8 2.0% 2
Sumter 22 43.7% 54.9% 1.4% 32 36.6% 62.6% 0.8% 1.9 7.7 -0.1 14.7% 0
OPTISCAN
Alachua 85 55.9% 40.3% 3.8% 111 56.4% 43.1% 0.5% 15.0 13.5 -2.7 2.3% 0
Baker 8 29.7% 69.6% 0.7% 10 21.9% 77.8% 0.2% -0.2 2.1 0.0 16.0% 0
Bay 58 32.3% 66.3% 1.4% 75 28.2% 71.4% 0.5% 2.2 14.8 -0.5 9.3% 0
Bradford 9 35.9% 63.2% 1.0% 11 30.0% 69.8% 0.3% 0.2 2.1 -0.1 12.5% 0
Brevard 217 44.9% 53.1% 2.1% 264 41.7% 57.9% 0.5% 12.8 37.7 -3.3 7.9% 4
Calhoun 5 42.5% 56.7% 0.8% 6 35.7% 63.7% 0.6% 0.0 0.9 0.0 13.9% 0
Citrus 57 45.0% 52.5% 2.4% 69 42.3% 57.1% 0.7% 3.7 9.7 -0.9 7.3% 0
Clay 57 25.7% 73.3% 1.0% 81 23.3% 76.4% 0.3% 4.3 20.1 -0.3 5.4% 0
Columbia 18 38.6% 60.0% 1.4% 25 32.3% 67.3% 0.4% 1.0 5.8 -0.1 13.6% 0
De Soto 8 42.9% 55.0% 2.0% 9 41.3% 58.2% 0.5% 0.6 1.3 -0.1 4.8% 0
Dixie 5 39.7% 58.7% 1.6% 6 30.5% 69.0% 0.5% 0.1 1.7 0.0 19.6% 0
Duval 263 41.1% 57.9% 1.0% 379 41.8% 57.9% 0.3% 50.3 67.2 -1.5 -0.7% 12
Escambia 116 35.4% 63.1% 1.5% 142 33.9% 65.7% 0.4% 7.3 20.4 -1.2 4.0% 1
Flagler 27 51.6% 46.8% 1.6% 38 48.4% 51.1% 0.5% 4.7 7.0 -0.3 7.5% 0
Franklin 5 44.6% 53.5% 1.9% 6 40.6% 58.8% 0.6% 0.4 1.0 0.0 9.2% 0
Gadsden 15 66.5% 32.6% 0.9% 21 69.9% 29.9% 0.3% 4.9 1.5 -0.1 -6.1% 1
Gilchrist 5 36.0% 62.2% 1.8% 7 28.9% 70.7% 0.5% 0.1 1.6 -0.1 15.6% 0
Glades 3 43.2% 55.1% 1.7% 4 41.1% 58.5% 0.4% 0.3 0.6 0.0 5.4% 0
Gulf 6 39.7% 58.8% 1.4% 7 33.2% 66.3% 0.6% 0.0 1.2 0.0 14.0% 0
Hamilton 4 44.1% 55.0% 0.9% 5 44.6% 55.1% 0.3% 0.5 0.6 0.0 -0.4% 0
Hardee 6 37.9% 60.9% 1.2% 7 29.7% 69.8% 0.5% -0.2 1.3 0.0 17.0% 0
Hendry 8 40.0% 58.7% 1.3% 10 40.7% 59.1% 0.2% 0.7 1.0 -0.1 -0.2% 0
Hernando 65 50.4% 47.3% 2.3% 79 46.3% 53.1% 0.6% 3.9 11.2 -1.0 9.8% 0
Highlands 35 40.6% 57.9% 1.6% 41 37.1% 62.5% 0.5% 1.2 5.7 -0.4 8.1% 0
Holmes 7 29.9% 68.8% 1.3% 8 21.9% 77.6% 0.5% -0.4 1.4 -0.1 16.8% 0
Jackson 16 42.5% 56.6% 0.9% 20 38.3% 61.4% 0.4% 0.7 3.0 -0.1 9.1% 0
Jefferson 6 54.4% 44.3% 1.4% 7 55.4% 44.2% 0.4% 1.1 0.8 0.0 -1.1% 0
Lee 183 40.1% 57.9% 2.0% 240 39.3% 60.1% 0.6% 20.8 38.3 -2.2 3.1% 0
Leon 102 60.0% 38.1% 1.9% 136 61.7% 38.0% 0.4% 22.4 12.5 -1.5 -1.9% 26
Levy 13 43.0% 54.7% 2.3% 17 36.6% 62.8% 0.6% 0.7 3.6 -0.2 14.5% 0
Liberty 2 43.2% 56.0% 0.8% 3 35.5% 64.0% 0.5% 0.1 0.6 0.0 15.7% 0
Madison 6 49.4% 49.8% 0.9% 8 48.9% 50.6% 0.5% 1.0 1.2 0.0 1.4% 0
Manatee 110 44.9% 52.9% 2.3% 143 42.8% 56.8% 0.5% 12.1 23.3 -1.8 6.0% 0
Marion 102 44.0% 54.3% 1.8% 139 41.1% 58.4% 0.5% 12.6 26.1 -1.2 6.9% 2
Monroe 34 49.0% 47.7% 3.2% 39 49.9% 49.4% 0.7% 3.2 3.4 -0.8 0.8% 0
Okaloosa 70 24.2% 74.4% 1.4% 89 21.7% 77.9% 0.4% 2.4 17.6 -0.6 6.1% 0
Okeechobee 10 46.9% 51.7% 1.3% 12 42.3% 57.4% 0.3% 0.6 1.9 -0.1 10.3% 0
Orange 275 51.0% 49.0% 0.0% 387 50.0% 49.7% 0.3% 53.0 57.9 1.1 1.9% 16
Osceola 55 51.1% 47.6% 1.3% 82 47.1% 52.6% 0.3% 10.4 16.9 -0.5 9.0% 1
Polk 168 44.9% 53.9% 1.2% 210 40.9% 58.7% 0.4% 10.8 33.2 -1.3 8.8% 5
Putnam 26 46.7% 51.9% 1.5% 31 40.2% 59.3% 0.4% 0.3 4.9 -0.2 13.9% 1
St. Johns 60 32.4% 65.6% 2.0% 86 30.7% 68.8% 0.5% 6.9 19.6 -0.8 4.9% 0
St. Lucie 78 53.5% 44.7% 1.8% 100 51.9% 47.7% 0.4% 10.3 12.9 -0.9 4.6% 0
Santa Rosa 50 25.7% 72.8% 1.5% 67 21.9% 77.7% 0.4% 1.8 15.7 -0.4 8.7% 0
Seminole 137 43.3% 55.3% 1.4% 186 41.4% 58.2% 0.3% 17.8 32.4 -1.4 4.7% 4
Suwannee 12 33.2% 65.3% 1.5% 16 28.7% 70.8% 0.5% 0.4 3.1 -0.1 10.0% 0
Taylor 7 39.2% 60.0% 0.9% 9 35.6% 63.9% 0.5% 0.4 1.4 0.0 7.4% 0
Union 4 37.3% 61.8% 0.9% 5 26.8% 72.8% 0.3% -0.2 1.1 0.0 21.5% 0
Volusia 183 53.3% 45.1% 1.6% 228 50.6% 49.0% 0.4% 18.0 29.2 -2.0 6.5% 8
Wakulla 8 45.2% 53.1% 1.8% 12 41.8% 57.8% 0.4% 1.1 2.3 -0.1 8.1% 0
Walton 18 31.2% 67.3% 1.5% 24 26.0% 73.5% 0.5% 0.6 5.4 -0.1 11.3% 0
Washington 8 35.5% 63.3% 1.2% 10 28.2% 71.3% 0.5% 0.1 2.4 0.0 15.3% 0
____________________________________________________________________________________________
Democratic County Vote and
Registration Share Trend
(1992-2004)
V= Vote share
R = Registration share
VR = 100*V/R
Weighted V92 V96 V00 V04 R96 R00 R04 VR96 VR00 VR04
DRE
42.3 52.7 53.3 51.3 44.5 42.0 41.6 118 127 125
Optiscan 35.1 42.5 43.4 42.3 51.1 47.8 41.2 83 91 102
Total 38.9 47.8 48.8 47.1 47.7 44.8 41.4 100 109 114
DRE
Broward 52 64 67 65 53 51 50 121 131 129
Charlotte 37 43 44 43 36 34 32 119 129 135
Collier 26 32 32 34 25 24 24 128 133 143
Miami-Dade 47 57 53 53 48 44 43 119 120 123
Hillsboro 37 47 47 46 48 44 42 98 107 110
Indian River 28 37 40 39 33 31 30 112 129 131
Lafayette 33 40 41 25 37 36 34 108 114 75
Lake 32 40 40 39 34 32 30 118 125 130
Martin 28 38 43 42 28 27 28 136 159 150
Nassau 30 34 29 26 56 48 37 61 60 71
Palm Beach 46 58 62 61 46 45 45 126 138 135
Pasco 39 50 49 45 43 40 37 116 123 121
Pinellas 38 49 50 50 39 37 38 126 135 131
Sarasota 35 43 45 45 31 31 31 139 145 147
Sumter 41 46 43 37 57 48 41 81 90 89
OPTISCAN
Alachua 50 54 55 56 57 53 51 95 104 111
Baker 29 34 29 22 89 83 69 38 35 32
Bay 28 33 32 28 54 48 39 61 67 72
Bradford 37 41 35 30 77 70 61 53 50 49
Brevard 31 41 45 42 40 38 37 103 118 113
Calhoun 37 43 42 36 91 88 82 47 48 43
Citrus 36 44 45 42 46 41 39 96 110 108
Clay 23 28 26 23 31 29 26 90 90 90
Columbia 37 41 38 32 68 64 57 60 59 57
DeSoto 36 43 43 41 70 64 59 61 67 70
Dixie 43 46 39 31 89 86 77 52 45 40
Duval 37 44 41 42 54 50 46 81 82 91
Escambia 31 35 35 34 51 46 41 69 76 83
Flagler 41 48 51 48 42 40 38 114 128 127
Franklin 35 46 44 41 87 81 77 53 54 53
Gadsden 59 66 66 70 88 85 83 75 78 84
Gilchrist 38 41 35 29 78 72 59 53 49 49
Glades 39 45 43 41 76 69 65 59 62 63
Gulf 33 41 39 33 84 79 67 49 49 49
Hamilton 44 47 43 45 91 86 79 52 50 56
Hardee 31 39 38 30 79 73 64 49 52 46
Hendry 34 44 40 41 66 63 57 67 63 71
Hernando 39 49 50 46 42 40 39 117 125 119
Highlands 35 42 40 37 45 42 40 93 95 93
Holmes 29 34 29 22 90 83 73 38 35 30
Jackson 37 43 42 38 82 79 72 52 53 53
Jefferson 49 53 54 55 83 79 72 64 68 77
Lee 34 36 31 39 94 89 83 38 35 47
Leon 49 55 60 62 61 59 57 90 102 108
Levy 40 45 42 37 72 67 60 63 63 61
Liberty 32 40 42 36 96 94 88 42 45 40
Madison 45 50 49 49 86 84 80 58 58 61
Manatee 34 43 45 43 37 35 33 116 129 130
Marion 36 41 43 41 45 42 40 91 102 103
Monroe 36 47 49 50 44 39 36 107 126 139
Okaloosa 20 26 24 22 32 28 25 81 86 87
Okeechobee 37 49 47 42 69 65 58 71 72 73
Orange 35 46 50 50 41 41 40 112 122 125
Osceola 33 47 51 47 44 42 40 107 121 118
Polk 35 44 45 41 50 46 43 88 98 95
Putnam 42 48 46 40 67 63 58 72 73 69
St. Johns 31 34 32 31 39 34 28 87 94 110
St. Lucie 35 49 53 52 44 41 41 111 129 127
Santa Rosa 20 26 25 22 44 35 28 59 71 78
Seminole 30 39 43 41 35 33 32 111 130 130
Suwannee 35 37 33 29 76 71 64 49 46 45
Taylor 36 45 39 36 87 82 76 52 48 47
Union 35 40 37 27 91 84 75 44 44 36
Volusia 42 49 53 51 46 43 41 107 123 123
Wakulla 35 43 45 42 80 74 67 54 61 62
Walton 29 34 31 26 63 53 37 54 58 70
Washington 32 38 35 28 82 74 67 46 47 42
____________________________________________________________________________________________
Democratic and Republican Registration
Shares
1996 2000 2004 1996 2000 2004
Dem Rep Dem Rep Dem Rep Democratic Margin
Vote Share 47.8 42.3 48.8 48.8 47.1 52.1 5.5
0.0 (5.0)
Reg. Share 47.7 39.8 44.8 38.2 41.4 37.8 7.9
6.6 4.6
VoteSh/RegSh 100.0 106.3 108.9 127.7 113.8 137.8 (6.3) (18.8) (24.0)
Registration Share
DRE 44.5 41.6 42.0 39.1 41.6 36.1 2.9
2.9 4.5
Optical Scan 51.0 37.8 47.7 37.2 41.2 39.5 13.2
10.5 1.7
County Registration Share
DRE
Broward 53 33 51 30 50 27 20 21
23
Charlotte 36 52 34 48 32 45 (16) (14) (13)
Collier 25 62 24 57 24 53 (37) (33) (29)
Miami-Dade 48 39 44 38 43 35 9 6
8
Hillsboro 48 38 44 37 42 35 10 7
7
Indian River 33 57 31 54 30 51 (24) (23) (21)
Lafayette 37 51 36 49 34 47 (14) (13) (13)
Lake 34 52 32 49 30 48 (18) (17) (18)
Martin 28 60 27 56 28 52 (32) (29) (24)
Nassau 56 37 48 41 37 49 19 7
(12)
Palm Beach
46 39 45 35 45 32 7 10
13
Pasco 43 43 40 41 37 40 0
(1) (3)
Pinellas
39 45 37 42 38 39 (6) (5) (1)
Sarasota
31 56 31 52 31 48 (25) (21) (17)
Sumter 57 34 48 38 41 44 23 10
(3)
OPSCAN
Alachua 57 30 53 28 51 28 27 25
23
Baker
89 9 83 14 69 24 80 69
45
Bay 54 34 48 37 39 44 20 11
(5)
Bradford
77 16 70 21 61 28 61 49
33
Brevard 40 48 38 46 37 45 (8) (8) (8)
Calhoun 91 7 88 8 82 12 84 80
70
Citrus 46 41 41 41 39 41 5 0
(2)
Clay 31 56 29 56 26 57 (25) (27) (31)
Columbia
68 25 64 26 57 31 43 38
26
DeSoto 70 24 64 24 59 25 46 40
34
Dixie 89 8 86 10 77 15 81 76
62
Duval 54 35 50 36 46 37 19 14
9
Escambia 51 40 46 41 41 44 11 5
(3)
Flagler 42 44 40 41 38 41 (2) (1) (3)
Franklin
87 10 81 14 77 16 77 67
61
Gadsden 88 9 85 10 83 11 79 75
72
Gilchrist
78 17 72 20 59 30 61 52
29
Glades 76 19 69 22 65 25 57 47
40
Gulf 84 13 79 16 67 27 71 63
40
Hamilton
91 7 86 10 79 15 84 76
64
Hardee 79 17 73 21 64 27 62 52
37
Hendry 66 26 63 28 57 31 40 35
26
Hernando
42 45 40 43 39 41 (3) (3) (2)
Highlands
45 45 42 45 40 44 0 (3) (4)
Holmes 90 8 83 13 73 21 82 70
52
Jackson 82 14 79 16 72 22 68 63
50
Jefferson
83 13 79 15 72 21 70 64
51
Lee 94 5 89 8 83 13 89 81
70
Leon 61 27 59 27 57 27 34
32 30
Levy 72 22 67 24 60 28 50 43
32
Liberty 96 3 94 4 88 8 93 90
80
Madison 86 11 84 12 80 15 75 72
65
Manatee 37 50 35 47 33 44 (13) (12) (11)
Marion 45 43 42 43 40 43 2 (1) (3)
Monroe 44 40 39 39 36 39 4 0
(3)
Okaloosa
32 56 28 56 25 57 (24) (28) (32)
Okeechobee
69 24 65 27 58 30 45 38
28
Orange 41 44 41 40 40 35 (3) 1
5
Osceola 44 40 42 36 40 33 4 6
7
Polk 50 40 46 39 43 39 10 7
4
Putnam 67 25 63 26 58 28 42
37 30
St. Johns
39 49 34 50 28 53 (10) (16) (25)
St. Lucie
44 41 41 39 41 37 3 2
4
Santa Rosa
44 47 35 52 28 56 (3) (17) (28)
Seminole
35 52 33 48 32 45 (17) (15) (13)
Suwannee
76 19 71 22 64 27 57 49
37
Taylor 87 11 82 14 76 19 76 68
57
Union 91 7 84 12 75 18 84 72
57
Volusia 46 40 43 38 41 36 6 5
5
Wakulla 80 15 74 19 67 24 65 55
43
Walton 63 29 53 35 37 50 34 18
(13)
Washington
82 14 74 19 67 25 68 55
42
____________________________________________________________________________________________
County Presidential Vote vs.
Registration
Vote
Share / Registration Share
KVS =
Kerry / Democratic
BVS =
Bush / Republican
OVS =
Other / Other
Vote
Total / Registration Total
KVR =
Kerry / Democratic
BVR =
Bush / Republican
OVR =
Other / Other
Vote Share ----Registration
Share---- --Vote/Reg Share-- -Vote/Registration-
County...... Kerry Bush Total Dem Rep Other KVS BVS OVS KVR BVR OVR
DRE
52.1% 47.4% 4,718 41.6% 36.1% 22.3% 125% 131% 2.4% 91% 95%
4%
OPTISCAN 42.3% 57.3% 4,382 41.2% 39.5% 19.3% 102% 145% 2.6% 76% 108% 4%
TOTAL 47.3% 52.3% 9,100 41.4% 37.8% 20.8% 114% 138% 2.5% 84% 102% 4%
DRE
Broward
64.6% 34.8% 963 51% 28% 21% 127% 124% 2.6% 92% 90% 2%
Charlotte 43.2% 56.1% 103 34% 47% 19% 128% 119% 3.7% 98% 91% 3%
Collier
34.2% 65.3% 150 25% 56% 19% 138% 116% 2.5% 117% 99% 2%
Dade
53.0% 46.8% 943 43% 36% 20% 122% 128% 1.3% 99% 104% 1%
Hillsborough 46.4% 53.2% 89 264% 223% -387% 18% 24% -0.1% 91% 123% 2%
Indian River 39.2% 60.3% 74 31% 53% 16% 125% 114% 3.0% 103% 94% 3%
Lafayette 25.5% 74.2% 4 83% 14% 3% 31% 535% 10.9% 25% 443% 9%
Lake
39.1% 60.3% 139 36% 50% 14% 108% 121% 3.8% 96% 107% 3%
Martin
42.0% 57.5% 89 29% 56% 15% 146% 102% 3.8% 118% 83% 3%
Nassau
26.3% 73.1% 36 42% 46% 11% 62% 158% 5.0% 56% 142% 4%
Palm Beach 60.6% 39.2% 650 47% 34% 19% 130% 115% 1.5% 108% 96% 1%
Pasco
44.7% 54.5% 240 39% 41% 20% 115% 133% 3.8% 90% 105% 3%
Pinellas 49.7% 49.8% 536 39% 42% 19% 126% 119% 2.8% 107% 100% 2%
Sarasota 45.5% 53.9% 219 32% 51% 18% 144% 106% 3.7% 128% 94% 3%
Sumter
36.6% 62.6% 35 44% 43% 13% 84% 145% 5.9% 76% 131% 5%
OPTISCAN
Alachua
56.4% 43.1% 116 54% 29% 17.3% 105% 150% 2.9% 100% 143% 3%
Baker
21.9% 77.8% 12 75% 20% 4.7% 29% 382% 4.7% 25% 321% 4%
Bay
28.2% 71.4% 87 45% 42% 13.2% 63% 170% 3.6% 54% 145% 3%
Bradford 30.0% 69.8% 14 64% 27% 8.3% 47% 254% 3.1% 37% 202% 2%
Brevard
41.7% 57.9% 301 38% 47% 14.6% 109% 123% 3.1% 95% 108% 3%
Calhoun
35.7% 63.7% 8 83% 13% 4.5% 43% 497% 14.1% 33% 375% 11%
Citrus
42.3% 57.1% 82 41% 43% 16.8% 104% 134% 3.9% 88% 113% 3%
Clay
23.3% 76.4% 91 27% 58% 14.9% 86% 132% 2.1% 76% 117% 2%
Columbia 32.3% 67.3% 30 61% 30% 8.5% 53% 221% 5.2% 44% 182% 4%
DeSoto
41.3% 58.2% 14 61% 26% 12.7% 67% 224% 4.0% 46% 153% 3%
Dixie
30.5% 69.0% 9 80% 14% 5.4% 38% 478% 8.4% 28% 347% 6%
Duval
41.8% 57.9% 426 49% 38% 12.8% 85% 152% 2.5% 76% 135% 2%
Escambia 33.9% 65.7% 164 44% 44% 11.9% 76% 150% 3.2% 66% 130% 3%
Flagler
48.4% 51.1% 40 40% 42% 18.5% 122% 122% 2.6% 116% 117% 2%
Franklin 40.6% 58.8% 7 77% 17% 5.5% 53% 339% 11.4% 43% 276% 9%
Gadsden
69.9% 29.9% 25 84% 11% 4.5% 83% 271% 5.7% 69% 225% 5%
Gilchrist 28.9% 70.7% 8 63% 29% 8.6% 46% 246% 5.3% 40% 214% 5%
Glades
41.1% 58.5% 6 68% 24% 8.8% 61% 248% 4.4% 42% 173% 3%
Gulf
33.2% 66.3% 9 70% 25% 5.4% 48% 267% 10.2% 38% 214% 8%
Hamilton 44.6% 55.1% 7 81% 15% 3.7% 55% 370% 8.5% 38% 258% 6%
Hardee
29.7% 69.8% 12 66% 26% 8.1% 45% 269% 6.6% 28% 167% 4%
Hendry
40.7% 59.1% 16 59% 31% 9.7% 69% 190% 2.5% 43% 119% 2%
Hernando 46.3%
53.1% 100 40% 43% 17.5% 116% 124% 3.7% 92% 98% 3%
Highlands 37.1% 62.5% 59 41% 44% 15.1% 91% 141% 3.0% 65% 100% 2%
Holmes
21.9% 77.6% 10 74% 20% 5.4% 29% 384% 9.4% 24% 314% 8%
Jackson
38.3% 61.4% 25 75% 21% 4.8% 51% 298% 7.8% 40% 231% 6%
Jefferson 55.4% 44.2% 9 75% 20% 4.8% 74% 219% 7.5% 64% 190% 7%
Lee
39.3% 60.1% 285 31% 49% 20.0% 125% 124% 2.9% 105% 104% 2%
Leon
61.7% 38.0% 140 60% 28% 11.6% 102% 136% 3.0% 99% 132% 3%
Levy
36.6% 62.8% 20 64% 28% 8.4% 57% 226% 7.0% 48% 190% 6%
Liberty
35.5% 64.0% 4 91% 7% 2.5% 39% 943% 18.4% 31% 741% 14%
Madison
48.9% 50.6% 11 81% 15% 3.7% 60% 333% 13.4% 47% 261% 11%
Manatee
42.8% 56.8% 177 34% 46% 20.6% 127% 124% 2.3% 103% 100% 2%
Marion
41.1% 58.4% 164 42% 45% 13.3% 98% 130% 3.5% 83% 111% 3%
Monroe
49.9% 49.4% 51 39% 39% 22.1% 129% 125% 3.3% 101% 98% 3%
Okaloosa 21.7% 77.9% 117 26% 57% 16.8% 84% 136% 2.5% 64% 104% 2%
Okeechobee
42.3% 57.4% 17 62% 29% 9.2% 68% 199% 2.9% 50% 144% 2%
Orange
50.0% 49.7% 442 42% 38% 20.2% 120% 130% 1.5% 105% 114% 1%
Osceola
47.1% 52.6% 105 42% 35% 22.6% 112% 148% 1.5% 88% 116% 1%
Polk
40.9% 58.7% 261 45% 40% 14.7% 91% 146% 2.6% 73% 118% 2%
Putnam
40.2% 59.3% 42 59% 28% 12.4% 68% 208% 3.5% 50% 154% 3%
St. Johns 30.7% 68.8% 94 31% 54% 14.9% 98% 128% 3.2% 90% 117% 3%
St. Lucie 51.9% 47.7% 124 43% 39% 18.7% 122% 124% 2.3% 98% 100% 2%
Santa Rosa
21.9% 77.7% 85 31% 57% 12.5% 71% 137% 3.5% 56% 108% 3%
Seminole 41.4% 58.2% 196 34% 48% 18.3% 122% 122% 1.7% 116% 115% 2%
Suwannee 28.7% 70.8% 20 69% 27% 4.5% 42% 265% 11.9% 34% 214% 10%
Taylor
35.6% 63.9% 11 79% 18% 3.3% 45% 353% 16.1% 36% 277% 13%
Union
26.8% 72.8% 6 79% 16% 4.9% 34% 460% 6.9% 25% 335% 5%
Volusia
50.6% 49.0% 269 43% 38% 19.0% 118% 129% 2.1% 100% 109% 2%
Wakulla
41.8% 57.8% 14 71% 23% 6.0% 59% 249% 6.7% 50% 212% 6%
Walton
26.0% 73.5% 29 45% 45% 10.8% 58% 165% 4.6% 49% 138% 4%
Washington
28.2% 71.3% 13 69% 25% 6.1% 41% 288% 8.4% 33% 229% 7%
___________________________________________________________________________________________________
On
December 14, 2007, Bob Fitrakis & Harvey Wasserman reported that the Ohio
Secretary of State confirmed that the 2004 election could have
been stolen : “Ohio's Secretary of State announced this morning that a $1.9
million official study shows that "critical security failures" are
embedded throughout the voting systems in the state that decided the 2004
election. Those failures, she says, "could impact the integrity of
elections in the Buckeye State." They have rendered Ohio's vote counts
"vulnerable" to manipulation and theft by "fairly simple
techniques." Indeed, she says, "the tools needed to compromise
an accurate vote count could be as simple as tampering with the paper audit
trail connector or using a magnet and a personal digital assistant." In
other words, Ohio's top election official has finally confirmed that the 2004
election could have been easily stolen.
…….
The final official tally for Bush---less than 119,000 votes out of 5.4 million
cast---varied by 6.7% from exit poll results, which showed a Kerry victory.
Exit polls in 2004 were designed to have a margin of error of about 1%.
In various polling stations in Democrat-rich inner city precincts in Youngstown
and Columbus, voters who pushed touch screens for Kerry saw Bush's name light
up. A wide range of discrepancies on both electronic and paper balloting
systems leaned almost uniformly toward the Bush camp. Voting procedures
regularly broke down in inner city and campus areas known to be heavily
Democratic.
In direct violation of standing federal election law, 56 of 88 Ohio counties
have since destroyed all or part of their 2004 election data. The materials
were additionally protected by a federal court injunction in the
King-Lincoln-Bronzeville federal civil rights lawsuit (in which we are attorney
and plaintiff). To date, no state or federal prosecutions have resulted from
this wholesale destruction of presidential election records, including 1.6
million ballots, cast and uncast, needed for definitive auditing procedures.
However, two Cuyahoga County (Cleveland) election officials have been convicted
of felony manipulation of an official recount. The Cleveland Plain-Dealer, the
state's largest newspaper, recently editorialized that there is "no
evidence" the 2004 election was stolen, but omitted mention of the
destruction of the electoral records by more than half the counties in the
state. The Plain-Dealer and other mainstream media have consistently ignored
findings by the Free Press and others indicating widespread manipulation and
theft of the kind Brunner has now confirmed was eminently do-able within the
Ohio system.
Brunner says "the results underscore the need for a fundamental change in
the structure of Ohio's election system to ensure ballot and voting system
security while still making voting convenient and accessible to all Ohio
voters." Among other things, she advocates replacing touch-screen machines
with optical-scan
units that include a paper balloting system.”
_________________________________________________________________________________________________________
Composite 12:22am
Preliminary vs. Final Ohio Exit Poll
Kerry won the unadjusted (WPE) Ohio Exit Poll by 54.4-45.6% and the 12:22am adjusted Composite (1963 respondents) by 52.1-47.9%.Bush won the 2:06pm Final Ohio Exit Poll (2020 respondents) by 50.9-49.1%. Vote shares and weights were adjusted to force a match to the recorded vote. The Final National Exit poll was also forced to match the recorded National vote. It’s Standard Operating Procedure.
If the 12:22am Ohio exit poll weightings had been used in the Final, it would have been necessary to inflate the Bush vote shares to implausible levels to match the recorded vote. So the weights were adjusted in favor of Bush to minimize vote share inflation:
First-time Voters
Of the 14% who were first-time voters, 55% were for Kerry. Are we to believe he won just 47% of those who voted previously?
Bush Approval
On Election Day, Bush had an average 48.5% national approval rating (11-polls). In the 12:22am Ohio Exit Poll, the Bush approval weighting was 51% (Kerry won by 50.1-49.9%). In the Final Ohio Exit Poll, the weighting was increased to 53% in order to force a match to the recorded vote (Bush won by 51.6-47.0%). Using the actual 48.5% Bush approval, Kerry won by 52.3-47.7%, a 270,000 vote margin.
Size of Community
According to the 12:22am Ohio Exit Poll, Kerry won in the Big Cities by 50-49% - but Bush won Big Cities in the Final Exit Poll by 53-43%. Are we supposed to believe that Bush outpolled Kerry by 10% in large, traditionally Democratic urban locations such as Cleveland and Cincinnati?
When Decided
Of the 21% who decided in the month prior to the election, 62% voted for Kerry, compared to just 45% of the 79% who decided earlier. Not plausible. Did Bush lead by 10% in the pre-October polls?
Party ID
The weights changed from 38D/35R to 35D/40R, a 7.9% shift. With the original weights, Bush needed 17% of Democrats to match the recorded vote. He had 8%.
Ideology
Liberal/Conservative weights changed from 21/32 to 19/34, a 9.5% shift. With the original weights, Bush needed 23% of Liberals to match the recorded vote. He had 13%.
Voted for Senate
Democratic/Republican weights changed from 43/57 to 36/64, a 16.3% shift. With the original weights, Bush needed 14% of those who voted Democratic. He had 7%.
Election Models: calculating the True
Vote
1) Election Calculator: Kerry won by 54.1-45.9% (1.22% annual voter mortality; 5% uncounted in 2000)
2) True Vote: Kerry won by 51.5-48.5% (0.87% annual mortality; 2.74% uncounted in 2004)
3) Switched Vote: Kerry won by 53.3-46.7% (3% of total votes cast were uncounted; 6.8% switched )
Election Calculator
2000
Recorded
2004 Calculated
Voted Actual
Unctd Cast Deaths
Alive
Turnout Voted
Weight Kerry Bush
DNV
1.33 23.0%
60% 40%
Gore
2.19 0.18
2.37 0.12
2.25
95% 2.13
37.0% 93%
7%
Bush
2.35 0.05
2.40 0.11
2.29
95% 2.18
37.7% 11%
89%
Nader
0.14 0.01
0.15 0.01
0.14
95% 0.14
2.4% 75%
25%
Total
4.68 0.25
4.93 0.24
4.68
4.45 5.77
100% 54.1% 45.9%
5.77 3.12
2.65
Sensitivity
Analysis I
Effects
of Gore share of uncounted votes and Gore voter turnout in
2004
Bush
2000 Turnout: 95.0%
Gore%
Gore Voter Turnout
Unctd
91.0% 93.0% 95.0%
97.0% 99.0%
Kerry Ohio Vote
Share
85.0%
53.9% 54.1% 54.4%
54.7% 54.9%
80.0%
53.7% 54.0% 54.2%
54.5% 54.8%
75.0%
53.6% 53.8% 54.1%
54.3% 54.6%
70.0%
53.4% 53.7% 53.9%
54.2% 54.4%
65.0%
53.2% 53.5% 53.8%
54.0% 54.3%
Kerry Margin
85.0% 0.51
0.51 0.51 0.51
0.51
80.0% 0.49
0.49 0.49 0.49
0.49
75.0% 0.47
0.47 0.47 0.47
0.47
70.0% 0.45
0.45 0.45 0.45
0.45
65.0% 0.43
0.43 0.43 0.43
0.43
Sensitivity
Analysis II
Effects
of Kerry’s share of Gore and New voters
Kerry
share of Bush 2000 voters: 11.0%
Kerry% Kerry % of New
voters (DNV in 2000)
Gore
56.0% 58.0%
60.0% 62.0% 64.0%
Kerry Ohio Vote
Share
97.0%
54.6% 55.1% 55.6%
56.0% 56.5%
95.0%
53.9% 54.4% 54.8%
55.3% 55.7%
93.0%
53.2% 53.6% 54.1%
54.5% 55.0%
91.0%
52.4% 52.9% 53.3%
53.8% 54.3%
89.0%
51.7% 52.1% 52.6%
53.1% 53.5%
Kerry
Margin
97.0% 0.54
0.59 0.64 0.69
0.75
95.0% 0.45
0.50 0.56 0.61
0.66
93.0% 0.37
0.42 0.47 0.52
0.58
91.0% 0.28
0.33 0.39 0.44
0.49
89.0% 0.19
0.25 0.30 0.35
0.41
True Vote Model
2000
Recorded
2004 Calculated
Voted
Actual Deaths
Alive
Turnout Voted Weight Kerry
Bush
DNV 1.31
23.4% 57% 43%
Gore
2.19 0.08
2.11
95% 2.00
35.7% 91%
9%
Bush
2.35 0.08
2.27
95% 2.16
38.6% 10%
90%
Nader
0.14 0.01
0.14
95% 0.13 2.4%
77% 23%
Total
4.68 0.16
4.52
4.29 5.60
100% 51.5% 48.5%
5.60 2.88
2.72
Uncounted and Switched Votes
Kerry Bush
Actual
2740 2859
Uncounted
119 40
Switched
208
-208 (6.8% of True Vote)
True
3067 2690
Vote
53.3% 46.7%
___________________________________________________________________________________________________
12:22am Composite
1963
respondents
MoE: 2.21%
--Probability--
CATEGORY
Kerry
Kerry Vote Dev
Kerry Bush Kerry
Bush Margin
Win 1 in
GENDER
52.06% 47.94% 2.934
2.701 0.232 96.6% 187
RACE/GENDER
51.76% 48.24% 2.917
2.718 0.198 94.1% 90
RACE
51.58% 48.42% 2.907
2.728 0.178 91.9% 60
AGE
51.39% 48.31% 2.896
2.722 0.174 89.1% 77
INCOME
52.40% 47.13% 2.953
2.656 0.297 98.3% 1862
EDUCATION
50.94% 48.77% 2.870
2.748 0.122 79.8% 29
PARTY ID
51.80%
47.57% 2.919 2.681
0.238 94.5% 504
IDEOLOGY
51.10%
48.90% 2.879 2.756
0.124 83.5% 23
VOTED BEFORE?
50.70% 49.30% 2.857
2.778 0.079 73.3% 11
RELIGION
50.96% 48.78% 2.872
2.749 0.123 80.3% 28
WHEN DECIDED
50.96% 48.94% 2.872
2.758 0.114 80.3% 21
SIZE 1
51.17% 48.45%
2.883 2.730 0.153
85.0% 56
SIZE 2
51.33% 48.67% 2.892
2.743 0.150 88.1% 35
REGION
51.57% 48.09% 2.906
2.710 0.196 91.8% 129
U.S.SENATE
51.96% 48.04% 2.928
2.707 0.221 95.9% 146
AVERAGE
51.36% 48.46% 2.894
2.731 0.163 88.6% 54
ACTUAL
48.71% 50.82% 2.740
2.859 -0.119 12.6% 2
Ohio
Ohio
Final
NEP
12:22am
(1963)
2:06pm
(2020)
12:22am
(13047)
GENDER
Mix Votes
Kerry
Bush
Mix Kerry Bush
Mix
Votes Kerry Bush
Other
Male
47% 2.65
51%
49%
47% 48%
52%
46%
56.20
47% 52% 1%
Female
53% 2.99
53%
47%
53% 50%
50%
54%
65.97
54% 45% 1%
Total
52.06%
47.94%
49.06%
50.94%
50.78% 48.22%
1.00%
5.635 2.934
2.701
2.765
2.870
122.17 62.04
58.91 1.22
RACE/GENDER
WM
40% 2.25
47%
53%
40% 43%
56%
36%
43.89
41% 58% 1%
WF
45% 2.54
47%
53%
46% 45%
55%
41%
49.99
47% 52% 1%
NWM
7% 0.39
75%
25%
7% 73%
27%
10%
12.19
69% 28% 1%
NWF
8% 0.45
82%
18%
8% 82%
18%
13%
15.85
77% 22% 1%
Total
51.76%
48.24%
49.57% 51.03%
50.94%
47.86% 1.00%
2.917
2.718
2.793
2.876
121.93 62.23
58.47 1.22
VOTED
BEFORE?
VOTED in 2000
No
14% 0.79
55%
45%
15% 54%
46% No
17%
20.77
57% 41% 2%
Yes
86% 4.85
50%
50%
85% 47%
52% Gore
39%
47.65
91% 8% 1%
Total
50.70%
49.30%
48.05% 51.10% Bush
41%
50.09
10% 90% 0%
2.857
2.778
2.708 2.879 Nader
3%
3.67 71%
21% 8%
51.41%
47.62% 0.97%
122.17 62.80
58.17 1.18
AGE
18-29
21% 1.18
60%
40%
21% 56%
42%
17%
20.56
56% 42% 1%
30-44
30% 1.69
50%
49%
30% 47%
52%
29%
35.08
48% 49% 2%
45-59
29% 1.63
51%
49%
29% 48%
52%
30%
36.28
51% 47% 1%
60-
20% 1.13
45%
55%
20% 43% 57%
24%
29.03
48% 51% 0%
Total
51.39%
48.31%
48.38%
50.90%
50.26% 47.69%
1.05%
2.896
2.722
2.726
2.868
120.95 61.40
58.26 1.28
INCOME
0-15
7% 0.39
73%
27%
7% 71%
29%
9%
10.96
65% 34% 1%
15-30
16% 0.90
66%
34%
16% 63% 37%
15%
18.27
60% 38% 1%
30-50
25% 1.41
53%
46%
25% 50%
49%
22%
26.80
53% 46% 1%
50-75
22% 1.24
44%
55%
22% 41%
58%
23%
28.02
46% 53% 1%
75-100
15% 0.85
50%
50%
15% 45%
55%
13%
15.84
48% 51% 0%
100-150
9% 0.51
44%
56%
9% 42%
58%
11%
13.40 45%
53% 2%
150-200
4% 0.23
39%
61%
4% 37%
63%
4%
4.87 47%
53% 0%
200-
2% 0.11
39%
61%
2% 39%
61%
3% 3.65 41%
58% 1%
Total
52.40%
47.13%
49.36%
50.17%
51.39% 47.39%
0.94%
2.953 2.656
2.781
2.827
121.83 62.78
57.89 1.14
EDUCATION
NoHS
4% 0.23
60%
40%
4% 58%
42%
4%
4.89 53%
46% 1%
HSGrad
29% 1.63
53%
46%
30% 51%
49%
22%
26.88
50% 48% 2%
College
28% 1.58
50%
50%
29% 48%
52%
31%
37.87
48% 51% 1%
ColGrad
25% 1.41
47%
53%
25% 45%
55%
26%
31.76
49% 50% 1%
Postg
14% 0.79
53%
47%
13% 49%
51%
17%
20.77
57% 41% 2%
Total
50.94%
48.77%
49.16%
51.84%
50.43% 48.18%
1.39%
2.870
2.748
2.770
2.921
122.17 61.61
58.86 1.69
PARTY ID
Dem
38% 2.14
91%
8%
35% 90%
9%
38%
46.17
90% 9% 1%
Rep
37% 2.08
6%
94%
40% 6%
94%
35% 42.53
7% 92% 1%
Ind
25% 1.41
60%
39%
25% 59%
40%
27%
32.81
52% 44% 2%
Total
51.80%
47.57%
48.65%
50.75%
50.69% 47.50% 1.27%
2.919
2.681
2.741
2.860
121.51 61.92
58.03 1.55
IDEOLOGY
Lib
21% 1.18
87%
13%
19% 85%
14%
22%
26.61
86% 12% 1%
Mod
47% 2.65
61%
39%
47% 59%
41%
45%
54.43
57% 41% 1%
Con
32% 1.80
13%
87%
34% 13% 87%
33%
39.91
16% 82% 1%
Total
51.10%
48.90%
48.30%
51.51%
49.85% 48.15%
1.00%
2.879
2.756
2.722
2.903
120.95 60.90
58.82 1.22
RELIGION
Prot
56% 3.16
46%
54%
57% 44%
56%
53%
64.71
43% 56% 1%
Cath
26% 1.47
46%
53%
26% 44%
55%
27%
32.96
50% 49% 1%
Jewish 1%
0.06 76%
24%
1% 76%
24%
3%
3.66 78% 22%
0%
Other
6% 0.34
76%
24%
6% 72%
26%
7%
8.55 75%
21% 3%
None
11% 0.62
72%
28%
10% 69%
29%
10%
12.21
69% 29% 2%
Total
50.96%
48.78%
48.50%
50.92%
50.78% 47.94% 1.21%
2.872
2.749
2.733
2.869
122.09 62.03
58.56 1.47
WHEN
DECIDED
Today
5% 0.28
60%
40%
5% 61%
39%
6%
7.31 53%
40% 5%
3Days
4% 0.23
64%
36%
4% 64%
36%
3%
3.65 53%
41% 4%
Week
2% 0.11
64%
36%
3% 64%
36%
2%
2.44 48% 51%
1%
Month
10% 0.56
62%
37%
11% 61%
36%
10%
12.18
60% 38% 1%
Before
79% 4.45
48%
52%
78% 45%
55%
79%
96.24 50%
50% 0%
Total
50.96%
48.94%
48.73%
50.27%
51.23% 47.95%
0.54%
2.872
2.758
2.746
2.872
121.83 62.58
58.58 0.66
REGION
Cuyahoga
13% 0.73
65%
35%
12% 65%
35% East
22% 26.74
58% 41% 1%
NE
27% 1.52
55%
45%
27% 50%
50% Central
26%
31.60
50% 49% 1%
Central
23% 1.30
47% 52%
20% 40%
58% South 31%
37.68
44% 54% 1%
NW
11% 0.62
50%
49%
15% 52%
47% West
21%
25.52
53% 45% 1%
SW
26% 1.47
46%
54%
26% 45%
55%
Total
51.57%
48.09%
48.80%
50.65%
50.53% 47.95% 1.00%
2.906
2.710
2.750
2.854
121.54 61.73
58.58 1.22
BUSH JOB
Approval
MILITARY
Approve
51% 2.87
7%
93%
53% 7%
93% Yes
18%
21.95 43% 55%
1%
Disap
49% 2.76
95%
5%
46% 94%
5% No 82%
100.00
53% 46% 1%
Total
50.12%
49.88%
46.95%
51.59%
51.20% 47.62% 1.00%
2.824
2.811
2.646 2.907
121.95 62.55
58.17 1.22
SIZE OF
COMMUNITY
BigCity
7% 0.39
50%
49%
6% 43%
53%
SmCity
19%
1.07 62%
38%
19% 62%
38%
Suburbs
49% 2.76
51%
49%
49% 49%
51%
SmTowns
6% 0.34
55%
43%
6% 49%
49%
Rural
19% 1.07
40%
59%
19% 36%
63%
Total
51.17%
48.45%
48.15%
50.30%
2.883
2.730
2.713 2.834
SIZE OF
COMMUNITY
Urban
26% 1.47
59%
41%
25% 58%
41%
Suburb
49% 2.76
51%
49%
49% 49%
51%
Rural
25% 1.41
44%
56%
25% 40%
60%
Total
51.33%
48.67%
48.51%
50.24%
2.892
2.743
2.734
2.831
RACE
White
86% 4.85
47%
53%
86% 44% 56%
Black
9% 0.51
84%
16%
10% 84%
16%
Latino
3% 0.17
72%
28%
3% 65%
35%
Asian
1% 0.06
72%
28%
1% 72%
28%
Other
1% 0.06
72%
28%
1% *
*
Total
51.58%
48.42%
48.91%
51.09%
2.907
2.728
2.756
2.879
VOTE FOR U.S.
SENATE
Dem
43% 2.42
93%
7%
36% 94%
6%
Rep 57%
3.21 21%
79%
64% 23% 77%
Total
51.96%
48.04%
48.56%
51.44%
2.928
2.707
2.736
2.899
___________________________________________________________________________________________________
2000-2004 Ohio Recorded
Votes and Margins by County
The county databases do not include the total number of recorded votes (129,000 in 2000 and 145,000 in 2004)
Late absentee votes had not yet been counted.
Gore won 53.1% of the late 129,000 recorded votes (2.77% of the total) compared to 46.5% of the initial recorded votes.
Kerry won 56.2% of the late 145,000 recorded votes (2.59% of the total) compared to 48.7% of the initial recorded votes.
The discrepancies between the initial and late Democratic vote shares are further evidence of a stolen election.
2000
Bush2k Bush04
2004
VoteChg PctChg
GORE
BUSH NADER Margin
Margin KERRY BUSH
Margin Margin Machine Incidents
Total Recorded
47.0% 50.5% 2.5%
165.0 118.6 48.9%
51.1% -46.4 -1.43%
County
Data 46.8%
50.7% 2.5% 176.4
136.5 48.7% 51.3%
-39.9 -1.40% &nbssp;
Late Votes
53.1% 44.3%
2.6% -11.4 -17.9
56.2% 43.8% -6.5
-3.47%
DRE
49.1%
48.2% 2.6%
-6.3 -45.3 ; 52.6%
47.4% -38.9 -4.4% 116
OPTISCAN
43.8% 53.9%
2.3% 56.2
69.9 44.7% 55.3%
13.7 0.5% 31
PUNCH
46.8%
50.7% 2.6% 126.6
111.9 48.6% 51.4%
-14.8 -1.0% p; 101
DRE
Auglaize
28.2% 69.9%
1.9% 7.9
10.7 25.8% 74.2%
2.8 6.7% 0
Franklin
49.1% 48.3%
2.6% -3.1
-41.4 54.1% p; 45.9%
-38.3 -7.3% p; 82
Knox
34.0% 63.8%
2.2% 6.1
7.1 36.6%
63.4% 1.0
-2.9% 1
Lake
45.9% 51.0%
3.1% 5.1
3.1 48.7%
51.3% -1.9 -2.5% 0
Mahoning
61.2% 35.8%
2.9% -28.3 -33.5
62.9% 37.1% -5.2
-0.5% 33
Pickaway
37.5% 61.0%
1.6% 4.1
5.5 37.7%
62.3% 1.4
1.1% 0
Ross
45.3% 53.1%
1.6% 2.0
3.2 44.7% 55.3%
1.3 2.8% 0
OPTISCAN
Allen
32.2%
66.1% 1.7%
14.3 15.8
33.3% 66.7%
1.5 -0.6% 0
Ashland
32.2% 65.1%
2.7% 6.6
7.5 34.5%
65.5% 0.9
-1.9% 0
Clermont
30.1% 68.0%
1.9% 25.7
36.4 29.1% 70.9%
10.7 3.9% 0
Coshocton
39.6% 58.3%
2.1% 2.6
2.4 42.6%
57.4% -0.2 -3.8% 0
Erie
51.0%
46.5% 2.5%
-1.5 -2.6 &
53.4% 46.6% -1.1
-2.3% 0
Geauga
36.4%
60.3% 3.3%
9.9 10.4
39.5% 60.5% 0.5
-2.9% 0
Hancock
28.9% 69.2%
1.9% 11.9
14.4 29.0% 71.0%
2.5 1.8% 0
Hardin
37.9%
60.1% 2.1%
2.4 3.5
36.6% 63.4% 1.1
4.6% 0
Lucas
58.1%
39.5% 2.3% -33.8
-43.5 60.1% p; 39.9%
-9.7 -1.7% ; 31
Miami
36.7%
61.2% 2.1%
10.2 16.0
34.0% 66.0% 5.8
7.4% 0
Ottawa
47.8%
50.0% 2.2%
0.4 0.9
48.0% 52.0% 0.5
1.7% 0
Sandusky
43.7% 54.0%
2.3% 2.5
3.9 43.8%
56.2% 1.4
2.1% 0
Washington
39.5% 58.4% 2.2%
4.9 4.9
41.6% 58.4% 0.0
-2.1% 0
2000
2000 2004
2004
Change Net
GORE
BUSH NADER Margin
Margin KERRY BUSH
Margin Margin Inc
PUNCH CARDS
Adams
35.3%
63.1% 1.6%
2.8 3.3
35.9% 64.1%
0.5 0.4% 0
Ashtabula
50.9% 46.2%
2.9% -1.8
-2.9 53.3% ; 46.7%
-1.1 -1.9% ; 0
Athens
53.6%
40.1% 6.3%
-3.0 -7.5 &
63.7% 36.3% -4.5
-13.8% 0
Belmont
54.5% 43.0%
2.5% -3.3
-2.0 53.0% ; 47.0%
1.4 5.5% 0
Brown
36.7%
61.6% 1.7% 4.0
5.4 36.1%
63.9% 1.4
2.8% 0
Butler
34.1%
63.9% 2.0%
39.0 52.6
33.7% 66.3% 13.5
2.9% 0
Carroll
41.4% 56.3%
2.3% 1.8
1.3 45.1%
54.9% -0.4 -5.1% 0
Champaign
38.3% 59.4% 2.2%
3.2 4.7
37.1% 62.9% 1.5
4.6% 0
Clark
49.0%
48.7% 2.4%
-0.2 1.6 &nnbsp;
48.8% 51.2% 1.8
2.7% 1
Clinton
32.0% 65.8%
2.2% 4.9
7.4 29.3%
70.7% 2.4
7.4% 0
Columbn
47.4% 49.9%
2.8% 1.1
2.3 47.6%
52.4% 1.3
2.3% 0
Crawford
35.5% 61.7%
2.8% 4.9
6.0 35.8%
64.2% 1.2
2.2% 0
Cuyahoga
63.0% 34.0% 3.0%
-156.8 -217.6 666.8%
33.2% -60.8 -4.6% 75
Darke
33.6%
64.4% 1.9%
6.9 10.2
30.0% 70.0% 3.3
9.1% 0
Defiance
38.5% 59.3%
2.3% 3.3
4.3 37.8%
62.2% 1.1
3.7% 0
Delaware
31.2% 66.7%
2.2% 19.0
25.7 33.6% 66.4%
6.7 -2.8% 0
Fairfield
35.5% 62.4%
2.1% 14.2
17.7 36.6% 63.4%
3.5 -0.2% 0
Fayette
36.5% 61.7%
1.8% 2.3
3.0 37.0%
63.0% 0.7
0.8% 0
Fulton
36.3%
61.7% 2.0%
4.7 5.3
37.6% 62.4% 0.7
-0.6% 0
Gallia
38.6%
59.7% 1.7%
2.6 3.1
38.4% 61.6%
0.5 2.1% 0
Greene
38.5%
59.1% 2.4%
12.8 17.5
38.5% 61.5% 4.7
2.4% 0
Guernsey
43.6% 53.7%
2.7% 1.5
2.0 43.7%
56.3% 0.6
2.4% 0
Hamilton
42.6% 54.9%
2.5% 44.1
24.7 47.0% 53.0%
-19.4 -6.2% p; 18
Harrison
48.1% 49.1%
2.7% 0.1
0.5 47.0%
53.0% 0.4
5.1% 0
Henry
33.1%
65.0% 1.9%
4.1 4.7
34.0% 66.0%
0.6 0.1% 0
Highland
34.8% 63.6%
1.6% 4.3
5.9 33.6%
66.4% 1.5
4.0% 0
Hocking
42.8% 54.5%
2.8% 1.2
0.8 47.1%
52.9% -0.4 -5.8% 0
Holmes
23.0%
75.0% 1.9%
4.6 5.7
24.0% 76.0%
1.1 0.0% 0
Huron
38.8%
58.5% 2.7%
4.1 4.2
41.6% 58.4%
0.1 -2.9% 0
Jackson
41.7% 56.5%
1.8% 1.8
2.9 39.7%
60.3% 1.1
5.8% 0
Jefferson
52.3% 45.0%
2.7% -2.4
-1.8 52.5% ; 47.5%
0.6 2.2% 0
Lawrence
46.6% 51.7%
1.7% 1.2
3.3 43.9%
56.1% 2.1
7.1% 0
Licking
37.5% 60.1%
2.4% 13.7
18.7 37.9% 62.1%
5.0 1.6% 0
Logan
32.6%
65.0% 2.5%
5.8 7.4
32.1% 67.9%
1.6 3.5% 0
Lorain
53.7%
43.4% 2.9% -11.2
-16.8 56.2% p; 43.8%
-5.6 -1.9% ; 0
Madison
36.4% 61.5%
2.1% 3.5
4.9 35.7%
64.3% 1.3
3.5% 0
Marion
42.1%
55.5% 2.4%
3.2 5.2
40.7% 59.3% 2.0
5.1% 0
Medina
40.4%
56.6% 3.0%
10.5 11.8 42.9%
57.1% 1.2
-2.1% 0
Meigs
38.0%
59.6% 2.4%
2.0 1.8
41.3% 58.7% -0.2
-4.2% 0
Mercer
28.9%
68.9% 2.2%
7.1 10.1
24.7% 75.3% 3.0
10.6% 0
Monroe
52.4%
45.5% 2.2%
-0.5 -0.8 &
55.3% 44.7% -0.3
-3.7% 0
Montgomery
49.8% 48.2% 2.0%
-3.7 -3.5 &
50.6% 49.4% 0.1
0.3% 0
Morgan
38.4%
58.6% 3.0%
1.2 0.9
43.2% 56.8% -0.3
-6.6% 0
Morrow
35.8%
61.8% 2.4%
3.3 4.7
35.4% 64.6% 1.4
3.1% 0
Muskingum
41.6% 55.6%
2.7% 4.4
5.9 42.3%
57.7% 1.4
1.4% 0
Noble
39.0% 58.3%
2.6% 1.1
1.2 40.8%
59.2% 0.1
-0.9% 0
Paulding
38.3% 59.0%
2.7% 1.8
2.5 36.8%
63.2% 0.7
5.6% 0
Perry
46.5%
50.8% 2.6%
0.5 0.6
48.1% 51.9% 0.0
-0.5% 0
Pike
47.1%
51.2% 1.7%
0.4 0.5
47.9% 52.1%
0.1 0.2% 0
Portage
50.6% 45.6%
3.8% -3.0
-4.9 53.2% ; 46.8%
-1.8 -1.5% ; 1
Preble
35.6%
62.2% 2.2%
4.7 6.3
34.7% 65.3%
1.6 4.1% 0
Putnam
23.7%
74.8% 1.5%
8.7 9.8
23.4% 76.6% 1.2
2.0% 0
Richland
39.4% 58.0%
2.5% 9.5
12.2 39.9% 60.1%
2.7 1.6% 0
Scioto
45.7%
52.4% 1.9%
2.0 1.5
47.8% 52.2% -0.5
-2.4% 0
Seneca
39.6%
57.7% 2.8%
4.3 4.9
40.8% 59.2% 0.6
0.3% 0
Shelby
33.9%
64.1% 2.0% 5.8
9.5 28.6%
71.4% 3.7
12.7% 0
Stark
47.7%
49.7% 2.6%
3.0 -2.4
50.7% 49.3% -5.5
-3.3% 1
Summit
53.7%
43.6% 2.7% -22.1
-36.7 56.8% p; 43.2%
-14.6 -3.5% p; 5
Trumbull
60.6% 36.5%
2.9% -22.4 -25.1
61.9% 38.1% -2.7
0.3% 0
Tuscarawas
43.6% 53.5% 2.9%
3.6 4.9
44.1% 55.9% 1.3
1.8% 0
Union
29.8%
68.1% 2.0%
6.3 9.0
29.6% 70.4%
2.7 2.6% 0
Van Wert
32.1% 66.2%
1.7% 4.4
6.5 27.7%
72.3% 2.1
10.5% 0
Vinton
41.9%
55.8% 2.3%
0.7 0.6
45.0% 55.0% -0.1
-3.9% 0
Warren
28.0% 70.5% 1.6%
28.5 41.1
27.6% 72.4% 12.6
2.2% 0
Wayne
35.3%
61.9% 2.8%
10.9 12.0
38.2% 61.8% 1.1
-3.0% 0
Williams
34.8% 63.0%
2.2% 4.3
5.4 34.9%
65.1% 1.1
2.1% 0
Wood
43.9%
53.2% 2.9%
4.7 4.4
46.4% 53.6% -0.4
-2.2% 0
Wyandot
34.9% 63.1%
2.0% 2.7
3.4 33.8%
66.2% 0.7
4.2% 0
___________________________________________________________________________________________________
Why would BushCo steal votes in NY? Kerry won the recorded vote by a whopping 18%. The simple answer: to pad his popular vote mandate”. This analysis shows that Kerry did much better in NY than the recorded vote indicates.
Naysayers cherry-picked the final
NY pre-election poll in an attempt to promote the myth that the pre-election
polls was correct and the exit polls was way off. In essence, they claimed that
the final pre-election poll matched a fraud-free recorded vote. But they can’t
provide evidence that ALL the votes
were counted accurately in ALL the precincts. Historical evidence indicates
that Lever machines are vulnerable to rigging. They fail to consider absentee
and provisional ballots. Dan Rather's voting machine expose
was a clear example of how mechanical voting machines can be rigged. In Florida
2000, poor-quality paper used in punch card machines was a major cause
of election fraud in heavily Democratic precincts. The report illuminated
another way to hack mechanical voting machines (punch card or lever).
They
failed to consider the NY 2000 vote: Gore
60.2 - Bush 35.2 - Nader 3.6. Their argument implies that the 2004
recorded vote was fraud-free and that 100% of returning Nader 2000 voters
defected to Bush - clearly an impossible scenario. In
fact, according to the 12:22am NEP, Kerry won Nader
voters by 71-21% and 10% of Bush voters defected to Kerry while just 8% of Gore
voters defected to Bush. Adjusting the NEP weights based on
the NY
2000 recorded vote and assuming 12:22am NEP vote shares, Kerry won by 63.6-35.1%.
They ignored the theoretical margin of error. It’s well-known that exit polls are more accurate than pre-election polls. There was a 5.1% discrepancy between Kerry's NY pre-election (59%) and exit poll (64.1%). Since the MoE is 4% for a typical 600-sample pre-election state poll, there was a 95% probability that Kerry's True vote was in the 55-63% range. The NY exit poll 3.2% MoE (30% cluster effect) implies there was a 95% chance that Kerry's True vote was in the 60.8-67.2% range which would fall within the MoE of both the NY pre-election and exit poll. On the other hand, the weighted average of 51 state pre-election polls (adjusted for undecided voters) matched the National Exit Poll to within 1%. Once again, it’s the Law of Large Numbers taking effect.
They failed to consider that Kerry’s vote
share was 10% higher in NY than nationally. The Election Calculator model
accounts for voter mortality, turnout and uncounted votes, determined that
Kerry won by 64.0-34.5%. The
assumptions were that Gore and Kerry won 75% of the uncounted votes (5% of
total cast); Kerry won 94% of Gore voters, 12% of Bush voters, 61% of new
(DNV2k) voters and 68% of returning Nader/other voters. A sensitivity analysis
shows that if Kerry won 90-98% of returning Gore voters and 57-65% of DNV2k,
his NY vote share ranged from 61.3 to 66.7%.
They
implied there was zero fraud in claiming that the recorded vote was the true
vote. An analysis of the effects of
uncounted and switched votes indicates that Kerry won by 63-36%. If 2% of
total votes cast were uncounted (75% to Kerry), then 7% of Kerry votes were
switched to Bush. The uncounted vote assumption is lower than the 2.74% national
average (NY uses lever voting machines).
2004
Kerry Bush Nader
4.31m 2.96m 0.10m
58.5% 40.2% 1.3%
2000
Gore
Bush Nader
4.11m
2.41m 0.24m
60.5%
35.4% 4.1%
Let’s first keep it simple by allocating defecting Nader 2000 voters to Kerry and Bush.
According to the NEP, of the 2.8% Nader voters who defected, 2.1% voted for Kerry; 0.7% for Bush.
Assuming an equal defection of Gore and Bush voters:
Kerry = 60.5 + 2.1 = 62.6%
Bush = 35.4 + 0.7 = 36.1%
But according to the NEP, 8% of Gore voters and 10% of Bush voters defected (net 2% to Kerry)
Kerry
= 62.6% + 1 = 63.6%
Bush = 36.1% -1 = 35.1%
Finally, assume that 3% of the total NY votes cast were uncounted.
(2.25% to Kerry and 0.75% to Bush, net 1.50% to Kerry)
It’s a near-perfect match to the NY Exit poll:
Kerry = 63.6 + .75 = 64.35%
Bush = 35.1 - .75 = 34.35%
1. Kerry won three NY exit poll measures by an average of 64.1%. His recorded share was 58.5%.
2. Mechanical voting machine precincts had the highest national Within Precinct Error (10.6%). New York votes 99% by Lever.
3. According to the National Exit Poll, Kerry won 57% of new voters; 91% of Gore; 64% of Nader; 10% of Bush.
4. Kerry’s NY vote share was 10% higher than his national share. Therefore, his NY shares must have exceeded the corresponding national shares.
5. Kerry won 66% of the final 500k recorded votes and just 58% of the initial 6.8m; Gore won 74% of the final 500k and 60% of the initial 6.3m.
6. Kerry won approximately 75% of the uncounted votes (included in the exit poll but not the official count).
7. Kerry had his highest NY shares in the four counties which also had the highest rates of voting incidents.
8. Bush gained a total of 573k votes in NY (25.8%) from 2000; Kerry gained just 246k (6.6%); Nader lost 196k.
9. Kerry won returning Nader
voters by a 47% margin over Bush; he won new voters by 16%. Bush 2000 voters
defected to Kerry at a 2% higher rate than Gore voters to Bush. If we
conservatively assume that Kerry’s share of New and former NY Gore voters was
just 1% higher than his National share, then Bush needed 100% of former Bush
voters to match the official count! The net defection rate would have had
to flip from Kerry (+2%) to Bush (+7%). So how did Bush improve his NY vote
share by over 5%?
10: This is the essence of the Urban Legend: Bush made big gains in heavily Democratic urban/suburban strongholds yet did not do well in small towns and rural areas, his own strongholds. Seven strongly Democratic NYC area counties comprised 50% of the total New York State recorded vote; Kerry had 66% in the seven counties, but Bush gained 311k (41.3%) over his 2000 vote; Kerry improved by just 129k (5.4%) over the Gore vote; Nader lost 89k. In the other counties, Bush had 48% and gained 262k votes (7.6%) while Kerry gained 118k (3.4%).
This graph illustrates the Bush Urban Legend: the implausible change in votes from 2000 to 2004 for the largest 15 NY counties.
11. Since Kerry won 64% (57k) and Bush 17% (15k) of returning Nader voters, Kerry would have a 72/27% margin in the seven counties assuming an equal defection of Bush and Gore voters. But according to the National Exit Poll, 10% of Bush voters defected and 8% of Gore voters defected. Assuming a net 2% defection to Kerry, he would have had a 73-26% margin in the seven counties. So how could the Bush vote share increase by 6.4% (26.5 to 32.9%) and the Kerry share decline by 3.6% (69.6 to 66.0%)? That’s a 10% increase in Bush margin!
________________________________________________________________________
NY Pre-election and Exit Polls
New
York
Kerry Bush Nader
Recorded
vote
58.5% 40.2% 1.3%
Final pre-election poll
57 39 1
Projection
59 40 1
Edison-Mitofsky
Exit Poll Measures
WPE
(11.4)
64.1% 34.4% 1.5%
Best
Estimate
65.1 33.8 1.1
Composite
63.1 35.5 1.4
Average Voting Machine WPE for all Exit Poll Precincts
Mechanical (Lever) voting machine precincts had the highest mean Within Precinct Error (-10.6%).
Paper ballot precincts had the smallest mean WPE (-2.2%)
New York votes 99% by Lever.
|
Polling |
Place |
WPE mean |
WPE median |
|
Number precincts |
|
Paper |
Ballot |
-2.2 |
-0.9 |
|
40 |
|
Mechanical |
Voting |
-10.6 |
-10.3 |
|
118 |
|
Touch |
Screen |
-7.1 |
-7 |
|
360 |
|
Punch |
Cards |
-6.6 |
-7.3 |
|
158 |
|
Optical |
Scan |
-6.1 |
-5.5 |
|
573 |
NY 2004 Election Calculator
Assumptions:
95% turnout
1.22% annual voter mortality
No uncounted votes
Plausible Scenarios
Scenario 1:
(12:22am National Exit Poll vote shares)
Turnout Voted Mix Kerry
Bush Other
DNV
1.236 16.7%
57% 41% 2%
Gore
95% 3.718
50.4% 91%
8% 1%
Bush
95% 2.172
29.4% 10%
90% 0%
Nader
95% 0.250
3.4% 64%
17% 19%
Total
6.140 7.376 100%
60.54% 37.98% 1.48%
7.376 4.465 2.801 0.109
Scenario 2:
(Kerry vote shares increased for
NY)
Turnout Voted Mix Kerry
Bush Other
DNV
1.236
16.7% 61%
37% 2%
Gore
95% 3.718
50.4% 94%
5% 1%
Bush
95% 2.172
29.4% 12%
88% 0%
Nader
95% 0.250
3.4% 68%
13% 19%
Total
6.140 7.376
100% 63.45% 35.07% 1.48%
7.376 4.680 2.587 0.109
Implausible Scenarios
(vote shares adjusted to
match to recorded vote)
Scenario 1:
Bush wins 100% of Nader 2000
voters
Turnout Voted Mix Kerry
Bush Other
DNV 1.236
16.7% 57%
41% 2%
Gore
95% 3.718
50.4% 91%
8% 1%
Bush
95% 2.172
29.4% 10%
90% 0%
Nader
95% 0.250
3.4% 0%
100% 0%
Total
6.140 7.376 100%
58.37% 40.79% 0.84%
7.376
4.305 3.009 0.062
Scenario 2:
Bush wins 100% of Bush 2000
voters
Turnout Voted Mix Kerry
Bush Other
DNV
1.236
16.7% 57%
41% 2%
Gore
95% 3.718
50.4% 91%
8% 1%
Bush
95% 2.172
29.4% 0%
100% 0%
Nader
95% 0.250
3.4% 64%
17% 19%
Total
6.140 7.376 100%
57.60% 40.92% 1.48%
7.376 4.248
3.018 0.109
Scenario 3:
Bush wins 54% of New 2004 voters (DNV)
Turnout Voted Mix Kerry
Bush Other
DNV 1.24
16.7% 44% 54%
2%
Gore
95% 3.72
50.4% 91%
8% 1%
Bush
95% 2.17
29.4% 10%
90% 0%
Nader
95% 0.25
3.4% 64%
17% 19%
Total
6.140 7.376 100%
58.36% 40.15% 1.48%
7.376
4.305 2.962 0.109
Sensitivity Analysis
I
Assumptions:
Bush 2000 voter turnout: 95%
2% uncounted votes
1.22% annual voter mortality
Gore
share
of Unctd
Gore Voter
Turnout
Votes
91.0% 93.0% 95.0%
97.0% 99.0%
Kerry National
Vote
95.0%
62.1% 62.4% 62.8%
63.2% 63.5%
85.0%
61.9% 62.3% 62.7%
63.0% 63.4%
75.0%
61.8% 62.1% 62.5%
62.9% 63.2%
65.0%
61.6% 62.0% 62.4%
62.7% 63.1%
55.0%
61.5% 61.9% 62.2%
62.6% 62.9%
Kerry Margin (millions)
95.0% 1.90
1.96 2.01 2.06
2.12
85.0% 1.88
1.93 1.99 2.04
2.10
75.0% 1.86
1.91 1.97 2.02
2.07
65.0% 1.84
1.89 1.94 2.00
2.05
55.0% 1.82
1.87 1.92 1.98
2.03
Sensitivity Analysis
II
Kerry share of Bush 2000 voters: 10%
2% uncounted votes
1.22% annual voter mortality
Kerry Share
of
Gore New
voters (DNV in
2000)
Voters 56.0%
58.0% 60.0% 62.0% 64.0%
Kerry National
Vote
97.0%
63.9% 64.2% 64.5%
64.9% 65.2%
95.0% 62.9%
63.2% 63.5% 63.9% 64.2%
93.0%
61.8% 62.2% 62.5%
62.8% 63.2%
91.0%
60.8% 61.2% 61.5%
61.8% 62.2%
89.0%
59.8% 60.1% 60.5%
60.8% 61.2%
Kerry Margin
(millions)
97.0% 2.17
2.22 2.27 2.32
2.37
95.0% 2.02
2.07 2.12 2.17
2.22
93.0% 1.87
1.92 1.97 2.02
2.07
91.0% 1.71
1.76 1.81 1.86
1.92
89.0% 1.56
1.61 1.66 1.71
1.76
________________________________________________________________________
New York County Vote Changes
(93.4% of final recorded total)
Vote Change
Kerry
Bush
Total
NYS
246k 6.6% 573k 25.8%
Top 7
Counties 129k
5.4% 311k 41.3%
Final Recorded
Vote
Total Dem Nader
Bush
Dem Nader
Bush
2004 7,377 4,314
99
2,963
58.48% 1.35%
40.17%
2000 6,762 4,112
244
2,405
60.82% 3.61%
35.57%
Change 614 201
-144
557
4.9% -59.1%
23.2%
Preliminary Recorded
vote
2004 6,892 3,993
103
2,795
57.94% 1.50%
40.56%
2000 6,269 3,746
300
2,222
59.76% 4.79%
35.45%
Change 622
246 -197
573
6.6% -65.5% 25.8%
Change from Preliminary to Final
2004 485
320 -3
167
66.1% -0.75% 34.6%
2000 493
366 -56
183
74.2% -11.4%
37.1%
Seven NYC Area Counties
2000
2004
Vote Change
Percent
Change
County
Precincts Total GORE
BUSH NADER Total
KERRY BUSH NADER
KERRY
BUSH NADER KERRY
BUSH
Total
7779
3093 69.6% 26.5%
4.1% 3442 66.0%
32.9% 1.1%
129
311 -89
5.4% 41.3%
Brooklyn
1888
557 80%
16% 4%
630 74%
25% 0.8%
23.3
67.2 -17.1 5%
75%
Suffolk
1006
536 53%
42% 5%
618 49%
49% 2.1%
18.0
77.7 -13.7 6%
35%
Nassau
1070
554 58%
39% 4%
597 52%
47% 1.0%
-6.7 ;
64.5 -14.7 -2% 30%
Manhattan
1100
522 79%
15% 6%
572 82%
17% 1.4%
59.1
16.4 -25.1 14% 21%
Queens
1470
512 74%
23% 3%
559 71%
28% 0.8%
18.3
41.3 -11.9 5%
36%
Bronx
912
279 86%
12% 2%
318 83%
17% 0.6%
22.8
19.7 -3.9 10%
59%
Staten Island
333 133
52% 45%
3% 148
42% 57%
0.8%
-6.2 ;
24.3 -2.9 -9%
40%
Total New York Counties
2000
2004
Vote Change
Percent
Change
County
Precincts Total GORE
BUSH NADER Total
KERRY BUSH NADER
KERRY
BUSH NADER KERRY
BUSH
Total
15553
6270 59.8% 35.4%
4.8% 6892
57.9% 40.6% 1.5%
247
573 -197 6.6%
25.8%
Brooklyn
1888
557 80%
16% 4%
630 74%
25% 0.8%
23.3
67.2 -17.1 5%
75%
Suffolk
1006
536 53%
42% 5%
618 49%
49% 2.1%
18.0
77.7 -13.7 6%
35%
Nassau
1070
554 58%
39% 4%
597 52%
47% 1.0%
-6.7 ;
64.5 -14.7 -2% 30%
Manhattan
1100
522 79%
15% 6%
572 82%
17% 1.4%
59.1
16.4 -25.1 14% 21%
Queens
1470
512 74%
23% 3%
559 71%
28% 0.8%
18.3
41.3 -11.9 5%
36%
Erie
1007 384
57% 37%
6% 411
56% 42% 2.2%
13.3
27.7 -13.5 6%
19%
Westchester
948 306
58% 37%
4% 377 58%
41% 1.5%
39.5
38.9 -7.3 22%
34%
Monroe
792
300 51%
44% 5%
330 50%
48% 1.6%
13.9
26.3 -10.2 9%
20%
Bronx
912
279 86%
12% 2%
318 83%
17% 0.6%
22.8 19.7
-3.9 10% &nnbsp; 59%
Onondaga
485
190 54%
41% 5%
199 54%
44% 1.8%
5.4 10.1 -6.5 5%
13%
Staten Island
333 133
52% 45%
3% 148
42% 57% 0.8%
-6.2 ;
24.3 -2.9
-9% 40%
Albany
327
130 60%
34% 6%
136 60%
38% 1.9%
3.8
6.9 -5.6
5% 16%
Orange
284
118 46%
50% 5%
135 44%
55% 1.3%
5.1
16.0 -3.7 9%
27%
Rockland
250
117 56%
40% 4%
122 49%
50% 1.5%
-6.0 ;
13.7 -2.7
-9% 29%
Dutchess
239
105 47%
47% 6%
114 47%
52% 1.6%
4.0
9.7 -4.7
8% 20%
Saratoga
168
89 45%
50% 5%
100 45%
53% 1.8%
4.7
8.3 -2.3
12% 19%
Niagara
180 87
52% 43%
5% 90
49% 49%
1.9%
-1.2 ;
5.9 -2.7
-3% 16%
Oneida
209
87 45%
49% 5%
89 42%
55% 2.3%
-1.7 ;
6.5 -2.6
-4% 15%
Broome
193
81 52%
43% 6%
84 50%
48% 2.0%
0.0
5.7 -3.0 0%
16%
Ulster
161
72 48%
44% 8%
84 54%
43% 2.3% 10.6
4.8 -4.1
30% 15%
Rensselaer
136
64 51%
43% 6%
67 49%
48% 2.2%
0.5
4.8 -2.4
2% 17%
Schenectady
131 63
53% 42%
5% 65
52% 47%
1.8%
0.0
4.0 -2.1
0% 15%
Chataqua
135
55 46%
49% 5%
57 45%
53% 1.9%
0.0
3.0 -1.4
0% 11%
Oswego
107
45 47% 48%
5% 49
47% 51%
2.0% 1.8
2.9 -1.3
9% 13%
Ontario
88
42 44%
51% 5%
47 42%
56% 1.6%
1.1
4.5 -1.4 6%
21%
Putnam
72
40 44%
51% 5%
44 41%
58% 1.1%
0.6
4.7 -1.7
3% 23%
Steuben
82
38 36%
59% 4%
39 34%
64% 1.7%
-0.3 ;
2.9 -1.0 -2%
13%
Wayne
67 36
39% 56%
4% 39
38% 60%
1.7%
0.4
2.9 -1.0 3%
14%
Tompkins
67 37
54% 34%
12% 38
64% 34%
2.4% 4.8
0.6 -3.6
25% 5%
StLawrence
99
37 54%
41% 5%
38 55%
44% 1.9%
0.8
1.3 -1.1
4% 9%
Chemung
82
35 46%
50% 4%
38 43% 54%
2.4%
0.5
3.3 -0.6
3% 19%
Jefferson
83
27 42%
47% 10%
35 43%
55% 2.1%
3.7
6.3 -2.1
32% 49%
Cayuga
61
30 49%
45% 6%
32 50%
48% 2.2%
1.6
2.3 -1.0
11% 17%
Catargus
74 32
40% 55%
5% 32
39% 59%
1.8% -0.3
1.5 -1.0
-3% 8%
Clinton
64
29 50%
44% 6%
31 52%
46% 2.1%
1.9
1.6 -1.0
13% 12%
Livingston
57
26 39%
56% 6%
29 38%
60% 2.1%
1.4
3.4 -0.8
14% 24%
Sullivan
63 25
50% 45%
5% 28
49% 50%
1.9%
1.0
2.5 -0.8
8% 22%
Madison
51
26 42%
52% 5%
28 43%
55% 1.8%
0.9
1.7 -0.8
8% 12%
Warren
57
26 43%
52% 5%
28 43%
55% 2.0%
0.7
1.9 -0.8 7%
14%
Herkimer
61 25
44% 51%
5% 26
41% 57% 2.0%
-0.5 ;
1.9 -0.7
-4% 15%
Columbia
54 26
47% 46%
7% 26
54% 43%
2.1% 1.7 -0.8
-1.4 14% &nnbsp; -7%
Genesee
53
26 40%
55% 5% 26
37% 61%
1.6% -0.8
1.4 -1.0 -8%
10%
Otsego
58
23 45%
48% 7%
25 47%
51% 2.0%
0.8
1.3 -1.0 8%
11%
Washington
51
22 41%
53% 6%
23 42%
56% 2.4% 0.8
1.4 -0.7
9% 12%
Greene
52
19 40%
54% 6%
23 39%
59% 2.0%
1.3
3.2 -0.7 17%
31%
Tioga
46 21
41% 54%
5% 22
40% 58%
1.7%
0.4
1.4 -0.6
4% 13%
Cortland
42 20
47% 47%
6% 21
47% 51%
1.9%
0.7
1.5 -0.7
7% 16%
Fulton
49
21 43%
53% 4%
21 41%
57% 1.9%
-0.4 ;
0.6 -0.5 -4%
6%
Delaware
59 19
42% 53%
5% 20
40% 58%
2.4% 0.2
1.6 -0.5
3% 16%
Montgomery
49
20 49%
47% 4%
20 44%
54% 1.9%
-0.9 ;
1.4 -0.4
-9% 15%
Chenang
39
19 45%
50% 5%
20 43%
55% 2.0%
-0.1 ;
1.3 -0.6
-1% 14%
Allegany
41 17
35% 61%
5% 18
34% 64%
1.7%
0.0
1.0 -0.5 0%
10%
Essex
39 16
44% 49%
7% 17
46% 52%
2.2% 0.6
0.9 -0.7
8% 11%
Wyoming
39
17 35%
60% 5%
17 34%
65% 1.4%
-0.1 ;
0.9 -0.5
-2% 9%
Franklin
49
16 50%
45% 5%
17 51%
47% 1.9%
0.6
0.7 -0.5
7% 9%
Orleans
40
15 38%
58% 4%
16 35%
63% 1.6%
-0.1 ;
1.2 -0.4 -2%
13%
Seneca
27
13 48%
47% 5%
14 45%
52% 2.1%
0.1
1.3 -0.4 2%
21%
Schoharie
29
13 39%
55% 5%
13 39%
59% 2.1%
0.2
0.9 -0.4
4% 14%
Lewis
30 10
40% 56%
4% 11
40% 58%
1.9%
0.3
0.6 -0.2 8%
10%
Yates
20
9 39%
55% 5% 10
39% 60%
1.6%
0.2
0.7 -0.3
5% 15%
Schuyler
17
8 40%
54% 6%
8 40%
58% 1.9%
0.2
0.7 -0.3 8%
18%
Hamilton
11
3 29%
64% 7%
3 32%
66% 1.6%
0.1 0.1
-0.2 15% &nnbsp; 6%
________________________________________________________________________
NY 2000-2004 County Vote
Analysis
The data includes the first 6.3m of 6.8m recorded 2000 votes (Gore won
65% of the final 569,000) and the first 6.8m of
7.3m recorded 2004 votes (Kerry won 64% of the final 499,000).
Vote Change Kerry Bush Total NYS 246k 6.6% 573k 25.8% Top 7 Counties 129k 5.4% 311k 41.3% Final Recorded Vote Total Dem Other Bush Dem Other Bush 2004 7,391 4,314 114 2,963 58.4% 1.5% 40.1% 2000 6,822 4,108 311 2,405 60.2% 4.6% 35.2% Change 569 206 -197 558 -1.8% -3.1% 4.9% Preliminary Recorded Vote 2004 6,892 3,993 104 2,796 57.9% 1.5% 40.6% 2000 6,270 3,747 300 2,222 59.8% 4.8% 35.4% Change 622 246 -196 573 -1.9% -3.3% 5.2% Change from Preliminary to Final 2004 499 321 10 167 64.3% 2.1% 33.6% 2000 552 361 11 183 65.4% 1.9% 32.7%
Analysis of Change in
Margin
2000
Gore
2004
Kerry
Increase in Bush
County
Gore
Bush Nader
Margin Kerry
Bush Nader Margin
Margin Vote
Albany
59.7%
34.0% 6.3%
25.7%
60.2% 37.8% 1.9%
22.4%
3.3% 6922
Allegany
34.7% 60.5%
4.8%
-25.8% &nbssp;
33.8% 64.5% 1.7%
-30.6% &nbbsp;
4.8% 1031
Bronx
86.0%
11.9% 2.1%
74.1%
82.7% 16.7% 0.6%
66.0%
8.0% 19734
Brooklyn
79.9% 16.1%
4.0%
63.9%
74.3% 24.8% 0.8%
49.5%
14.4% 67235
Broome
51.8%
42.5% 5.7%
9.3%
50.1% 47.9% 2.0%
2.2%
7.0% 5684
Catargus
40.4% 54.6%
5.1%
-14.2% &nbssp;
39.2% 59.0% 1.8%
-19.8% &nbbsp;
5.6% 1453
Cayuga
49.3%
44.9% 5.8%
4.4%
49.9% 47.9% 2.2%
2.0%
2.4% 2266
Chataqua
46.3% 49.1%
4.5%
-2.8% p;
45.1% 53.1% 1.9%
-8.0% &nbssp;
5.3% 3038
Chemung
46.1% 49.8%
4.2%
-3.7% p;
43.4% 54.3% 2.4%
-10.9% &nbbsp;
7.2% 3327
Chenang
44.8% 49.7%
5.5%
-4.8% p;
43.0% 55.0% 2.0%
-12.0% &nbbsp;
7.1% 1343
Clinton
50.4% 43.9%
5.7%
6.4%
52.4% 45.5% 2.1%
6.9%
-0.4% 1565
Columbia
46.9% 45.8%
7.3%
1.1%
54.4% 43.5% 2.1%
10.9%
-9.8% -829
Cortland
47.1% 47.1%
5.9%
0.0%
47.1% 51.0% 1.9%
-3.8% &nbssp;
3.8% 1498
Delaware
41.5% 53.2%
5.2%
-11.7% &nbssp;
39.8% 57.7% 2.4%
-17.9% &nbbsp;
6.2% 1628
Dutchess
46.7% 47.1%
6.2% -0.4%
46.5% 51.9% 1.6%
-5.3% &nbssp;
4.9% 9666
Erie
56.8%
37.4% 5.9%
19.4%
56.2% 41.6% 2.2%
14.6%
4.8% 27705
Essex
44.2%
49.0% 6.8%
-4.8% p;
45.7% 52.2% 2.2%
-6.5% &nbssp;
1.7% 912
Franklin
50.1% 44.6%
5.3%
5.5%
51.4% 46.7% 1.9%
4.7%
0.8% 678
Fulton
42.7%
53.1% 4.2%
-10.5% &nbssp;
41.3% 56.8% 1.9%
-15.6% &nbbsp;
5.1% 644
Genesee
39.8% 54.9%
5.2%
-15.1% &nbssp;
37.2% 61.2% 1.6%
-23.9% &nbbsp;
8.9% 1393
Greene
40.0%
53.8% 6.2%
-13.7% &nbssp;
39.2% 58.8% 2.0%
-19.7% &nbbsp;
5.9% 3237
Hamilton
28.8% 64.3%
6.9%
-35.5% &nbssp;
32.2% 66.2% 1.6%
-34.0% &nbssp;
-1.5% 131>
Herkimer
44.1% 51.1%
4.8%
-7.1% p;
41.0% 57.0% 2.0%
-16.0% &nbbsp; 9.0%
1910
Jefferson
42.3% 47.4%
10.3%
-5.1% p;
43.2% 54.7% 2.1%
-11.5% &nbbsp;
6.4% 6343
Lewis
39.7%
56.0% 4.3%
-16.4% &nbssp;
40.3% 57.9% 1.9%
-17.6% &nbbsp;
1.3% 575
Livingston
38.6% 55.9% 5.5%
-17.3% &nbssp;
38.1% 59.8% 2.1% -21.7%
4.3%
3363
Madison
42.5% 52.3%
5.2%
-9.8% p;
43.0% 55.2% 1.8%
-12.2% &nbbsp;
2.4% 1686
Manhattan
78.5% 15.1%
6.3%
63.4%
81.9% 16.7% 1.4%
65.3%
-1.9% 16421
Monroe
50.8%
44.1% 5.1%
6.6%
50.4% 48.1% 1.6%
2.3%
4.4% 26322
Montgomery
49.3% 46.9% 3.8%
2.5%
44.5% 53.6% 1.9%
-9.1% &nbssp;
11.6% 1388
Nassau
57.6%
38.7% 3.7%
18.9%
52.3% 46.7% 1.0%
5.6%
13.3% 64523
Niagara
51.7% 43.3%
5.0% 8.4%
49.2% 48.9% 1.9%
0.3%
8.1% 5919
Oneida
45.4%
49.3% 5.3%
-3.9% p;
42.3% 55.4% 2.3%
-13.1% &nbbsp;
9.2% 6538
Onondaga
53.8% 40.9%
5.3%
12.9% 54.1%
44.1% 1.8%
9.9%
3.0% 10102
Ontario
43.6% 51.4%
5.0%
-7.9% p;
42.0% 56.4% 1.6%
-14.4% &nbbsp;
6.6% 4541
Orange
45.8%
49.6% 4.6%
-3.8% p;
43.6% 55.0% 1.3%
-11.4% &nbbsp;
7.6% 16027
Orleans
37.8% 58.0%
4.2%
-20.2% &nbssp;
35.5% 63.0% 1.6%
-27.5% &nbbsp;
7.3% 1150
Oswego
47.0%
48.1% 4.9%
-1.0% p;
47.4% 50.6% 2.0%
-3.1% &nbssp;
2.1% 2869
Otsego
45.4%
48.1% 6.5%
-2.7% p;
46.8% 51.2% 2.0%
-4.4% &nbssp;
1.7% 1252
Putnam
43.5%
51.0% 5.5%
-7.4% p;
41.3% 57.5% 1.1%
-16.2% &nbbsp; 8.8%
4697
Queens
74.2%
22.5% 3.2%
51.7%
71.2% 28.0% 0.8%
43.2%
8.5% 41325
Rensselaer
50.9% 43.2% 6.0%
7.7%
49.4% 48.4% 2.2%
1.0%
6.7% 4817
Rockland
55.9% 40.2%
3.9%
15.7%
48.7% 49.8% 1.5%
-1.1% &nbssp;
16.8% 13655
St Lawrence
53.9% 41.2% 4.9%
12.7%
54.6% 43.5% 1.9%
11.0%
1.6% 1319
Saratoga
45.4% 50.0%
4.7%
-4.6% p;
45.2% 53.0% 1.8%
-7.8% &nbssp;
3.2% 8344
Schenectady
53.2% 41.7% 5.2%
11.5%
51.5% 46.7% 1.8%
4.9%
6.6% 4008
Schoharie
39.3% 55.5%
5.2%
-16.1% &nbssp;
38.6% 59.4% 2.1%
-20.8% &nbbsp;
4.7% 941
Schuyler
40.4% 53.8%
5.9%
-13.4% &nbssp;
40.0% 58.1% 1.9%
-18.1% &nbbsp;
4.7% 721
Seneca
47.9%
46.7% 5.4% 1.3%
45.5% 52.5% 2.1%
-7.0% &nbssp;
8.2% 1277
Staten Island
51.8% 45.2% 3.1%
6.6%
42.3% 56.9% 0.8%
-14.7% &nbbsp;
21.3% 24335
Steuben
36.3% 59.4%
4.3%
-23.2% &nbssp;
33.9% 64.4% 1.7%
-30.5% &nbbsp;
7.3% 2906
Suffolk
53.2% 41.8%
5.0%
11.4%
49.1% 48.8% 2.1%
0.3%
11.2% 77671
Sullivan
49.8% 45.0%
5.2%
4.7%
48.5% 49.5% 1.9%
-1.0% &nbssp;
5.8% 2513
Tioga
40.8%
54.5% 4.7%
-13.6% &nbssp;
40.3% 58.0% 1.7%
-17.7% &nbbsp;
4.1% 1447
Tompkins
54.0% 33.7%
12.3%
20.3%
63.9% 33.7% 2.4%
30.2%
-10.0% 627
Ulster
48.2%
43.5% 8.3%
4.6%
54.3% 43.4% 2.3%
10.9%
-6.3% 4831
Warren
43.2%
51.7% 5.1%
-8.6% p;
42.9% 55.1% 2.0%
-12.2% &nbbsp; 3.7%
1913
Washington
41.1% 53.1% 5.7%
-12.0% &nbssp;
42.1% 55.6% 2.4%
-13.5% &nbbsp;
1.5% 1351
Wayne
39.2%
56.4% 4.4%
-17.2% &nbssp;
38.0% 60.4% 1.7%
-22.4% &nbbsp;
5.2% 2857
Westchester
58.4% 37.4% 4.2%
21.0%
57.9% 40.7% 1.5%
17.2%
3.8% 38923
Wyoming
35.0% 60.4%
4.6%
-25.4% &nbssp;
33.7% 64.9% 1.4%
-31.2% &nbbsp;
5.8% 919
Yates
39.5%
55.4% 5.1%
-15.9% &nbssp;
38.8% 59.6% 1.6%
-20.8% &nbbsp;
4.9% 735
__________________________________________________________________________________________________
California
California Secretary of State Bowen decertified Touch Screens (DRE) and mandated a complete audit for counties with Optical Scanners. This analysis shows that the largest vote discrepancies were in DRE counties. Bush's recorded CA vote share increased by 2.9% over 2000 while the Kerry share increased by 0.9% over Gore. Assuming zero voter defection, this implies that Bush won 76% of returning Nader voters. But this is clearly impossible since the National Exit Poll reported that 71% of Nader voters switched to Kerry, 21% to Bush and 8% to Other.
Election Calculator
2004 Recorded
Kerry
Bush Other
6.75
5.51 0.14
54.4%
44.5% 1.1%
Exit Poll (WPE)
59.9%
38.9% 1.2%
Uncounted
3.0%
75%
23% 2%
0.29
0.09 0.01
Switched
6.1%
-9.9% 23.5%
0.46
-0.50 0.04
2000
Recorded
2004 Calculated
Voted
Rec Unctd
Cast Deaths
Alive Turnout
Voted Weight Kerry Bush Other
DNV DNV
2.43 19.0% 60%
38% 2%
Gore
5.86 0.42
6.28 0.31
5.97
95% 5.68
44.4% 93% 6% 1%
Bush
4.57 0.11
4.68 0.23
4.45
95% 4.23 33.1%
11% 89% 0%
Nader
0.46 0.03
0.49 0.02
0.46
95% 0.44
3.4% 66% 15% 19%
Total
10.89 0.57 11.46
0.56
10.89
10.34 12.78 100%
58.7% 39.9% 1.5%
12.78
7.49 5.09 0.19
Sensitivity
Analysis 1:
Kerry
share of Gore and New voters
Kerry Vote
Share
Kerry
share of
New voters (DNV in
2000)
Gore
56.0% 58.0% 60.0%
62.0% 64.0%
97.0%
59.7% 60.0% 60.4%
60.8% 61.2%
95.0%
58.8% 59.2% 59.5%
59.9% 60.3%
93.0%
57.9% 58.3% 58.6%
59.0% 59.4%
91.0%
57.0% 57.4% 57.8%
58.1% 58.5%
89.0%
56.1% 56.5% 56.9% 57.3%
57.6%
Kerry
Margin
97.0% 2.66
2.76 2.85 2.95
3.05
95.0% 2.43
2.53 2.63 2.72
2.82
93.0% 2.20
2.30 2.40 2.50
2.59
91.0% 1.98
2.07 2.17 2.27
2.37
89.0% 1.75
1.85 1.94 2.04
2.14
Sensitivity
Analysis 2:
Gore
voter Turnout, Gore Uncounted vote share
Kerry Vote
Share
Gore
share of Gore
Voter
Turnout
Unctd
93.0% 94.0% 95.0%
96.0% 97.0%
85.0%
58.7% 58.8% 59.0%
59.1% 59.3%
80.0%
58.5% 58.7% 58.8%
59.0% 59.1%
75.0%
58.3% 58.5% 58.6%
58.8% 59.0%
70.0%
58.2% 58.3% 58.5%
58.6% 58.8%
65.0%
58.0% 58.2% 58.3%
58.5% 58.6%
Kerry Margin
85.0% 2.41
2.45 2.49 2.53
2.57
80.0% 2.36
2.40 2.44 2.48
2.52
75.0% 2.32
2.36 2.40 2.44
2.48
70.0% 2.27
2.31 2.35 2.39
2.43
65.0% 2.23
2.27 2.31 2.35
2.39
* indicates fraud likely
California
2000
2004
County
GORE
BUSH
NADER
KERRY BUSH
Knet Kadj Diff
TOTAL
54.3%
41.9%
3.8%
55.2%
44.8%
-2.0% 57.2% p; 2.0%
AVERAGE
DRE
50.9%
45.8%
3.4%
50.7% 49.3%
-3.8% 53.4% p; 2.8%
Optical scan
56.2% 39.7%
4.0%
57.5%
42.5%
-1.5% 59.4% p; 1.9%
Punch card
46.6% 49.3%
4.1%
47.8% 52.2%
-1.6% 49.7% p; 1.9%
DRE
Alameda
70.2% 24.1%
5.7%
75.2% 24.8%
4.3% 74.6% -0.6%
Merced*
45.7% 52.0%
2.3%
42.8%
57.2%
-8.1% 47.4% p; 4.7%
Napa
55.2% 40.0%
4.8%
60.4%
39.6%
5.6% 58.9% -1.5%
Orange*
40.9% 56.3%
2.8%
39.7%
60.3%
-5.0% 43.0% p; 3.3%
Plumas
33.7%
61.9%
4.4%
37.0% 63.0%
2.2% 37.1% 0.1%
Riverside*
45.6% 51.8%
2.6%
41.6%
58.4%
-10.4% 47.6% &nbssp; 5.9%
San Bernard*
48.0% 49.3%
2.6%
43.7%
56.3%
-11.3% 50.1% &nbssp; 6.4%
Santa Clara
61.8% 34.7%
3.5%
64.9%
35.1%
2.6% 64.5% -0.4%
Shasta
30.9%
65.9%
3.2%
31.6%
68.4%
-1.8% 33.4% p; 1.7%
Tehama
31.9%
64.6%
3.4%
32.7% 67.3%
-1.9% 34.6% p; 1.9%
OPTICAL
SCANNERS
Amador
38.8%
57.4%
3.8%
37.2% 62.8%
-7.0% 41.7% p; 4.5%
Butte
38.3%
54.7%
6.9%
45.1% 54.9%
6.6% 43.7% -1.4%
Colusa
31.8%
65.5%
2.8%
32.1% 67.9%
-2.2% 33.9% p; 1.8%
Contra Costa
59.6% 37.0% 3.4%
62.9%
37.1%
3.2% 62.3% -0.7%
Fresno*
43.7% 53.4%
3.0%
41.7% 58.3%
-6.9% 45.9% p; 4.3%
Humboldt
45.7% 40.9%
13.3%
59.8%
40.2%
14.8% 56.0% -3.8%
Kern*
36.6%
61.5%
1.9%
32.5% 67.5%
-10.0% 38.0% &nbssp; 5.5%
Kings*
40.0%
58.0%
2.0%
34.3% 65.7%
-13.5% 41.6% &nbssp; 7.3%
Lake
52.0%
41.9% 6.1%
54.2%
45.8%
-1.7% 56.7% p; 2.5%
Lassen
28.8%
67.9%
3.2%
28.0% 72.0%
-4.9% 31.3% p; 3.3%
Los Angeles*
64.2% 32.6%
3.1%
63.6%
36.4%
-4.3% 66.6% p; 3.0%
Madera
35.3%
61.4%
3.3%
35.1% 64.9%
-3.7% 37.9% p; 2.7%
Marin
64.8%
28.5%
6.7%
73.9% 26.1%
11.5% 69.9% -3.9%
Mariposa
35.6% 59.6% 4.7%
38.4%
61.6%
0.8% 39.3% 0.9%
Mendocino
49.2% 36.1%
14.7%
65.1%
34.9%
17.1% 60.5% -4.6%
Modoc
23.5%
73.5%
3.0%
26.0% 74.0%
2.0% 25.8% -0.2%
Mono
41.4%
53.3%
5.3%
50.0% 50.0%
11.9% 45.5% -4.5%
Monterey
58.3% 37.4%
4.3%
60.7% 39.3%
0.4% 61.6% 1.0%
Nevada
37.7%
55.3% 7.0%
45.2%
54.8%
8.1% 43.1% -2.2%
Placer
36.7%
59.5%
3.8%
36.9% 63.1%
-3.4% 39.6% p; 2.7%
Sacramento
49.9% 45.9%
4.1%
50.6%
49.4%
-2.8% 53.1% p; 2.5%
San Diego*
46.6% 49.8%
3.6%
47.3%
52.7%
-2.1% 49.4% p; 2.0%
San Francisco
76.1% 15.8%
8.2%
84.4%
15.6% 8.4%
82.4% -2.0%
San Joaquin*
48.0% 49.5%
2.5%
46.2%
53.8%
-6.2% 49.9% p; 3.8%
San Luis Obispo
41.4% 52.6%
6.0%
46.7%
53.3%
4.6% 46.0% -0.7%
San Mateo
65.0% 31.0%
4.0%
70.3%
29.7%
6.6% 68.1% -2.2%
Santa Barbara
47.6% 46.8%
5.6%
55.6%
44.4% 10.3%
51.9% -3.7%
Santa Cruz
62.5% 27.3%
10.2%
74.6%
25.4%
13.9% 70.4% -4.2%
Siskiyou
32.6% 62.9%
4.5%
38.6%
61.4%
7.6% 36.0% -2.6%
Solano
57.7%
39.4%
3.0%
58.4% 41.6%
-1.6% 60.0% p; 1.6%
Sonoma
60.1%
32.6%
7.3%
68.3% 31.7%
9.2% 65.7% -2.6%
Stanislaus*
45.3% 52.1%
2.6%
41.2%
58.8%
-10.8% 47.3% &nbssp; 6.1%
Sutter
32.0%
65.7%
2.2%
32.3% 67.7%
-1.7% 33.7% p; 1.5%
Trinity
34.1% 58.9%
7.0%
44.1%
55.9%
13.0% 39.4% -4.6%
Tulare*
37.2% 60.7%
2.1%
33.1% 66.9%
-10.3% 38.8% &nbssp; 5.7%
Tuolumne
39.7% 56.3%
3.9%
39.1% 60.9%
-5.3% 42.8% p; 3.7%
PUNCH
CARDS
Alpine
45.6%
49.9% 4.5%
54.5%
45.5%
13.4% 49.1% -5.5%
Calaveras
38.5% 56.9%
4.6%
38.3%
61.7%
-4.9% 42.0% p; 3.7%
Del Norte
38.5% 55.6%
5.9%
42.2%
57.8%
1.4% 43.1% 0.9%
El Dorado
37.0% 58.8%
4.1%
38.4%
61.6%
-1.5% 40.2% p; 1.9%
Glenn
29.2%
67.7%
3.1%
32.2% 67.8%
2.9% 31.6% -0.6%
Imperial
55.0% 42.9%
2.1%
54.5%
45.5%
-3.1% 56.6% p; 2.1%
Inyo
34.3%
61.4%
4.3%
39.9% 60.1%
6.7% 37.7% -2.2%
San Benito
54.6% 42.3%
3.1%
54.1%
45.9%
-4.1% 57.0% p; 2.9%
Sierra
30.1%
65.2%
4.8%
31.1% 68.9%
-2.6% 33.7% p; 2.6%
Ventura
48.3% 48.0%
3.7%
48.7% 51.3%
-2.9% 51.1% p; 2.4%
Yolo
55.4%
37.9% 6.7%
60.8%
39.2%
4.2% 60.5% -0.3%
Yuba*
35.1%
61.8%
3.1%
31.9% 68.1%
-9.5% 37.5% p; 5.6%
__________________________________________________________________________________________________
Oregon votes exclusively by mail-in ballots, so if there is any state where the recorded vote matched the true vote, it was Oregon. Does it offer any clues to explain the last five elections? It sure does: the average Democratic recorded share was 2.6% higher in Oregon than it was nationally.
The
discrepancies between Oregon's 2-party recorded vote share and the national
vote are highly circumstantial evidence and confirm the other overwhelming
evidence of BushCo fraud. Oregon is 100% paper; we can assume the vote
counts are accurate. In fact, exit pollsters Edison-Mitofsky in their Jan. 2005
report showed that Within Precinct Error was much lower in paper ballot
precincts than in others.
Of course they can steal paper ballots. But paper is still a much better choice
than DREs, central tabulators, optical scanners, punch cards and levers. More
confirmation: Kerry won 51.6% of the recorded vote. He had 51.3% in the exit
poll. The exit poll was right on the money. Average Democratic 2-party
vote (1988-2004): Oregon 53.2%; National 50.6%
Consider these facts:
Oregon's 2-party vote exactly matched the national vote in 1996 and 2000.
In 1988, Bush I did 6.3% better nationally than he did in Oregon. Dukakis won OR with 52.38% of the 2-party vote.
In 1992, Bush I did 3.2% better nationally than he did in Oregon. Clinton won OR with 56.6%.
In 1996, Dole did a miniscule 0.03% better nationally than he did in Oregon. Clinton won OR with 54.66%.
In 2000, Bush II did a miniscule 0.03% better nationally than he did in Oregon. Gore won OR with 50.27%. However, if we adjust the Gore share by assuming he would have won 75% of the Nader vote, then his vote shares become 51.5% in Oregon and 51.0% nationally.
In 2004, Bush did 3.4% better nationally than he did in Oregon. Kerry won OR with 52.1%. It's a virtual exact match to the unadjusted state and national exit polls.
According to Exit pollsters Edison-Mitofsky, the weighted average WPE-adjusted state poll was Kerry 51.8- Bush 47.2. Converting to the equivalent 2-party share, Kerry won by 52.3-47.7% nationally, a mere 0.2% deviation from OR.
In 2000, Gore won OR by 6k votes (47.1%); Nader had 77k (5.1%) .
In 2004, Kerry won by 76k (52.1%); Nader was not on the ballot.
Kerry won 59.3% of the 376k net increase in Kerry and Bush voters.
1988-2004 Oregon vs. National vote shares:
2-party share
Oregon Share National Oregon National Diff
1988 (000)
Dukakis 616k
51.5% 45.6% 52.38% 46.10% 6.28%
Bush
560 46.8 53.4
47.62 53.90
1992
Clinton 621
42.6 43.3 56.63
53.46 3.17
Bush
476 32.6 37.7
43.37 46.54
Perot
354 24.3
19.0
1996
Clinton 650
47.2 49.9 54.69
54.66 0.03
Dole
538 39.1 41.4
45.31 45.34
Perot
121 8.8%
8.6
2000
Gore
720 47.1 48.70 50.24
50.27 -0.03
Bush
713 46.6 48.18
49.76 49.73
Nader
77 5.1
3.13
2004
Kerry
943 51.6 48.27
52.11 48.76 3.35
Bush
867 47.4 50.73
47.89 51.24
Dem Average
53.21% 50.65% 2.56%
The Submerging Democratic
Majority
The Democrats actually won all FIVE elections by an average 8.9 MILLION vote margin. That’s the True Emerging Democratic Majority.Don't believe it? Run the numbers yourself.
This analysis is based on the 1988-2004 Election Calculator model. The model first estimates the number of returning voters by adjusting prior election recorded vote totals for uncounted votes and mortality. An estimated turnout percentage is applied to this value. As preliminary NEP vote shares were not available for 1988-2000, Final National Exit Poll shares (which were matched to the recorded vote) were assumed for the base case. In 2004, however, preliminary 12:22am vote shares were available, so these were used instead.
The model used Census-reported total votes cast as the base case assumption. The pool of potential returning voters was assumed to include all who cast votes, rather than just those whose votes were recorded. Uncounted vote rates based on the Census are much higher than the assumed 3.0% rate in prior models. Another assumption change is the mortality rate. Annual voter mortality, estimated as 1.22-1.30%, is more accurate than prior models which assumed the total US 0.87% mortality rate.
The new base case assumptions had the effect of increasing Democratic vote shares compared to prior models. For example, the ElectionCalculator indicates that Kerry won by 53.5- 45.5%, a 10 million vote margin. The prior True Vote Model had Kerry winning by 52.6-46.4%.
Following are the key results based on the average 1988-2004 vote shares:
- The Dem share was 3.8% higher than the recorded share.
- The GOP share was 3.3% lower than the recorded share.
- The Dem share was 1.3% higher than the unadjusted Exit Poll.
- The GOP share was 0.2% higher than the unadjusted Exit Poll.
Voter turnout of prior election Dem, GOP and Other voters is calculated as:
Turnout = prior election (recorded vote + uncounted votes - voter deaths)* voter turnout percentage
The True vote for the Dem, GOP and Other candidate is calculated as:
True Vote = shares of returning (Dem + GOP + Other + New voters)
1988-2004 Election
Calculator Model
Summary Statistics
Calculated
TRUE
Vote
Exit
Poll
Recorded
Calculated
Dem
Rep
Dem
Rep
Dem
Rep
Margin
Average 50.9%
42.9%
49.7%
42.7%
47.1%
46.2% 9.07
2004
53.5%
45.5%
51.8%
47.2%
48.3% 50.7%
10.00
2000
51.1%
46.0%
48.5%
46.2%
48.4% 47.9%
5.66
1996
52.0%
39.3%
52.2%
37.5%
49.9% 41.4%
13.36
1992
47.9%
35.0%
46.0%
33.1%
43.3% 37.7%
14.71
1988
50.2%
48.7%
49.8%
49.3%
45.6% 53.4%
1.61
1988-2004
Average
Total
Dem Rep
Other
Margin Dem
Rep Other Margin
Calculated
111.5 56.87 47.80
6.86
9.07
50.9% 42.9% 6.2%
8.1%
Recorded 102.9 48.47
47.66 6.74
0.81
47.1% 46.2% 6.7%
0.9%
Exit
poll 102.9
51.09 44.03 7.93
7.06
49.5% 42.9% 7.9%
7.0%
Discrepancies
Calc -
Rec 8.7
8.40 0.14
0.12
8.26
3.8% -3.3% -0.5%
7.2%
Calc -
Exit
5.77 3.77
-1.07
2.01
1.3% 0.2%
-1.7% 1.1%
Exit - Rec
2.62 -3.63
1.19
6.25
2.5% -3.5%
1.2% 6.1%
2004
Vote Kerry
Bush Other
Margin
Kerry Bush Other
Margin
Calculated
125.74 67.2 57.2
1.3
10.0
53.5% 45.5% 1.0%
8.0%
Recorded
122.30 59.0
62.0 1.2
-3.0 ;
48.3% 50.7% 1.0%
-2.5%
Exit
poll 122.30
63.4 57.7
1.2
5.7
51.8% 47.2% 1.0%
4.6%
Discrepancies
Calc -
Rec 3.44
8.2 -4.8
0.1
13.0
5.2% -5.2%
0.0% 10.4%
Calc -
Exit
3.9 -0.5
0.1
4.4
1.7% -1.7%
0.0% 3.4%
Exit -
Rec
4.3 -4.3
0.0
8.6
3.5% -3.5%
0.0% 7.0%
2000
Vote
Gore Bush
Other Margin
Gore Bush
Other Margin
Calculated
110.80 56.6 50.9
3.3
5.7
51.1% 46.0% 3.0%
5.1%
Recorded
105.42 51.0
50.5 4.0
0.5
48.4% 47.9% 3.8%
0.5%
Exit
poll 105.42
51.1 48.7
5.6
2.4
48.5% 46.2% 5.3%
2.3%
Discrepancies
Calc -
Rec 5.38
5.6 0.5
-0.7
5.1
2.7% -1.9% -0.8%
4.6%
Calc -
Exit
5.5 2.2
-2.3
3.2
2.6% -0.2% -2.3%
2.8%
Exit -
Rec
0.1 -1.8 1.6
1.9
0.1% -1.7%
1.5% 1.8%
1996
Vote
Clinton Dole Perot
Margin
Clinton Dole Perot Margin
Calculated
105.00 54.6 41.2
9.2
13.4
52.0% 39.3% 8.7%
12.7%
Recorded
91.28 45.6
37.8 7.9
7.8
49.9% 41.4% 8.6%
8.5%
Exit
poll 91.28
47.6 34.2
10.3
13.4
52.2% 37.5% 11.3% 14.7%
Discrepancies
Calc -
Rec 13.72
9.0 3.4
1.3
5.6
2.05% -2.16% 0.11% 4.21%
Calc -
Exit
6.9 7.0
-1.1
-0.1 ;
-0.21% 1.77% &nbssp; -2.57% -1.98%
Exit -
Rec
2.1 -3.6
2.4
5.6
2.25% -3.93% 2.68% 6.19%
1992
Vote Clinton Bush
Perot
Margin
Clinton Bush Perot Margin
Calculated
113.90 54.6 39.9
19.4
14.7
47.9% 35.0% 17.0% 12.9%
Recorded
103.75 44.9
39.1 19.7
5.8
43.3% 37.7% 19.0% 5.6%
Exit
poll 103.75
47.7 34.3
21.7
13.4
46.0% 33.1% 20.9% 12.9%
Discrepancies
Calc -
Rec 10.15
9.7 0.8
-0.3
8.9
4.6% -2.7% -2.0%
7.3%
Calc -
Exit
6.9 5.5
-2.3
1.3
1.9% 1.9%
-3.9% 0.0%
Exit -
Rec
2.8 -4.8
1.9
7.6
2.7% -4.6%
1.9% 7.3%
1988
Vote
Dukakis Bush Other Margin
Dukakis Bush Other Margin
Calculated
102.20 51.3 49.7
1.1
1.6
50.2% 48.7% 1.1%
1.6%
Recorded
91.60
41.8 48.9
0.9
-7.1 ;
45.6% 53.4% 1.0%
-7.7%
Exit
poll
91.60 45.6
45.2 0.8
0.5
49.8% 49.3% 0.9%
0.5%
Discrepancies
Calc -
Rec
10.60 9.5
0.8 0.2 8.7
4.6% -4.7%
0.1% 9.3%
Calc -
Exit
5.7 4.6
0.3
1.2
0.4% -0.6%
0.2% 1.1%
Exit -
Rec
3.8 -3.7
-0.1
7.5
4.2% -4.1% -0.1%
8.2%
True Vote Calculation
(Census total votes cast)
2004
Voted2k Weight Kerry Bush
Other
Kerry Bush Other
DNV
24.6 19.5% 14.00
10.07
0.49
57.0% 41.0% 2.0%
Gore
50.2 39.9% 45.70
4.02
0.50
91.0% 8.0%
1.0%
Bush
47.0 37.4%
4.23 42.78
0.00
9.0% 91.0%
0.0%
Nader
3.9 3.1%
2.76 0.87
0.32
70.0% 22.0% 8.0%
Total
125.7 100.0% 66.69
57.74
1.31
53.0% 45.9% 1.0%
2000
Voted96 Weight
Gore
Bush
Other Gore
Bush Other
DNV
15.0 13.5%
7.80 6.45
0.75
52.0% 43.0% 5.0%
Clinton
51.1 46.2% 41.94
7.67
1.53
82.0% 15.0% 3.0%
Dole
36.8 33.3%
2.95 33.53
0.37
8.0% 91.0%
1.0%
Perot
7.8 7.0%
3.90 3.28
0.62
50.0% 42.0% 8.0%
Total
110.8 100.0% 56.59
50.93 3.28
51.1% 46.0% 3.0%
1996
Voted92 Weight Clinton Dole
Perot
Clinton Dole Perot
DNV
5.5 5.2%
2.97 1.87
0.66
54.0% 34.0% 12.0%
Clinton
45.7 43.5% 38.83
4.11 2.74
85.0% 9.0% 6.0%
Dole
35.7 34.0%
4.64 28.91
2.14
13.0% 81.0% 6.0%
Perot
18.1 17.3%
8.16 6.35
3.63
45.0% 35.0% 20.0%
Total
105.0 100.0% 54.59
41.24
9.17
52.0% 39.3% 8.7%
1992
Voted88 Weight Clinton Bush
Perot
Clinton Bush Perot
DNV
20.8 18.3%
9.57 6.66
4.58
46.0% 32.0% 22.0%
Dukakis
45.3 39.7% 37.56
2.26
5.43
83.0% 5.0% 12.0%
Bush
47.0 41.3%
7.05 30.56
9.40
15.0% 65.0% 20.0%
Other
0.8 0.7%
0.41 0.41
0.00
50.0% 50.0% 0.0%
Total
113.9 100.0% 54.60
39.89
19.41
47.9% 35.0% 17.0%
1988
Voted84 Weight
Dukakis
Bush
Other
Dukakis Bush Other
DNV
11.4 11.1%
5.36 5.81
0.23
47.0% 51.0% 2.0%
Mondale
39.4 38.5% 36.21
2.76
0.39
92.0% 7.0% 1.0%
Reagan
51.4 50.3%
9.78 41.16
0.51
19.0% 80.0% 1.0%
Total
102.2 100.0% 51.34
49.72
1.14
50.2% 48.7% 1.1%
_______________________________________________________________________________________________
Historical Models II-III
The Democrats lose the majority of uncounted votes in every election. This analysis determines the effect of uncounted and switched votes for presidential elections since 1948 – as well as the 2006 midterms. Landslide elections are not included: Eisenhower (1952-56); Johnson (1964); Nixon (1972) and Reagan (1984).
In Model II, the True vote was calculated based as the sum of recorded, uncounted and switched votes. A 3% uncounted vote rate was assumed. The 1988-2006 “pristine” National Exit polls closely matched the True vote. Final Exit polls were forced to match the recorded vote. In each election, the pristine exit poll overstated the recorded Democratic vote, since uncounted votes are heavily Democratic. Vote-switching appears to have been a major component of the exit poll discrepancy in 1988, 1992, 2000 and 2004. Sensitivity analysis tables display the effects of changes in the Democratic share of uncounted votes and the switched vote rate on the national vote.
In Model III, National Exit Poll weightings were adjusted for prior
election voter mortality, turnout and uncounted votes. The weights were used as
multipliers of the Final NEP vote shares. Preliminary NEP component vote shares
are not available (except for 2004), but the national vote shares are known.
The assumed mortality rate was assumed to be 3% over the four-year period between elections (the annual mortality rate was 0.87% in 2000). Turnout of 2000 voters was assumed to be 87-95%. Uncounted votes were assumed to be 3% of total votes cast with a 70-75% Democratic share.
The calculation of Total Votes Cast is based on the following equation:
Votes Cast = (Votes cast in prior election – Mortality)* Turnout + New voters (DNV in prior election)
In 2006, the Democrats led the Republicans by 55-43.5% at the 7pm timeline of the National Exit Poll. But the lead was cut in half to 52-46%in the 2pm Final which was matched to the recorded vote count. Assuming 6% of Democratic votes were switched to the Republicans, the Democrats won the adjusted vote by 56.7–41.1%, a 1.7% discrepancy from the exit poll.
In 2004, Kerry led Bush by 51.4–47.9% in the 12:22am NEP. But the 2pm Final NEP was matched to the recorded vote (Bush 51-Kerry 48).The True Vote (Kerry 66.1- Bush 58.4m) was calculated by replacing the impossible “Voted 2000” weights with feasible weights, and using the12:22am NEP vote shares as the most-likely base case scenario. According to the 2004 Election Census, 3.4 of the 125.74m votes cast went uncounted. Assuming that 2.6m (75%) were Kerry votes, then 4.5 of the 66.1m votes cast (6.8%) for Kerry must have been switched.
The switched votes were calculated by the equation:
True Vote = Recorded +Uncounted + Switched = 66.1 = 59.0 + 2.6 + 4.5
In 2000, Gore led Bush by 48.5-46.2% in the final “pristine” exit poll. Assuming zero vote-switching, Gore won the adjusted vote by 49.5 - 47.5%,a 1.0% discrepancy from the exit poll.
In 1996, Clinton led Dole and Perot by 52.2- 37.5- 10.3% in the exit poll. Assuming zero vote-switching, Clinton won the adjusted vote by 50.7- 40.9- 8.4%, a 1.5% exit poll discrepancy.
In 1992, Clinton led Bush I and Perot by 46.0-33.2-20.8% in the exit poll. Assuming that 4% of Clinton’s votes were switched, he won the adjusted vote by 45.8- 35.4- 18.8%, a 0.2% exit poll discrepancy.
The 1988 Bush I-Dukakis election is especially suspicious. Dukakis led by 50.3-49.7% in the exit poll. As usual, weights and/or vote shares were adjusted in the Final NEP to force a match to the recorded vote. Assuming that 6% of Dukakis’ votes were switched to Bush, Dukakis tied Bush in the adjusted vote
49.5- 49.5%, a 0.8% exit poll discrepancy.
In 1968 Nixon won by just 500,000 votes, but uncounted votes may have cost Humphrey the election. Assuming zero vote-switching, Humphrey won by 600,000 votes.
For Carter in 1976, JFK in 1960 and Truman in 1948, the switched vote rate was assumed to be zero. Margins were about 1.5% higher than the recorded votes indicate.
Historical Model II
(1948-2006)
Assumption: 3% uncounted votes
For the 1988-2004 elections, there was a .06% average deviation between the calculated Democratic vote share (after adjusting the recorded vote for uncounted and switched votes) and the “pristine” National Exit Poll – before the Final NEP was forced to match the recorded vote.
Recorded vote
Calculated
vote Assumptions
National Exit Poll
Year
Dem Rep
Other Dem
Rep Other Unctd Switched
Dem Rep Diff
2006
52.7% 45.1% 2.2%
56.7% 41.1% 2.2%
3.0% 6.0% 55.0%
43.5% 1.7%
2004
48.3% 50.7% 1.0%
52.6% 46.4% 1.0%
2.7% 6.8%
51.4% 47.9% 1.2%
2000
48.7% 48.2% 3.1%
49.5% 47.5% 3.1%
3.0% 0.0% 48.5%
46.2% 1.0%
1996
50.0% 41.4% 8.6%
50.7% 40.8% 8.5%
3.0% 0.0%
52.2% 37.5% -1.5%
1992
43.3% 37.7% 19.0%
45.8% 35.4% 18.8%
3.0% 4.0%
46.0% 33.2% -0.2%
1988
45.6% 53.4% 1.0%
49.5% 49.5% 1.0%
3.0% 6.0% 50.3%
49.7% -0.8%
1980 41.7%
51.6% 6.7% 42.5%
50.6% 6.8%
3.0%
0.0%
1976
51.1% 48.9% 0.0%
51.8% 48.2% 0.0%
3.0% 0.0%
1968
42.9% 43.6% 13.6%
43.7% 42.9% 13.5%
3.0%
0.0%
1960
50.1% 49.9% 0.0%
50.8% 49.2% 0.0%
3.0% 0.0%
1948
49.9% 45.3% 4.8%
50.6% 44.6% 4.8%
3.0% 0.0%
Avg
47.14% 47.08% 5.78%
48.75% 45.51% 5.75%
2006
Uncounted
3.00%
2.37
Switched
6.00%
Uncounted share
Total
Cast
78.95
75% 24% 1%
Dem
Rep Other
Total
Dem Rep Other
Recorded
40.32
34.57 1.69
76.58
52.65% 45.14% 2.21%
Uncounted
1.78 0.57
0.02
2.37
2.25% 0.72% 0.03%
Pre-Switch
42.10 35.14 1.71
78.95
53.3% 44.5% 2.2%
Switched
2.69 -2.69
0.00
0.00
3.4% -3.4% 0.0%
Calculated
44.78 32.45 1.71
78.95
56.7% 41.1% 2.2%
Exit
Poll 43.42
34.34 1.19
78.95
55.0% 43.5% 1.5%
Diff
1.36
-1.89 0.52 ;
0.00
1.7% -2.4% 0.7%
Unctd
Switched
56.72%
0.0% 1.0%
2.0% 3.0%
4.0% 5.0%
6.0% 7.0%
0%
52.7% 53.2% 53.7%
54.3% 54.8% 55.4%
56.0% 56.6%
1%
52.9% 53.4% 54.0%
54.5% 55.1% 55.7%
56.2% 56.9%
2%
53.1% 53.6% 54.2%
54.7% 55.3% 55.9%
56.5% 57.1%
3%
53.3% 53.9% 54.4%
55.0% 55.5% 56.1% 56.7%
57.3%
4%
53.5% 54.1% 54.6%
55.2% 55.8% 56.4%
57.0% 57.6%
5%
53.8% 54.3% 54.9%
55.4% 56.0% 56.6%
57.2% 57.8%
2004
Uncounted
2.74%
3.45
Switched
6.79%
Uncounted share
Total
Cast
125.74
75% 24% 1%
Kerry
Bush Other
Total
Kerry Bush Other
Recorded
59.03
62.04 1.23
122.30
48.27% 50.73% 1.00%
Uncounted
2.58 0.83
0.03
3.45
2.06% 0.66% 0.03%
Pre-Switch
61.61 62.87 1.26
125.74
49.0% 50.0% 1.0%
Switched
4.49 -4.49
0.00
0.00
3.3% -3.3% 0.0%
Calculated
66.10 58.38 1.26
125.74
52.6% 46.4% 1.0%
Exit
Poll 64.64
59.84 1.26
125.74
51.4% 47.6% 1.0%
Diff
1.46
-1.46 0.00 ;
0.00
1.16% -1.16% 0.00%
Unctd
Switched
52.57%
0.0% 1.0%
2.0% 3.0%
4.0% 5.0%
6.0% 6.8%
0%
48.3% 48.8% 49.3%
49.8% 50.3% 50.8%
51.3% 51.8%
1%
48.5% 49.0% 49.5%
50.0% 50.6% 51.1%
51.6% 52.1%
2%
48.8% 49.3% 49.8%
50.3% 50.8% 51.4%
51.9% 52.4%
3%
49.1% 49.6% 50.1%
50.6% 51.1% 51.7%
52.2% 52.6%
4%
49.3% 49.8% 50.3%
50.9% 51.4% 51.9%
52.5% 52.9%
5%
49.6% 50.1% 50.6%
51.1% 51.7% 52.2%
52.8% 53.2%
2000
Uncounted
3.00%
3.24
Switched
0.00%
Uncounted share
Total
Cast
107.98
75% 24% 1%
Gore
Bush Other
Total Gore
Bush Other
Recorded
51.00
50.46 3.28
104.74 48.70%
48.18% 3.13%
Uncounted
2.43 0.78
0.03
3.24
2.25% 0.72% 0.03%
Pre-Switch
53.43 51.24 3.31
107.98
49.5% 47.5% 3.1%
Switched
0.00 0.00
0.00
0.00
0.0% 0.0% 0.0%
Calculated
53.43 51.24 3.31
107.98
49.5% 47.5% 3.1%
Exit
Poll 52.37
49.89 5.72
107.98
48.5% 46.2% 5.3%
Diff
1.06
1.35 -2.42
0.00
0.99% 1.25% -2.24%
Unctd
Switched
49.49%
0.0% 1.0%
2.0% 3.0%
4.0% 5.0%
6.0% 7.0%
0%
48.7% 49.2% 49.7%
50.2% 50.7% 51.3%
51.8% 52.4%
1%
49.0% 49.5% 50.0%
50.5% 51.0% 51.5%
52.1% 52.6%
2%
49.2% 49.7% 50.2%
50.7% 51.3% 51.8%
52.4% 52.9%
3% 49.5%
50.0% 50.5% 51.0%
51.5% 52.1% 52.6% 53.2%
4%
49.7% 50.3% 50.8%
51.3% 51.8% 52.4%
52.9% 53.5%
5%
50.0% 50.5% 51.0%
51.6% 52.1% 52.6%
53.2% 53.8%
1996
Uncounted
3.00%
2.82
Switched
0.00%
Uncounted share
Total
Cast
94.10
75% 20% 5%
Clinton
Dole Perot
Total
Clinton Dole Perot
Recorded
45.59
37.82 7.87
91.27
49.95% 41.43% 8.62%
Uncounted
2.12 0.56
0.14
2.82
2.25% 0.60% 0.15%
Pre-Switch
47.71 38.38 8.01
94.10
50.7% 40.8% 8.5%
Switched
0.00
0.00 0.00
0.00
0.0% 0.0% 0.0%
Calculated
47.71 38.38 8.01
94.10
50.7% 40.8% 8.5%
Exit
Poll 49.12
35.29 9.69
94.10
52.2% 37.5% 10.3%
Diff
-1.41
3.09 -1.68
0.00
-1.50% 3.29% &nbssp; -1.79%
Unctd
Switched
50.70%
0.0% 1.0%
2.0% 3.0%
4.0% 5.0%
6.0% 7.0%
0%
50.0% 50.5% 51.0%
51.5% 52.0% 52.6%
53.1% 53.7%
1%
50.2% 50.7% 51.2%
51.8% 52.3% 52.8%
53.4% 54.0%
2%
50.5% 51.0% 51.5%
52.0% 52.6% 53.1%
53.7% 54.2%
3% 50.7%
51.2% 51.7% 52.3%
52.8% 53.4% 53.9% 54.5%
4%
51.0% 51.5% 52.0%
52.5% 53.1% 53.6%
54.2% 54.8%
5%
51.2% 51.7% 52.2%
52.8% 53.3% 53.9%
54.5% 55.1%
1992
Uncounted
3.00%
3.21
Switched
4.00%
Uncounted share
Total
Cast
106.96
66% 22% 12%
Clinton
Bush Perot
Total
Clinton Bush Perot
Recorded
44.91
39.10 19.74
103.75
43.28% 37.69% 19.03%
Uncounted
2.12 0.71
0.39
3.21
1.98% 0.66% 0.36%
Pre-Switch
47.03 39.81 20.13
106.96
44.0% 37.2% 18.8%
Switched
1.96
-1.96 0.00 ;
0.00
1.8% -1.8% 0.0%
Calculated
48.99 37.85 20.13
106.96
45.8% 35.4% 18.8%
Exit
Poll 49.20
35.40 22.35
106.96
46.0% 33.1% 20.9%
Diff
-0.22
2.44 -2.23
0.00
-0.20% 2.29% &nbssp; -2.08%
Unctd
Switched
45.80%
0.0% 1.0%
2.0% 3.0%
4.0% 5.0%
6.0% 7.0%
0%
43.3% 43.7% 44.2%
44.6% 45.1% 45.6%
46.0% 46.5%
1%
43.5% 44.0% 44.4%
44.9% 45.3% 45.8%
46.3% 46.8%
2%
43.7% 44.2% 44.6%
45.1% 45.6% 46.0%
46.5% 47.0%
3%
44.0% 44.4% 44.9%
45.3% 45.8% 46.3%
46.8% 47.3%
4%
44.2% 44.6% 45.1%
45.6% 46.0% 46.5%
47.0% 47.5%
5%
44.4% 44.9% 45.3%
45.8% 46.3% 46.8%
47.3% 47.8%
1988
Uncounted
3.00%
93.53
Switched
6.00%
Uncounted share
Total
Cast
94.42
75% 24%
1%
Dukakis
Bush Other
Total
Dukakis Bush Other
Recorded
41.81
48.89 0.90
91.59 45.65%
53.37% 0.98%
Uncounted
2.12 0.68
0.03
2.83
2.25% 0.72% 0.03%
Pre-Switch
43.93 49.57 0.92
94.42
46.5% 52.5% 1.0%
Switched
2.80
-2.80 0.00 ;
0.00
2.8% -2.8% 0.0%
Calculated
46.74 46.76 0.92
94.42
49.5% 49.5% 1.0%
Exit
Poll 47.45
46.98 0.92
94.42
50.3% 49.8% 0.0%
Diff
-0.71
-0.21 0.00 ;
0.00
-0.75% -0.23% 0..98%
Unctd
Switched
49.50%
0.0% 1.0%
2.0% 3.0%
4.0% 5.0%
6.0% 7.0%
0%
45.6% 46.1% 46.6%
47.1% 47.5% 48.1%
48.6% 49.1%
1%
45.9% 46.4% 46.9%
47.4% 47.9% 48.4%
48.9% 49.4%
2%
46.2% 46.7% 47.2%
47.7% 48.2% 48.7%
49.2% 49.7%
3%
46.5% 47.0% 47.5% 48.0%
48.5% 49.0% 49.5%
50.0%
4%
46.8% 47.3% 47.8%
48.3% 48.8% 49.3%
49.8% 50.3%
5%
47.1% 47.6% 48.1%
48.6% 49.1% 49.6%
50.1% 50.7%
1980
Uncounted
3.00%
2.63
Switched
0.00%
Uncounted share
Total
Cast
87.74
70% 20% 10%
Carter
Reagan Anderson
Total
Carter Reagan Anderson
Recorded
35.48
43.90 5.72
85.11
41.69% 51.59% 6.72%
Uncounted
1.84 0.53
0.26
2.63
2.10% 0.60% 0.30%
Pre-Switch
37.33 44.43 5.98
87.74
42.5% 50.6% 6.8%
Switched
0.00
0.00 0.00
0.00
0.0% 0.0% 0.0%
Calculated
37.33 44.43 5.98
87.74
42.5% 50.6% 6.8%
Unctd
Switched
42.54%
0.0% 1.0%
2.0% 3.0%
4.0% 5.0%
6.0% 7.0%
0%
41.7% 42.1% 42.5%
43.0% 43.4% 43.9%
44.4% 44.8%
1%
42.0% 42.4% 42.8%
43.3% 43.7% 44.2%
44.7% 45.1%
2%
42.3% 42.7% 43.1%
43.6% 44.0% 44.5%
45.0% 45.4%
3% 42.5%
43.0% 43.4% 43.9%
44.3% 44.8% 45.3% 45.7%
4%
42.8% 43.3% 43.7%
44.2% 44.6% 45.1%
45.6% 46.0%
5%
43.1% 43.5% 44.0%
44.4% 44.9% 45.4%
45.9% 46.4%
1976
Uncounted
3.00%
2.47
Switched
0.00%
Uncounted share
Total
Cast 82.45
75% 25%
Carter
Ford
Total
Carter Ford
Recorded
40.83
39.15
79.98
51.05% 48.95%
Uncounted
1.86 0.62
2.47
2.25% 0.75%
Pre-Switch
42.69 39.77
82.45
51.8% 48.2%
Switched
0.00
0.00
0.00
0.0% 0.0%
Calculated
42.69 39.77
82.45
51.8%
48.2%
Unctd
Switched
51.77%
0.0% 1.0%
2.0% 3.0%
4.0% 5.0%
6.0% 7.0%
0%
51.1% 51.6% 52.1%
52.6% 53.2% 53.7%
54.3% 54.9%
1%
51.3% 51.8% 52.3%
52.9% 53.4% 54.0%
54.6% 55.2%
2%
51.5% 52.1% 52.6%
53.1% 53.7% 54.2%
54.8% 55.4%
3% 51.8%
52.3% 52.8% 53.4%
53.9% 54.5% 55.1% 55.7%
4%
52.0% 52.5% 53.1%
53.6% 54.2% 54.7%
55.3% 55.9%
5%
52.2% 52.8% 53.3%
53.9% 54.4% 55.0%
55.6% 56.2%
1968
Uncounted
3.00%
2.26
Switched
0.00%
Uncounted share
Total
Cast
75.22
70% 20% 10%
Humphrey Nixon
Wallace
Total
Humphrey Nixon Wallace
Recorded
31.28
31.79 9.91
72.97
42.86% 43.56% 13.58%
Uncounted
1.58 0.45
0.23
2.26
2.10% 0.60% 0.30%
Pre-Switch
32.85 32.24 10.13
75.22
43.68% 42.85% 13.47%
Switched
0.00
0.00 0.00
0.00
0.00% 0.00% 0.00%
Calculated
32.85 32.24 10.13
75.22
43.68% 42.85% 13.47%
Unctd
Switched
43.68% 0.0%
1.0% 2.0%
3.0% 4.0%
5.0% 6.0% 7.0%
0%
42.9% 43.3% 43.7%
44.2% 44.6% 45.1%
45.6% 46.1%
1%
43.1% 43.6% 44.0%
44.5% 44.9% 45.4%
45.9% 46.4%
2%
43.4% 43.8% 44.3%
44.7% 45.2% 45.7%
46.2% 46.7%
3% 43.7%
44.1% 44.6% 45.0%
45.5% 46.0% 46.5% 47.0%
4%
43.9% 44.4% 44.8%
45.3% 45.8% 46.3%
46.8% 47.3%
5%
44.2% 44.7% 45.1%
45.6% 46.1% 46.5%
47.0% 47.5%
1960
Uncounted
3.00%
2.11
Switched
0.00%
Uncounted share
Total
Cast
70.45
75% 25%
Kennedy
Nixon
Total
Kennedy Nixon
Recorded
34.23 34.11
68.34
50.09% 49.91%
Uncounted
1.59 0.53
2.11
2.25% 0.75%
Pre-Switch
35.81 34.64 70.45
50.8% 49.2%
Switched
0.00
0.00
0.00
0.0% 0.0%
Calculated
35.81 34.64
70.45
50.8% 49.2%
Unctd
Switched
50.83%
0.0% 1.0%
2.0% 3.0%
4.0% 5.0%
6.0% 7.0%
0%
50.1% 50.6% 51.1%
51.6% 52.2% 52.7%
53.3% 53.9%
1%
50.3% 50.8% 51.4%
51.9% 52.4% 53.0%
53.5% 54.1%
2%
50.6% 51.1% 51.6%
52.1% 52.7% 53.2%
53.8% 54.4%
3% 50.8%
51.3% 51.9% 52.4%
53.0% 53.5% 54.1% 54.7%
4%
51.1% 51.6% 52.1%
52.7% 53.2% 53.8%
54.3% 54.9%
5%
51.3% 51.9% 52.4%
52.9% 53.5% 54.0%
54.6% 55.2%
1948
Uncounted
3.00%
1.50
Switched
0.00%
Uncounted share
Total
Cast
50.00
75% 20% 5%
Truman
Dewey Other
Total
Truman Dewey Other
Recorded
24.18
21.99 2.33
48.50
49.86% 45.35% 4.80%
Uncounted
1.12 0.30
0.07
1.50
2.25% 0.60% 0.15%
Pre-Switch
25.30 22.29 2.40
50.00
50.6% 44.6% 4.8%
Switched
0.00
0.00 0.00
0.00
0.0% 0.0% 0.0%
Calculated
25.30 22.29 2.40
50.00
50.6% 44.6% 4.8%
Unctd
Switched
50.61%
0.0% 1.0%
2.0% 3.0%
4.0% 5.0%
6.0% 7.0%
0%
49.9% 50.6% 51.4%
52.2% 53.0% 53.9%
54.8% 55.7%
1%
50.1% 50.9% 51.7%
52.5% 53.3% 54.2%
55.1% 56.0%
2% 50.4%
51.1% 51.9% 52.7%
53.6% 54.5% 55.4% 56.3%
3% 50.6%
51.4% 52.2% 53.0%
53.9% 54.7% 55.6% 56.6%
4%
50.9% 51.6% 52.4%
53.3% 54.1% 55.0%
55.9% 56.9%
5%
51.1% 51.9% 52.7%
53.5% 54.4% 55.3%
56.2% 57.2%
_______________________________________________________________________________________________
Historical Model III
National Exit Poll Adjusted weights
Assumptions:
3% Uncounted votes, 3% four-year total Mortality, 87-95% prior election voter Turnout
National Exit Poll weights adjusted for prior election mortality, voter turnout and uncounted votes;
Final NEP vote shares (matched to recorded vote count)
Except for: 2004 NEP vote shares at 12:22am timeline
Mortality: 3% over four-year period between elections (U.S. annual mortality rate was 0.87% in 2000);
Turnout: 87-95% of those who voted in the prior election
Uncounted votes: 3% of total votes cast
Democratic share of uncounted votes: 70-75%
Switched votes: not assumed for this analysis
Total Votes Cast = (Votes cast in prior election – Mortality)* Turnout + New voters (DNV in prior election)
Key Results:
Average calculated Democratic margin:
0.25% lower than the NEP average
5.50% higher than the Recorded average
Average Democratic 2-party share:
0.20% lower than the NEP average
3.15% higher than the Recorded average
NEP: National Exit Poll shares prior to Final NEP
Calc: calculated vote shares
Margin deviations:
Diff1: NEP - Recorded
Diff2: Calc- Recorded
Diff3: Calc - NEP
Calculated
NEP
Recorded
Deviations
Dem Rep
Other Dem
Rep Other
Dem Rep Other
Diff1 Diff2 Diff3
2004P
53.0% 46.0% 1.0%
50.8% 48.2% 1.0%
48.3% 50.7% 1.0%
5.0% 9.4% 4.4%
2004F
51.6% 48.0% 0.4% 50.8%
48.2% 1.0% 48.3%
50.7% 1.0%
5.0% 6.0% -1.8%
2000
49.7% 47.3% 3.1%
48.5% 46.2% 5.3%
48.7% 48.2% 3.1%
1.8% 1.9% 0.1%
1996
50.9% 40.7% 8.4%
52.2% 37.5% 10.3% 49.9%
41.4% 8.6%
6.2% 1.7% -4.5%
1992
49.4% 33.4% 17.1%
46.0% 33.1% 20.9%
43.3% 37.7% 19.0% 7.3%
10.4% 3.1%
1988
49.4% 49.6% 1.0%
49.8% 49.3% 1.0%
45.6% 53.4% 1.0% 8.2%
7.5% -0.7%
Avg
50.20% 43.80% 6.14%
49.45% 42.85% 7.70%
47.14% 46.31% 6.55%
5.70% 5.50% -0.25%
Democratic 2-party vote share:
Calculated, NEP, Recorded
DiffN: Calc - NEP
DiffR: Calc –
Recorded
Calc NEP Recorded DiffN
DiffR
2004P
53.51% 51.29% 48.76% 2.22%
4.76%
2004F
51.80% 51.29% 48.76%
0.49% 3.03%
2000
51.24% 51.21% 50.27%
0.03%
0.98%
1996
55.55% 58.19% 54.66% -2.65%
0.89%
1992
59.65% 58.15% 53.46%
1.49%
6.19%
1988
49.90% 50.25% 46.10% -0.35%
3.80%
Avg
53.63% 53.82% 50.47% -0.20%
3.15%
_______________________________________________________________________________
2004-
12:22am NEP Vote shares
Unctd Kerry Bush
Other
2.74% 75%
24%
1%
2.95 3.0%
Max.
95%
12:22am NEP vote shares
2000
Rec. Cast
Mort. Turn. Turn.
Mix Kerry
Bush Other
DNV
- --
- -
26.51 21.1% 57%
41% 2%
Gore
51.00 53.21 1.60
51.62 49.04 39.0%
91% 8% 1%
Bush
50.46 51.17 1.54
49.63 47.15 37.5%
10% 90% 0%
Nader
3.28 3.31
0.10 3.21
3.05 2.4%
71% 21% 8%
Total
104.74 107.69 3.23
104.46 125.75 Calc
53.0% 46.0% 1.0%
Votes 66.61 57.87 1.26
NEP
50.78% 48.22% 1.0%
Kerry share of
DNV
Recorded 48.27% 50.73% 1.0%
Gore
55.0% 56.0% 57.0%
58.0%
Votes 59.03
62.40 1.23
89.0%
51.8% 52.0% 52.2%
52.4%
90.0%
52.2% 52.4% 52.6%
52.8%
91.0%
52.6% 52.8% 53.0%
53.2%
92.0%
52.9% 53.2% 53.4%
53.6%
93.0%
53.3% 53.5% 53.8%
54.0%
_______________________________________________________________________________
2004-
2pm Final NEP Vote Shares
Unctd Kerry
Bush
Other
122.3
2.74% 75%
24%
1%
2.95
3.0% Max.
95%
2pm Final NEP vote shares
2000
Rec. Cast
Mort. Turn. Turn.
Mix Kerry
Bush Other
DNV
- &nnbsp; -
- -
26.51 21.1%
54% 45% 1%
Gore
51.00 53.21
1.60 51.62 49.04
39.0% 90%
10% 0%
Bush
50.46 51.17
1.54 49.63 47.15
37.5% 9%
91% 0%
Nader
3.28 3.31
0.10 3.21
3.05 2.4%
71% 21% 8%
Total
104.74 107.69 3.23
104.46 125.75 Calc 51.58%
48.02% 0.40%
Votes 64.86 60.38 0.51
NEP
50.78% 48.22% 1.00%
Recorded 48.27%
50.73% 1.01%
Votes 59.03
62.04 1.23
Kerry Share
of DNV
Gore
54.0% 55.0% 56.0%
57.0%
89.0%
51.2% 51.4% 51.6%
51.8%
90.0%
51.6% 51.8% 52.0%
52.2%
91.0%
52.0% 52.2% 52.4%
52.6%
92.0%
52.4% 52.6% 52.8%
53.0%
93.0%
52.7% 53.0% 53.2% 53.4%
_______________________________________________________________________________
2000 Unctd
Gore Bush
Nader
3.0% 75%
20%
5%
2.82
3.0% Max.
95%
Final NEP vote shares
1996
Rec. Cast
Mort. Turn. Turn.
Mix Gore
Bush Nader
DNV
- --
- -
21.27 19.7% 52%
43% 5%
Clinton 45.59
47.71 1.43 46.28
43.96 40.7%
82% 15% 3%
Dole
37.82 38.38 1.15
37.23 35.37 32.8%
8% 91% 1%
Perot 7.87
8.01 0.24
7.77 7.38
6.8% 50%
42% 8%
Total
91.27 94.10 2.82
91.27 107.98 Calc
49.7% 47.3% 3.1%
Votes 53.63 51.02
3.33
NEP
48.5%
46.2% 5.3%
Gore share of
DNV
Recorded 48.7%
48.2% 3.1%
Clinton 50.0%
51.0% 52.0% 53.0%
Votes
51.00 50.46
3.28
80.0%
48.5% 48.7% 48.9%
49.0%
81.0%
48.9% 49.1% 49.3%
49.5%
82.0%
49.3% 49.5% 49.7%
49.9%
83.0%
49.7% 49.9% 50.1%
50.3%
84.0%
50.1% 50.3% 50.5%
50.7%
_______________________________________________________________________________
1996
Unctd Clinton Dole
Perot
3.0%
70% 20%
10%
3.21 3.0%
Max. 87%
Final NEP vote
shares
1992
Rec. Cast
Mort. Turn. Turn.
Mix Clinton Dole
Perot
DNV
- --
- -
3.83 4.1% 54%
34% 12%
Clinton 44.91
47.16 1.41 45.74
39.80 42.3%
85% 9% 6%
Bush
39.10 39.74 1.19
38.55 33.54 35.6%
13% 82% 5%
Perot 19.74
20.06 0.60
19.46 16.93 18.0%
45% 35% 20%
Total
103.75 106.96 3.21 103.75
94.10 Calc 50.9%
40.7% 8.4%
Votes 47.87 38.31 7.91
NEP 52.2% 37.5%
10.3%
Clinton share of
DNV
Recorded
49.9% 41.4% 8.6%
Clinton 52.0%
53.0% 54.0%
55.0%
Votes 45.59 37.82
7.87
83.0%
50.0% 50.0% 50.0%
50.1%
84.0%
50.4% 50.4% 50.5% 50.5%
85.0%
50.8% 50.8% 50.9%
50.9%
86.0%
51.2% 51.3% 51.3%
51.3%
87.0%
51.6% 51.7% 51.7%
51.8%
_______________________________________________________________________________
1992
Unctd Clinton Bush
Perot
3.0% 75%
15%
10%
2.83 3.0%
Max.
95%
Final NEP vote shares
1988
Rec. Cast
Mort. Turn. Turn.
Mix Clinton Bush
Perot
DNV
- --
- -
19.94 18.6% 46%
32% 22%
Dukakis 41.81
43.93 1.32 42.62
40.49 37.9%
83% 5% 12%
Bush
48.89 49.31 1.48
47.84 45.44 42.5%
21% 59% 20%
Other 0.90
1.18 0.04
1.15 1.09
1.0% 50%
50% 0%
Total
91.60 94.43 2.83
91.60 106.96 Calc
49.4% 33.4% 17.1%
Votes 52.86 35.76
18.33
NEP 46.0% 33.1%
20.9%
Clinton share of
DNV
Recorded
43.3% 37.7% 19.0%
Dukakis 44.0%
45.0% 46.0%
47.0%
Votes 44.91 39.10
19.74
81.0%
48.3% 48.5% 48.7%
48.9%
82.0%
48.7% 48.9% 49.0%
49.2%
83.0%
49.1% 49.2% 49.4%
49.6%
84.0%
49.4% 49.6% 49.8%
50.0%
85.0%
49.8% 50.0% 50.2%
50.4%
_______________________________________________________________________________
1988
Unctd Dukakis Bush
Other
3.0% 75%
25%
0%
2.85 3.0% Max.
95%
Final NEP vote
shares
1984
Rec. Cast
Mort. Turn. Turn.
Mix Dukakis Bush
Other
DNV
- --
- -
6.99 7.4% 47%
51% 2%
Mondale 37.58
39.71 1.19 38.52
36.60 38.8%
92% 7% 1%
Reagan
54.46 55.17 1.66
53.52 50.84 53.8%
19% 80% 1%
Total
92.04 94.89 2.85
92.04 94.43 Calc
49.4% 49.6% 1.1%
Votes 46.62
46.80 1.01
NEP
49.8% 49.3% 1.0%
Dukakis share
of
DNV
Recorded 45.6% 53.4% 1.0%
Mondale 45.0%
46.0% 47.0%
48.0%
Votes 41.81 48.89 0.90
90.0%
48.4% 48.5% 48.6%
48.7%
91.0%
48.8% 48.9% 49.0%
49.1%
92.0%
49.2% 49.3% 49.4%
49.4%
93.0%
49.6% 49.7% 49.8%
49.8%
94.0%
50.0% 50.1% 50.1%
50.2%
_______________________________________________________________________________
1980
Unctd Carter Reagan
Andersen
3.0% 75%
20%
5%
2.47 3.0%
Max.
95%
Final NEP vote shares
1976
Rec. Cast
Mort. Turn. Turn.
Mix Carter Reagan
Andersen
DNV
- --
- -
11.55 13.2% 46%
45% 9%
Carter
40.83 42.96 1.29
41.68 39.59 45.1%
80% 13% 7%
Ford
39.15 39.72 1.19
38.53 36.60 41.7%
6% 88% 6%
Total
79.98 82.45 2.48
80.20 87.74 Calc
44.7% 48.5% 6.8%
Votes 39.18
42.55 6.01
Carter share of
DNV
Recorded 41.7%
51.6% 6.7%
Carter
44.0% 45.0% 46.0%
47.0%
Votes 35.48 43.90 5.72
78.0%
43.5% 43.6% 43.8%
43.9%
79.0%
43.9% 44.1% 44.2%
44.3%
80.0%
44.4% 44.5% 44.7%
44.8%
81.0%
44.8% 45.0% 45.1%
45.2%
82.0%
45.3% 45.4% 45.6%
45.7%
_______________________________________________________________________________
1976
Unctd
Carter
Ford
79.98 3.0%
75% 25%
2.36 3.0%
Max.
95%
Final NEP Shares
1972
Rec. Cast
Mort. Turn. Turn.
Mix Carter Ford
DNV
- --
- -
10.47 12.7% 55%
45%
McGov
29.17 30.94 0.93
30.01 28.51 34.6%
96% 4%
Nixon
47.17 47.17 1.42
45.75 43.47 52.7%
22% 78%
Total
76.34 78.70 2.34
75.77 82.45 Calc
51.78% 48.22%
Votes 42.70
39.76
Carter share
of
McGovern
DNV
Recorded 51.05% 48.95%
55.0% 56.0% 57.0%
58.0% Votes
40.83 39.15
92.0%
50.4% 50.5% 50.7%
50.8%
93.0%
50.7% 50.9% 51.0%
51.1%
94.0%
51.1% 51.2% 51.3%
51.5%
95.0%
51.4% 51.6% 51.7%
51.8%
96.0%
51.8% 51.9% 52.0%
52.2%
___________________________________________________________________________________________________
Summary Analysis
This is the final of three pre-election articles I wrote with Michael Collins (autorank) and Alistair Thompson of SCOOP. The purpose was to quantify the risk of fraud in the 2006 Mid-terms. The analysis forecast that the Democrats would gain control of the House and Senate. It also indicated the House seats and Senate races where fraud was most likely to occur. And extensively documented votinganomalies” confirmed that millions of votes were either uncounted or switched.
The election fraud model projected that the Democrats would win at least 240 House seats, but lose 10-15 to fraud. It correctly forecast that they would gain control of the Senate by winning six GOP-held seats, although they barely won Virginia and Montana. The Democratic Tsunami overcame the fraud in the House and Senate.
There is no longer any doubt that the poll/vote discrepancies were caused by uncounted and switched votes. Evidence of fraud was once again found in the Final National Exit Poll which matched to the recorded vote count with the use of fallacious weightings. The 2006 Final “How Voted in 2004” weights were manipulated just like they were in the 2004 Final “How Voted in 2000”.
In 2006, the weights were transformed from 47 Bush/ 45 Kerry at 7pm to 49 Bush/ 43 Kerry at 1pm the next day! This replicated the 41 Bush/39 Gore to impossible 43 Bush/ 37 Gore weight changes in 2004. The net effect of the change was to cut the Democratic margin in half -from 55-43% to 52-46%! Applying realistic weights to the 7pm NEP (using the 12:22am 2004 NEP) the Democratic margin becomes 56.7-42.1%, exactly matching the 120- Generic poll trend projection! Was it a coincidence or confirmation? You decide.
This is the best evidence that once again the Final Exit Poll was forced to match a fraudulent miscount. Simple logic dictates that if just one demographic requires impossible or implausible weights and/or vote shares in order to match the vote count, then all other demographics must be bogus as well.
Matching to the vote is nothing new; exit pollsters have been doing it long before Bush arrived on the scene and stolen elections became the norm. In the pre-BushCo world, matching the Final NEP to an essentially fraud-free recorded vote made sense - until BushCo came along and stole the 2000 election, along with repeat performances in 2002 and 2004. The 2006 Democratic Tsunami overwhelmed the fraud but the Dems still "lost" 10-15 House seats they should have won.
Mark Lindeman said: “personally, I think Pew was probably not far off”, referring to the final Pew Generic poll (47 Dem / 43% Rep). The Democrats won all 120 pre-election polls. What about the other 119 pre-election polls? Is it just a coincidence that he chose to believe the Pew poll, an obvious outlier in which the 4% Democratic margin was 10% below the trend line? Talk about cherry-picking!
The Generic poll model projected a 56-42% Democratic landslide with a vote share which steadily increased over the 14 month period from Sept. 2005 to Election Day. The GOP trend line was flat. The 120-poll linear time series regression graph shows that the trend line closely matched both the 7:0pm National Exit poll and the Wikipedia vote count.
The Final 2006 National Exit poll was matched to the recorded, fraudulent vote count, with more than the usual percentage of uncounted votes and switched votes. Literally thousands of reported machine “glitches” were documented nationwide; 18,000 missing votes in FL-13 caused the Democrat to lose. Virtually all documented vote switches were Democratic to Republican. As Casey Stengel used to say: you can look it up.
http://www.pollingreport.com/2006.htm
5-poll Moving Avg
Projection
Poll
Survey
Dates
DEM GOP
Other Diff DemMA
GOPMA Dem
GOP
Diff DiffMA
Number
Average
All 49.5
38.3 12.1
11.2 49.5
38.3 56.8
43.2
13.6 13.6
2005
1
Newsweek RV 905
50 38
12 12
50.0 38.0
57.2
42.8
14.4 14.4
2
Pew RV 911
52
40 8
12 51.0
39.0 57.0 43.0
14.0 14.2
3
DemCorp LV 921
48 39
13 9
50.0 39.0
56.6
43.4
13.2 13.9
4
Newsweek RV 930
47 42
11 5
49.3 39.8
55.9 44.2
11.7 13.3
5
DemCorp LV 1010
46 41
14 5
48.6 40.0
55.4
44.6
10.9 12.8
6
GWU LV 1012
47
41 13
6 48.0
40.6 54.8
45.2 9.7
11.9
7
Hotline RV 1016
40 31
29 9
45.6 38.8
55.0
45.0
9.9 11.1
8
DemCorp LV 1023
48 39
12 9
45.6 38.8
55.0
45.0
9.9 10.4
9
Gallup RV 1023
50 43
7 7
46.2 39.0
55.1
44.9
10.2 10.1
10
ABC/WP RV 1102
52 37
12 15
47.4 38.2
56.0
44.0
12.1 10.4
11
DemCorp LV 1106
48 40
12 8
47.6 38.0
56.2
43.8
12.5 10.9
12
Newsweek RV 1105
53 36
11 17
50.2 39.0
56.7
43.3
13.4 11.6
13
Hotline RV 1115
41 35
24 6
48.8 38.2
56.6
43.4
13.2 12.3
14
DemCorp LV 1120
48 41
11 7
48.4 37.8
56.7
43.3
13.4 12.9
15
Time RV
1201 48
36 15
12 47.6
37.6 56.5
43.5
13.0 13.1
16
DemCorp LV 1204
49 39
12 10
47.8 37.4
56.7
43.3
13.4 13.2
17
CBS/NYT RV 1206
42 33
25
9 45.6 36.8
56.2
43.8
12.3 13.0
18
DemCorp LV 1212
49 41
9 8
47.2 38.0
56.1
43.9
12.2 12.8
19
Hotline RV
1213 43
33 25
10 46.2
36.4 56.6
43.4
13.3 12.8
20
NPR LV 1218
45 37
17
8 45.6
36.6 56.3
43.7
12.6 12.7
21
ABC/WP RV 1218
51 41
9
10 46.0
37.0 56.2
43.8
12.4 12.5
2006
22
Gallup RV
108 49
43
8 6
47.4 39.0
55.6
44.4
11.1 12.3
23
CBS/NYT RV 125
43 34
23
9 46.2
37.6 55.9
44.1
11.8 12.2
24
Dem Corp LV 125
49 41
10 8
47.4 39.2
55.4
44.6
10.9 11.8
25
ABC/WP RV 126
54 38
9
16 49.2
39.4 56.0
44.0
12.1 11.7
26
Pew RV 205
50
41
9 9
49.0 39.4
56.0
44.0
11.9 11.6
27
Gallup RV 212
50 43
8
7 49.2
39.4 56.0
44.0
12.1 11.8
28
GWU LV 215
46
41 14
5 49.8
40.8 55.4
44.6
10.9 11.6
29
Hotline RV 219
46 31
23 15
49.2 38.8
56.4 43.6
12.8 12.0
30
DemCorp LV 227
48 40
12 8
48.0 39.2
55.7
44.3
11.4 11.8
31
Gallup RV
301 53
39
7
14 48.6
38.8 56.2
43.8
12.3 11.9
32
FOX LV
301
48 34
18 14
48.2 37.0
57.1
42.9
14.2 12.3
33
Gallup RV
312 55
39
7
16 50.0
36.6 58.0
42.0 16.1
13.3
34
NPR LV
314
52 37
11 15
51.2 37.8
57.8
42.2
15.6 13.9
35
Newsweek RV 317
50 39
11 11
51.6 37.6
58.1
41.9
16.2 14.9
36
Time RV
323 50
41
9 9
51.0 38.0
57.6
42.4
15.2 15.4
37
CBS RV 409
44
34 22
10 50.2
38.0 57.3
42.7
14.6 15.5
38
ABC/WP RV
409 55
40
5 15
50.2 38.2
57.2
42.8
14.3 15.2
39
Gallup RV
409 52
42
6 10
50.2 39.2
56.6
43.4
13.1 14.7
40
Pew RV
416 51
41
8 10
50.4 39.6
56.4
43.6
12.8 14.0
41
CNN RV
423 50
40
9 10
50.4 39.4
56.5
43.5
13.0 13.6
42
Cook
430
44 32
24 12
50.4 39.0
56.8
43.2
13.5 13.4
43
Gallup RV
430 54
39 7
15 50.2
38.8 56.8
43.2
13.6 13.2
44
FOX LV
503 41
38 21
3 48.0
38.0 56.4
43.6
12.8 13.2
45
CNN RV
507 52
38 10
14 48.2 37.4
56.8
43.2
13.7 13.3
46
CBS/NYT RV 508
44 33
23 11
47.0 36.0
57.2
42.8
14.4 13.6
47
Newsweek RV 512
50 39
11 11
48.2 37.4
56.8
43.2
13.7 13.6
48
ABC/WP RV
515 52
40
9 12
47.8 37.6
56.6
43.4
13.1 13.5
49
Fabrizio LV 517
39 36
25 3
47.4 37.2 56.6
43.4
13.3 13.6
50
Hotline RV 521
42 36
22 6
45.4 36.8
56.1
43.9
12.2 13.3
51
Gallup RV
604 51
42
7 9
46.8 38.6 55.6
44.4
11.1 12.7
52
Gallup RV
611 51
39 10
12 47.0
38.6 55.6
44.4
11.3 12.2
53
FOX LV 614
46
33 20
13 45.8
37.2 56.0 44.0
12.0 12.0
54
CNN RV 615
45
38 16
7 47.0
37.6 56.2
43.8
12.5 11.8
55
Pew RV 619
51
39 10
12 48.8
38.2 56.6
43.4
13.2 12.0
56
Hotline RV 625
41 36
24 5
46.8 37.0
56.5
43.5
13.0 12.4
57
ABC/WP RV
625 52
39
9 13
47.0 37.0
56.6
43.4 13.2
12.8
58
Gallup RV
625 54
38
7 16
48.6 38.0
56.6
43.4
13.3 13.0
59
TIME LV
629 47
35 18
12 49.0
37.4 57.2
42.8 14.3
13.4
60
Gallup RV
709 51
41
9 10
49.0 37.8
56.9
43.1
13.8 13.5
61
AP-Ipsos RV 712
51 40
9 11
51.0 38.6
57.2
42.8
14.5 13.8
62
FOX LV
712
42 34
25 8
49.0 37.6
57.0
43.0
14.1 14.0
63
Hotline RV 723
48 32
20 16
47.8 36.4
57.3
42.7
14.6 14.3
64
CBS/NYT RV 725
45 35
20 10
47.4 36.4
57.1
42.9
14.2 14.2
65
Gallup RV
770 51
40
8 11
47.4 36.2
57.2
42.8
14.5 14.4
66
CNN RV
803
53 40
7
13 47.8
36.2 57.4
42.6
14.8 14.4
67
ABC/WP RV
806 52
39
8 13
49.8 37.2
57.6
42.4
15.2 14.7
68
AP-Ipsos RV 809
55 37
8
18 51.2 38.2
57.6
42.4
15.1 14.8
69
FOX LV
809
48 30
22 18
51.8 37.2
58.4
41.6
16.8 15.3
70
Gallup RV
810 50
41
9
9 51.6
37.4 58.2
41.8
16.4 15.7
71
Newsweek RV 811
51 39
10 12
51.2 37.2
58.2
41.8
16.3 16.0
72
Pew RV 813
50
41
9
9 50.8 37.6
57.8
42.2
15.5 16.0
73
Hotline RV 820
40 33
27 7
47.8 36.8
57.0
43.0
14.1 15.8
74
Gallup RV 820
47 45
7
2 47.6
39.8 55.2
44.8
10.3 14.5
75
CNN RV
820 52
43 6
9 48.0
40.2 55.1
44.9
10.2 13.3
76
CBS/NYT RV 821
47 32
21 15
47.2 38.8
55.6
44.4
11.2 12.3
77
TIME LV
824 51
40
9 11
47.4 38.6
55.8
44.2
11.6 11.5
78
Newsweek RV 825 50
38 12
12 49.4
39.6 56.0 44.0
12.0 11.1
79
FOX LV
830 48
32 21
16 49.6
37.0 57.6
42.4
15.3 12.0
80
CNN LV
902 53 43
4
10 49.8
37.0 57.7
42.3
15.4 13.1
81
ABC RV
907 50
42 9
8 50.4
39.0 56.8
43.2
13.5 13.6
82
Pew RV
910 50
39 11
11 50.2
38.8 56.8
43.2 13.6
14.0
83
Gallup RV
910 53
41
7 12
50.8 39.4
56.7
43.3
13.4 14.2
84
FOX LV
913 41
38 21
3 49.4
40.6 55.4
44.6
10.8 13.3
85
Gallup LV 917
48 48
4 0
48.4 41.6
54.4
45.6
8.8 12.0
86
CBS/NYT RV 919
50 35
15 15
48.4 40.2
55.2
44.8
10.5 11.4
87
CNN LV 924
55
42
3 13
49.4 40.8
55.3
44.7
10.6 10.8
88
FOX LV
927
49 38
14 11
48.6 40.2
55.3
44.7
10.6 10.3
89
Hotline RV 927
43 33
24 10
49.0 39.2
56.1
43.9
12.2 10.5
90
Zogby LV
928 42
33 25
9 47.8
36.2 57.4
42.6
14.8 11.7
91
CNN LV 1002
53
42
5 11
48.4 37.6
56.8
43.2
13.6 12.4
92
AP-Ipsos RV 1004
51 38
11 13
47.6 36.8
57.0
43.0
13.9 13.0
93
Pew RV
1004 51
41 8
10 48.0
37.4 56.8
43.2
13.5 13.6
94
TIME LV
1005 54
39
7 15
50.2 38.6
56.9
43.1
13.8 13.9
95
Newsweek RV 1006
51 39
7 12
52.0 39.8
56.9
43.1
13.8 13.7
96
ABC RV
1008 54
41
5 13
52.2 39.6
57.1
42.9
14.2 13.9
97
CNN LV
1008 58
37
5 21
53.6 39.4
57.8
42.2
15.6 14.2
98
Gallup LV 1008
59 36
4 23
55.2 38.4 59.0
41.0
18.1 15.1
99
Harris LV 1009
49 36
15 13
54.2 37.8
59.0
41.0
18.0 16.0
100
FOX LV 1011
50 41
9 9
54.0 38.2
58.7
41.3
17.4 16.7
101
CNN LV 1015
56 40
4 16
54.4 38.0
59.0
41.0
17.9 17.4
102
NBC RV
1016 52
37 11
15 53.2
38.0 58.5 41.5
17.0 17.7
103
Newsweek LV 1021
55 37
8 18
52.4 38.2
58.0
42.0
16.1 17.3
104
Gallup LV 1023
54 41
5 13
53.4 39.2
57.8 42.2
15.7 16.8
105
ABC RV
1023 54
41
5 13
54.2 39.2
58.2
41.8
16.3 16.6
106
CNN LV 1022
57 40
3 17
54.4 39.2
58.2
41.8
16.5 16.3
107
Hotline RV 1023
52 34
13 18
54.4 38.6
58.6
41.4
17.2 16.4
108
Zogby LV 1025
44 33
23 11
52.2 37.8
58.2
41.8 16.4
16.4
109
FOX LV 1025 49
38 13
11 51.2
37.2 58.2
41.8
16.3 16.5
110
Newsweek LV 1027
53 39
8 14
51.0 36.8
58.3
41.7
16.6 16.6
111
CNN LV
1029 53
42 5
11 50.2
37.2 57.8
42.2
15.5 16.4
112
NBC LV
1030 52
37 11
15 50.2
37.8 57.4
42.6
14.8 15.9
113
CBS/NYT LV 1101
52 33
15 19
51.8 37.8
58.0
42.0
16.1 15.9
114
Newsweek LV 1103
54 38
8 16
52.8 37.8
58.4
41.6
16.9 16.0
115
TIME LV 1103
55 40
5
15 53.2
38.0 58.5
41.5
17.0 16.0
116
Pew LV
1104
47 43
10 4
52.0 38.2
57.9
42.1
15.8 16.1
117
ABC LV 1104
51 45
4
6 51.8
39.8 56.8
43.2
13.7 15.9
118
USA/Gallup LV 1106
51 44
4
7 51.6
42.0 55.4
44.6
10.9 14.8
119
CNN LV 1106
58 38
4
20 52.4
42.0 55.8
44.2
11.5 13.8
120
FOX LV 1106
49 36
15 13
51.2 41.2
55.8
44.2
11.5 12.7
___________________________________________________________________________________________________
Generic Pre-election Poll Trend vs. the
7:07pm and Final National Exit Poll
To derive an approximation to the TRUE vote for all demographics, the 7pm NEP vote shares and weights were adjusted to match the 57.8-40.2% Wikipedia Democratic vote margin. The base case assumptions were that 4.0% of Democratic votes and 1.4% of Republican/other votes were uncounted and 7% of Democratic votes were switched to the Republicans.
The TRUE 16% Democratic margin was based on the 120-Generic poll linear trend which was confirmed in the Wikipedia early vote count. It has always been the case that millions of ballots, mostly Democratic, are never counted. In this election, uncounted ballots accounted for less than half of the total discrepancy. The major fraud factor was vote-switching at the polling place and/or the central tabulator. The analysis does not include the millions of disenfranchised voters (mostly Democratic) who never got to the polls. The Generic LV pre-election polls, as one-sided as they were, low-balled the intended Democratic vote.
In both the 7:07pm and Final 1:00pm Exit Polls, the results were adjusted to obtain an estimated TRUE vote. For each demographic, switched vote rates were applied to final vote shares to determine pre-switch shares. Uncounted votes were subtracted from the 7:07pm exit poll result. Unlike the Final, the 7:07pm poll was NOT matched to the vote count. Uncounted and switched vote shares were added back to the Final since it was contaminated in matching to the vote count.
The True Vote is given by:
TV = Recorded + Uncounted + Switched
National Exit Poll
Source..... Dem Rep Other
CNN-7pm 55.2%
43.4% 1.5%
CNN-Final 52.2% 45.9% 2.5%
NYT
53.1% 44.9% 2.0%
Reported National Vote
Wikipedia 57.7% 41.8% 0.5%
CBS- Nat 52.7% 45.1%
2.2%
CBS-State 51.3% 46.4% 2.3%
120 Generic Poll Linear Regression Trend
Dem = 46.98 + .0419x
Rep = 38.06 +
.0047x
Substituting x = 120 and allocating 60% of the undecided vote (UVA) to the Democrats:
........ Trend + UVA =
Projection
Dem = 52.01 + 4.42 =
56.43%
Rep = 38.62 +
2.95 = 41.57%
Wikipedia Summary of the November 7, 2006
United States House of Representatives election results
http://en.wikipedia.org/wiki/United_States_House_elections%2C_2006
Party Seats Popular Vote
2004 2006 Chg
Dem 202
233 +31 39,267,916 57.7%
+11.1%
Rep 232
202 -30 28,464,092 41.8%
–7.4%
Ind
1 0
-1 669,707
0.1% +0.5%
Other
0 0
0 255,876
0.4% –3.2%
Total 435
435 0 68,057,591
100%
Democratic
Projection Probabilities
Proj Freq
Prob
54.0
120 100.0
54.5
119 99.2
55.0
116 96.7
55.5
105 87.5
56.0
92 76.7
56.5
76 63.3
57.0
47 39.2
57.5
31 25.8
58.0
20 16.7
58.5 5
4.2
59.0
1 0.8
Note:
76.7% probability that the vote share would exceed 56%
National
Exit Poll Timeline vs. the True Vote (Generic Poll Trend)
VOTED 2004
--------- 7:07pm ----------- --------- 11pm Final --------- ----- True Generic
Vote
----- p;
MIX Dem Rep
Other MIX Dem
Rep Other MIX
Dem Rep Other
Kerry
45% 93%
6% 1%
43% 92%
7% 1%
49% 93%
6% 1%
Bush
47% 17%
82% 1%
49% 15%
83% 2%
46% 17%
82% 1%
Other
4% 67%
23% 10%
4% 66%
23% 11% 1%
67% 23% 10%
DNV
4% 67%
30% 3%
4% 66%
32% 2%
4% 67%
30% 3%
TOTAL 100%
55.2% 43.4% 1.4%
100% 52.2% 45.9%
1.9% 100% 56.7%
42.1% 1.2%
Democratic
Vote Share Sensitivity to NEP “How Voted in 2004” Weights
National Exit Poll (7pm)
Weight: DNV 4%; Other
4%
7pm
Kerry
43% 44%
45% 46%
47% 48%
49% 50% 51%
Bush
49% 48%
47% 46%
45% 44%
43% 42% 41%
Dem
53.7% 54.4% 55.2% 56.0%
56.7% 57.5% 58.2% 59.0% 59.8%
Final National Exit Poll (1pm)
Weight: DNV 4%; Other
4%
1pm
Kerry
43% 44%
45% 46%
47% 48%
49% 50% 51%
Bush
49% 48%
47% 46%
45% 44%
43% 42% 41%
Dem
52.2% 53.0% 53.7% 54.5%
55.3% 56.0% 56.8% 57.6% 58.4%
True Vote
Weight: DNV 4%; Other 1%
True
Kerry
43% 44%
45% 46%
47% 48%
49% 50% 51%
Bush
52% 51%
50% 49%
48% 47%
46% 45% 44%
Dem
52.2% 52.9% 53.7% 54.5%
55.2% 56.0% 56.7% 57.5% 58.3%
NEP Demographic Timeline Summary
CNN.com - Elections
2006
10,207
Respondents
13,251 Respondents
7:07pm
11/07
1:00pm
11/08
Generic Pre-election Trend
Categ
Dem
Rep
Other
Dem Rep
Other Margin
Dem
Rep Other Margin
Vote04
55.20% 43.36%
1.44%
52.19% 45.88% 1.93% 6.31%
57.50% 41.33% 1.17% 16.17%
Gender
55.04% 43.47%
1.49%
52.55% 44.96% 2.49%
7.59%
58.04% 40.47% 1.49% 17.57%
Rac/Gen
54.81% 43.71%
1.48%
52.62% 45.51% 1.88%
7.11%
57.77% 40.23% 0.00% 17.54%
Race
55.10% 43.11% 1.79%
53.34% 44.85% 1.81%
8.49%
57.88% 41.31% 1.81% 16.57%
Age
54.89% 43.44%
1.67%
52.44% 44.92% 1.64%
7.52%
57.89% 40.44% 1.67% 17.45%
Income
55.07% 43.27% 1.66%
53.28% 44.89% 1.83%
8.39%
57.92% 40.42% 1.66% 17.50%
Educ
55.05% 43.39%
1.56%
52.95% 45.47% 1.58%
7.48%
57.86% 40.58% 1.56% 17.28%
Decided
57.16% 41.48% 1.35%
54.25% 44.24% 1.51%
10.01%
58.19% 40.45% 1.35% 17.74%
Party
54.50% 43.72%
1.78%
53.04% 45.56% 1.40%
7.48%
57.80% 40.45% 1.75% 17.35%
Ideology 54.42% 43.58%
2.00%
52.53% 45.47% 2.00%
7.05%
57.34% 40.66% 2.00% 16.68%
Region
55.04% 43.54%
1.42%
52.74% 45.32% 1.94%
7.42%
57.94% 40.34% 1.94% 17.60%
Religion 54.22% 43.90%
1.88%
52.64% 45.30% 2.06%
7.34%
57.50% 40.62% 1.88% 16.88%
Area
54.84% 43.40%
1.76%
52.79% 45.21% 2.00%
7.58%
57.84% 40.40% 1.76% 17.44%
Senate
55.83% 42.60%
1.57% 55.11%
43.89% 1.00%
11.23%
57.75% 40.83% 1.42% 16.92%
Mean
55.08% 43.28%
1.63%
53.03% 45.10% 1.79%
7.93%
57.80% 40.61% 1.53%
17.19%
StDev
0.69% 0.58%
0.18%
0.76% 0.52% 0.34%
1.23% 0.22% 0.32%
0.48% 0.45%
HOW VOTED IN
2004
MIX Dem
Rep
Other
MIX** Dem
Rep
Other
MIX* Dem
Rep Other
Kerry
45% 93%
6%
1%
43% 92%
7%
1%
50%
93% 6% 1%
Bush
47% 17%
82%
1%
49% 15%
83%
2%
45%
17% 82% 1%
Other
4% 67%
23%
10%
4% 66%
23%
11%
1%
67% 23% 10%
DNV
4% 67%
30%
3%
4% 66%
32%
2%
4% 67%
30% 3%
TOTAL
100% 55.20% 43.36%
1.44%
100% 52.19% 45.88%
1.93%
100% 57.50%
41.33% 1.17%
GENDER
MIX Dem
Rep
Other
MIX Dem
Rep
Other
MIX*
Dem Rep Other
Male
49% 53%
45%
2%
49% 50%
47% 3%
48%
55% 43% 2%
Female
51% 57%
42%
1%
51% 55%
43%
2%
52%
59% 40% 1%
TOTAL
100% 55.04% 43.47%
1.49%
100% 52.55% 44.96%
2.49%
100% 57.08%
41.44% 1.48%
RACE/GENDER
MIX Dem
Rep
Other
MIX Dem
Rep
Other
MIX
Dem Rep Other
WM
39% 47%
51%
2%
39% 44%
53% 3%
39%
50% 48% 2%
WF
40% 51%
48%
1%
40% 49%
50%
1%
40%
53% 45% 2%
NWM
9% 76%
22%
2%
9% 75%
23%
2%
9%
78% 20% 2%
NWF
11% 79%
20%
1%
11% 78%
21%
1%
11%
84% 14% 2%
TOTAL
99% 54.26% 43.27%
1.47%
99% 52.09% 45.05%
1.86%
99% 56.96%
40.06% 1.98%
WHEN DECIDED
MIX Dem
Rep
Other
MIX*** Dem
Rep
Other
MIX
Dem Rep Other
Today
9% 60%
37%
3%
10% 61%
36%
3%
9%
62% 35% 3%
3Days
9% 57%
41%
2%
9% 51%
47%
2%
9%
58% 40% 2%
Week
8% 53%
45% 2%
9% 52%
47%
1%
8%
54% 44% 2%
Month
21% 58%
41%
1%
21% 54%
44%
2%
21%
58% 41% 1%
Before
52% 57%
42% 1%
50% 54%
45%
1%
52%
57% 42% 1%
TOTAL
99% 56.59% 41.07%
1.34%
99% 53.71% 43.80%
1.49%
99% 56.94%
40.72% 1.34%
RACE
MIX Dem
Rep
Other
MIX** Dem
Rep Other
MIX Dem Rep
Other
White
80% 49%
49%
2%
79% 47%
51%
2%
80%
50% 48% 2%
Black
10% 88%
12%
0%
10% 89%
10%
1%
10%
90% 10% 0%
Latino
8% 72% 26%
2%
8% 69%
30% 1%
8%
74% 24% 2%
Asian
2% 65%
35%
0%
2% 62%
37%
1%
2%
71% 29% 0%
Other
1% 59%
36%
5%
2% 55%
42% 3%
1%
62% 33% 5%
TOTAL
101% 55.65% 43.54%
1.81%
101% 53.89% 45.27%
1.84%
101% 56.96%
42.23% 1.81%
AGE
MIX Dem
Rep
Other
MIX**** Dem
Rep
Other
MIX
Dem Rep Other
18-29
11% 60%
38%
2%
12% 60%
38% 2%
11%
62% 36% 2%
30-44
23% 55%
43%
2%
24% 53%
45%
2%
23%
57% 41% 2%
45-59
33% 55%
44%
1%
34% 53%
46%
1%
33%
58% 41% 1%
60+
33% 53%
45%
2%
29% 50%
48%
2%
33%
54% 44% 2%
TOTAL 100%
54.89% 43.44%
1.67%
99% 52.44% 44.92%
1.64%
100% 56.89%
41.44% 1.67%
INCOME
MIX Dem
Rep
Other
MIX Dem
Rep
Other
MIX
Dem Rep Other
< 15
7% 67%
30%
3%
7% 67%
30%
3%
7% 69%
28% 3%
15-30
12% 63%
35%
2%
12% 61%
36%
3%
12%
65% 33% 2%
30-50
21% 58%
41%
1%
21% 56%
43%
1%
21%
61% 38% 1%
50-75
22% 52%
46%
2%
22% 50%
48%
2%
22%
54% 44% 2%
75-100
15% 53%
46%
1%
15% 52%
47%
1%
15%
54% 45% 1%
100-150
13% 50%
48%
2% 13%
47% 51%
2%
13% 51%
47% 2%
150-200
5% 47%
51%
2%
5% 47%
51%
2%
5%
49% 49% 2%
200+
5% 48%
51%
1%
5% 45%
53%
2%
5% 49%
50% 1%
TOTAL
100% 55.07% 43.27%
1.66%
100% 53.28% 44.89%
1.83%
100% 56.95% 41.39%
1.66%
REGION
MIX Dem
Rep
Other
MIX* Dem
Rep
Other
MIX
Dem Rep Other
NE
22% 64%
35%
1%
22% 63%
35%
2%
22%
66% 33% 2%
MidW
27% 57%
42%
1%
27% 52%
47%
1%
27% 59%
40% 1%
South
29% 45%
54%
1%
30% 45%
53%
2%
30%
48% 50% 2%
West
21% 57%
40%
3%
21% 54%
43%
3%
21%
58% 39% 3%
TOTAL
99% 54.49% 43.10%
1.41%
100% 52.74% 45.32%
1.94%
100% 57.03%
41.25% 1.94%
EDUCATION
MIX Dem
Rep
Other
MIX*** Dem
Rep Other
MIX
Dem Rep Other
NoHS
4% 64%
35%
1%
3% 64%
35%
1%
4% 67%
32% 1%
HSG
21% 57%
42%
1%
21% 55%
44% 1%
21%
59% 40% 1%
Col
30% 52%
46%
2%
31% 51%
47%
2%
30%
54% 44% 2%
Grad
26% 52%
46%
2%
27% 49%
49%
2%
26%
54% 44% 2%
PostG
19% 60%
39%
1%
18% 58%
41%
1%
19%
62% 37% 1%
TOTAL
100% 55.05% 43.39%
1.56%
100% 52.95% 45.47%
1.58%
100% 57.09%
41.35% 1.56%
EDUCATION
MIX Dem
Rep
Other
MIX** Dem
Rep
Other
MIX
Dem Rep Other
NoDeg
54% 55%
43%
2%
55% 53%
45%
2%
54% 55%
43% 2%
Grad
46% 55%
43%
2%
45% 53%
46%
1%
46%
59% 39% 2%
TOTAL
100% 55.00% 43.00%
2.00%
100% 53.00% 45.45%
1.55%
100% 56.84%
41.16% 2.00%
PARTYID
MIX Dem
Rep
Other
MIX** Dem
Rep
Other
MIX Dem
Rep Other
Dem
39% 93%
6%
1%
38% 93%
7%
0%
40% 94%
5% 1%
Rep
35% 9%
90%
1%
36% 8%
91%
1%
35% 12%
87% 1%
Ind
26% 58%
38%
4%
26% 57%
39%
4%
25%
61% 35% 4%
TOTAL
100% 54.50% 43.72%
1.78%
100% 53.04% 45.56%
1.40%
100% 57.05%
41.20% 1.75%
IDEOLOGY
MIX Dem
Rep
Other
MIX* Dem
Rep
Other
MIX Dem
Rep Other
Lib
21% 88%
10%
2%
20% 87%
11%
2%
21% 91%
7% 2%
Mod
48% 62%
36%
2%
47% 60%
38%
2%
48%
64% 34% 2%
Con
32% 21%
77%
2%
32% 20%
78%
2%
32%
22% 76% 2%
TOTAL
101% 54.96% 44.02%
2.02%
99% 52.00% 45.02%
1.98%
101% 56.87%
42.11% 2.02%
RELIGION
MIX
Dem Rep
Other
MIX Dem
Rep
Other
MIX
Dem Rep Other
Prot
55% 46%
52% 2%
55% 44%
54%
2%
55%
49% 49% 2%
Cath
26% 56%
43%
1%
26% 55%
44% 1%
26%
58% 41% 1%
Jewish
2% 87%
10%
3%
2% 87%
12% 1%
2%
87% 10% 3%
Other
6% 71%
25%
4%
6% 71%
25%
4%
6%
75% 21% 4%
None
11% 76% 22%
2%
11% 74%
22% 4%
11%
80% 18% 2%
TOTAL
100% 54.22% 43.90%
1.88%
100% 52.64% 45.30%
2.06%
100% 57.07%
41.05% 1.88%
___________________________________________________________________________________________________
2006 Uncounted and Switched Votes
The goal of this model wa to determine the percentage of votes which needed to be switched from the Democrats to the Republicans in order to match the Nov. 9 CBS News reported 52.7% Democratic vote. The Democratic 120 Generic poll trend forecast 56.4%; the initial Wikipedia vote count was 57.7D-41.8R. The model assumes that the Wikipedia numbers represented the TRUE national vote. The analysis does not include the millions of disenfranchised
voters (mostly Democratic) who never got to the polls. The Generic LV pre-election polls, as one-sided as they were, low-balled the intended Democratic vote.
Based on historical statistics, approximately 3% of total votes cast are never counted. Approximately 75% of them are Democratic. The racial mix was used to approximate the number of uncounted votes in each state, assuming that 8% of non-whites and 2% of white votes were uncounted. The base case analysis assumes that 7% of the recorded votes were switched. To match the Wikipedia vote share, we assume that 3.16% of total votes cast were uncounted. Almost one in 12 Democratic votes must have been switched to the Republicans.
To derive an approximation to the TRUE vote in each demographic category, the 7pm NEP vote shares and weights were adjusted to match the Wikipedia vote. The base case assumptions were that 4.0% of Democratic votes and 1.4% of Republican/other votes were uncounted and 7% of Democratic votes were switched to the Republicans.
The 16% Democratic margin was based on the 120-Generic poll linear trend which was confirmed in the Wikipedia early vote count. It has always been the case that millions of ballots, mostly Democratic, are never counted. In this election, uncounted ballots accounted for less than half of the total discrepancy. The major fraud factor was vote-switching at the polling place and/or the central tabulator.
Assuming a 7.0% switch-vote rate, the Democratic TRUE vote was 56.94%, a close match to the Generic 120-Poll trend line projection. At an 8.5% switch rate the TRUE vote was 57.7%, matching the Wikipedia recorded vote share.
Model Assumptions
Switched: 7.00% Dem to Rep
Uncounted: 3.16% of total votes cast
Uncounted
Vote Shares
Race Share Reported
Pct Unctd Total Pct
Unctd
White 2.0%
62542 81.7% 1276 63819 80.7%
1.61%
Other 8.0%
14043 18.3% 1221 15264
19.3%
1.54%
Total 3.16%
76585 100% 2497
79082 100%
3.16%
Base Case
Summary
Switched TRUE Vote
Dem
75% 40331 52.66%
1873 42204 53.37% 2.45%
2823 45027 56.94%
Rep
23% 34564 45.13%
574 35138 44.43% 0.75%
-2823 32315 40.86%
Other
2% 1690 2.21%
50 1740 2.20% 2.87%
0 1740 2.20%
Total 3.16%
76585 100.0% 2497 79082
100.0% 3.16%
0 79082 100.0%
Probability
of Vote Discrepancy
MoE
1.50%
Prob = NORMDIST
(0.5266, 0.5694, 0.015/1.96, TRUE)
1 in
86,082,782
Sensitivity
Analysis of Democratic TRUE Vote to Switched-vote rate
Switch Dem%
Probability: 1 in
5.0% 56.17% 444,121
6.0% 56.43% 2,308,702
(matches 120 Generic poll trend)
6.5% 56.68% 13,359,311
7.0%
56.94% 86,082,782 (base case)
7.5% 57.19%
617,885,835
8.0% 57.45%
4,941,793,389
8.5% 57.70%
43,247,703,725 (matches Wikipedia vote count)
U.S. House Vote: CBS News
11/09
Reported
Uncounted Switch TRUE
Total Dem
GOP Other Margin
Total% Dem Rep
Other Dem
Dem
Rep Other Margin
76585 52.66% 45.13%
2.21% 7.53% 3.16%
1873 574 50
2823
56.94% 40.86% 2.20% Diff
AL
579 38.7%
60.8% 0.5% -22.1%
3.7% 16
5 0.4
16 42.6%
56.8% 0.6% 7.1%
AK
202 40.1%
56.9% 3.0% -16.8%
3.7% 6
2 0.2
6
44.0% 53.0%
2.9% 7.2%
AZ
1127 42.5% 51.1%
6.4% -8.6%
2.7% 23
8 0.6
34
46.2% 47.5%
6.3% 7.1%
AR
747 60.0%
40.0% 0.0% 19.9%
3.1% 18 6
0.5 31
64.5% 35.5%
0.1% 9.7%
CA
6236 56.9% 39.8%
3.3% 17.2%
3.4% 158
53 4.2
248
61.3% 35.4%
3.3% 9.3%
CO
1371 53.1% 41.7%
5.2% 11.4%
2.6% 27
9 0.7
51
57.2% 37.7%
5.1% 8.5%
CT
1079 60.4% 39.0%
0.6% 21.4%
2.9% 23
8 0.6
46
64.9% 34.5%
0.6% 9.6%
DE
509 38.7%
57.2% 4.1% -18.5%
3.5% 13
4 0.4
14
42.5% 53.4%
4.1% 6.9%
FL
3727 40.2% 58.0%
1.8% -17.8% 3.1%
88 29
2.3 105
43.9% 54.2%
1.8% 7.0%
GA
1916 41.7% 58.3%
0.0% -16.6% 4.0%
58 19
1.5 56
45.8% 54.2%
0.1% 7.5%
HI
338 65.1%
34.9% 0.0% 30.2%
6.4% 16
5 0.4
15
69.9% 30.0%
0.1% 11.6%
ID
435 39.8%
55.9% 4.4% -16.1%
2.3% 8
3 0.2
12
43.3% 52.4%
4.3% 6.6%
IL
3127 55.4% 44.2%
0.4% 11.2%
3.2% 75
25 2.0
121
59.7% 39.8%
0.5% 9.1%
IN
1646 48.8% 49.9%
1.3% -1.1%
2.7% 33
11 0.9
56
52.8% 45.9%
1.4% 7.9%
IA
1028 47.7% 50.6%
1.8% -2.9%
2.3% 18
6 0.5
34
51.5% 46.7%
1.8% 7.6%
KS
827 43.7%
54.4% 1.9% -10.8%
2.7% 16
5 0.4
25 47.4%
50.6% 1.9% 7.2%
KY
1244 47.9% 49.0%
3.1% -1.0%
2.6% 24
8 0.6
42
51.8% 45.1%
3.1% 7.8%
LA
901 32.6%
64.4% 3.0% -31.7%
4.2% 28
9 0.7
21
36.5% 60.6%
3.0% 6.4%
ME
529 65.2%
30.4% 4.3% 34.8%
2.2% 9
3 0.2
24
69.9% 25.8%
4.3% 10.0%
MD
1344 61.6% 35.3%
3.1% 26.3%
4.1% 41
14 1.1
58
66.2% 30.8%
3.0% 10.2%
MA
1068 74.3% 18.5%
7.2% 55.7%
2.8% 22
7 0.6
56
79.3% 13.6%
7.1% 11.5%
MI
3516 51.0% 46.2%
2.8% 4.7%
3.1% 83
28 2.2
126
55.2% 42.1%
2.7% 8.4%
MN
2178 53.0% 42.5%
4.5% 10.5%
2.6% 42
14 1.1
81
57.1% 38.4%
4.5% 8.5%
MS
581 43.2% 50.8%
6.0% -7.6%
4.3% 19
6 0.5
18 47.4%
46.8% 5.9% 7.9%
MO
2050 47.1% 50.3%
2.6% -3.2%
2.9% 45
15 1.2
68
51.0% 46.4%
2.6% 7.8%
MT
805 39.0%
59.1% 1.9% -20.1%
2.5% 15
5 0.4
22
42.5% 55.6%
1.9% 6.6%
NE
586 43.9%
56.1% 0.0% -12.3%
2.5% 11
4 0.3
18
47.6% 52.4%
0.0% 7.2%
NV
573 50.1%
45.2% 4.7%
4.9% 3.0%
13 4
0.3 20
54.2% 41.2%
4.6% 8.3%
NH
402 52.0%
47.0% 1.0%
5.0% 2.2%
7 2
0.2 15
56.0% 43.0%
1.0% 8.2%
NJ
1859 51.0% 47.6%
1.3% 3.4%
3.4% 47 16
1.3 66
55.3% 43.4%
1.4% 8.5%
NM
545 55.8%
44.2% 0.0% 11.6%
2.9% 12 4
0.3 21 60.1%
39.9% 0.1% 9.0%
NY
3561 64.2% 35.6%
0.2% 28.6%
3.6% 95
32 2.5
160
68.8% 30.9%
0.3% 10.4%
NC
1842 50.8% 49.2%
0.0% 1.5%
3.6% 49 16
1.3 65
55.0% 44.9%
0.1% 8.6%
ND
433 65.6%
34.4% 0.0% 31.2%
2.5% 8
3 0.2
20
70.3% 29.7%
0.0% 10.2%
OH
3763 52.4% 47.4%
0.2% 4.9%
2.9% 82
27 2.2
138
56.5% 43.2%
0.3% 8.5%
OK
905 41.2%
57.2% 1.5% -16.0%
3.3% 22
7 0.6
26
45.0% 53.4%
1.6% 7.2%
OR
1264 56.4% 41.4%
2.2% 15.0%
2.5% 24
8 0.6
50
60.7% 37.1%
2.2% 8.9%
PA
3815 54.0% 44.7%
1.3% 9.3%
2.8% 81 27
2.2 144
58.2% 40.4%
1.3% 8.7%
RI
372 71.0% 11.3%
17.7% 59.7% 2.7%
7
2 0.2
18 75.9%
6.8% 17.3% 11.0%
SC
1072 43.5% 55.3%
1.2% -11.8% 3.9%
32 11
0.8 33
47.6% 51.2%
1.2% 7.7%
SD
667 69.1%
29.4% 1.5% 39.7%
2.7% 13
4 0.4
32
73.9% 24.5%
1.5% 10.7%
TN
1712 50.2% 46.6%
3.2% 3.7%
3.1% 40 13
1.1 60
54.4% 42.5%
3.2% 8.3%
TX
3994 44.6% 51.8%
3.6% -7.2%
3.0% 90
30 2.4
125
48.5% 48.0%
3.5% 7.5%
UT
549 42.6%
51.5% 5.8% -8.9%
2.4% 10 3
0.3 16
46.3% 48.0%
5.7% 7.0%
VT
524 53.2%
44.7% 2.1%
8.6% 2.2%
9 3
0.2 20
57.3% 40.6%
2.1% 8.4%
VA
2148 37.7% 56.8%
5.5% -19.1% 3.6%
57 19
1.5 57 41.5%
53.1% 5.4% 6.8%
WA
1309 61.3% 38.1%
0.5% 23.2%
2.9% 28
9 0.8
56
65.9% 33.6%
0.6% 9.7%
WV
446 57.8%
42.2% 0.0% 15.7%
2.3% 8
3 0.2
18
62.2% 37.8%
0.0% 9.0%
WI
1852 54.0% 45.1%
0.8% 8.9%
2.6% 36 12
1.0 70
58.2% 40.9%
0.8% 8.6%
WY
377 48.8%
49.3% 1.9% -0.5%
2.3% 7
2 0.2
13
52.7% 45.4%
1.9% 7.8%
___________________________________________________________________________________________________
Generic Poll Projection
Trend vs. Final 10 Poll Average
This is an update to the Generic poll model using two projection methods:
1) Allocating undecided voters (UVA) to the final 120-poll linear trend.
2) Allocating the UVA to the average of the final 10 Generic polls.
The 120-poll trend and 10-poll projections matched to within .05%.
The reported Democratic vote share was
1) 51.3% based on CBS state totals (11/09).
2) 52.7% based on CBS national totals.
3) 57.7% based on Wikipedia national totals.
4) 52.6% based on the CNN Final National Exit Poll (11/08).
Key model results:
Assuming the Democrats captured 60% of the undecided vote,
1-the 120-Generic poll trend line projected a 56.43% share
2-the Final 10 Generic poll average projected a 56.38% share
The probability is near ZERO that the vote/poll discrepancies were due to chance.
120 Generic Poll Linear Regression
Trend:
Dem = 46.98 + .0419x
GOP = 38.06 + .0047x
Substituting x=120 and allocating 60%
(UVA) to the Democrats:
........Trend + UVA = Projection
Dem = 52.01 + 4.42 = 56.43%
Rep = 38.62 + 2.95 = 41.57%
________________________________________________
Projected Democratic Vote
Share based on the Final 10-poll Average
Assumption: 60% of the undecided vote (UVA)
allocated to Democrats
.............. Dem
GOP Margin
Avg
Date 52.0 38.7 13.3
Harris 1023 47
33 14
AP
1030 56 37
19
CBS
1101 52 33
19
Nwk
1103 54 38
16
TIME
1103 55 40
15
Pew*
1104 47
43 4
ABC*
1104 51
45 6
USA*
1106 51
44 7
CNN
1106 58 38
20
FOX
1106 49 36
13
Average
52.0% 38.7% 13.3%
UVA
4.4% 2.9%
0.9%
Projection
56.4% 41.6% 14.8%
CBS State Vote 51.3% 46.4%
4.9%
Discrepancy
-5.1% 4.8%
-9.9%
3(*)
outliers
Average
49.67 44.00 5.67
2-party
53.02 46.98
7
polls
Average
53.00 36.43 16.57
2-party
59.27 40.73
10 Polls
Average
52.00 38.70 13.30
2-party
57.33 42.67
_________________________________________________________________
Sensitivity Analysis I
Probability of discrepancy between the aggregate CBS-reported state vote and the 10-poll projection for various margin of error (MoE) and undecided voter allocation (UVA) assumptions.
10 Polls 52.00%
60%
UVA 4.38%
Projected 56.38%
UVA
50% 56.1% 60% 65%
70% 75%
Proj. 55.7%
56.1% 56.4% 56.8% 57.2% 57.5% Democratic projection
Margin 13.3%
14.2% 14.8% 15.5% 16.2% 17.0%
Deviation 4.4% 4.8%
5.1% 5.5% 5.8% 6.2%
MoE Probability
of Vote Discrepancy
1 in
1.25% 219b
36t 1286t nc
nc nc
1.50% 151m
5.4b 62b 1.8t
63t 3002t
1.75% 1.8m
25m 157m 1.9b
26b 428b
2.00%
99k 766k
3m 21m
161m 1.4b
2.25%
13k 68k 207k
950k 4.8m 27m
2.50%
3k 12k
29k 102k 381k 1.5m
2.75%
1k 3.2k 6.8k
19k 58k 186k
3.00%
446 1.2k 2.2k
5.3k 14k 37k
_________________________________________________________________
Sensitivity Analysis II
Probability of discrepancy between 120 Generic Poll forecast and the Final NEP for various MoE assumptions
Democratic vote share:
Exit poll:
52.70%
Generics:
56.43%
Deviation:
3.73%
MoE Probability:
1 in
1.00% 7,474,854,153,312
1.25% 402,249,154
1.50% 1,825,026
1.75% 67,847
2.00% 7,787
2.25% 1,728
2.50% 579
2.75% 255
3.00% 135
_________________________________________________________________
Sensitivity Analysis III
Probability of discrepancy betweenWikipedia vote count and the National Exit Poll for various MoE assumptions
Democratic share:
Exit poll:
52.7%
Wikipedia:
57.7%
Deviation:
5.0%
MoE Probability:
1 in
1.00% nc
1.25% 450,359,962,737,050
1.50% 30,938,221,975
1.75% 93,056,001
2.00% 2,083,900
2.25% 150,566
2.50% 22,577
2.75% 5,467
3.00% 1,838
_________________________________________________________________
A number of Excel-based 2004 election models provide the tools necessary for those interested in entering their own assumptions to run the analysis. The numbers don’t lie – they scream fraud. In addition, I have written more than 200 original posts concerning the 2002, 2004 and 2006 elections. After slicing and dicing the data in a myriad of ways, the evidence is overwhelming: Kerry won beyond a reasonable doubt. The reader is encouraged to download the
Election Calculator, Interactive Election Simulation and True Vote Excel models and try to come up with one plausible Bush win scenario.
These are links to 2004
preliminary and final national exit polls
11/2/04, 3:59pm 8349 respondents
http://www.scoop.co.nz/stories/pdfs/Mitofsky4zonedata/US2004G_3737_PRES04_NONE_H_Data.pdf
11/2/04, 7:33pm 11027 respondents
http://www.scoop.co.nz/stories/pdfs/Mitofsky4zonedata/US2004G_3798_PRES04_NONE_H_Data.pdf
11/3/04,
12:22am 13047 respondents
http://media.washingtonpost.com/wp-srv/politics/elections/2004/graphics/exitpolls_us_110204.gif
11/3/04, 1:25pm 13660 respondents
http://www.scoop.co.nz/stories/pdfs/Mitofsky4zonedata/US2004G_3970_PRES04_NONE_H_Data.pdf
2004 Election Model (for viewing only)
The Nov.1, 2004 Election Model projected both the popular and electoral vote using the average of the final 18 national polls and a 25000-election trial Monte Carlo Electoral Vote simulation. The base case assumption was that 75% of undecided voters would break for Kerry. This resulted in a 51.8-48.2% (2-party) vote and 337 electoral votes. A 5000-trial simulation was executed for each of the five undecided voter scenarios: 60, 67, 75, 80 and 87%.
Kerry won the popular and electoral vote with a 98-99.9% probability (see the summary analysis below). He led the National polls in every month except September (also show below).
This graph displays the Kerry’s 2-party pre-election national poll monthly trend.
Calculates the True Vote for all elections since 1988, as well as for the 2004 state vote in NY, CA, OH and FL. The model includes sensitivity analysis tables and corresponding graphics for various scenario combinations.
Interactive Election Simulation
The Interactive Election Simulation (D) determined that Kerry’s won by 51.8-47.2% based on the weighted state exit polls (WPE) and 50.8-48.2% based on the 12:22am National Exit Poll. It contains worksheets for 1) state pre-election and exit polls (WPE, Composite, Best GEO)
2) 18 national pre-election polls,
3) 12:22am National Exit Poll,
4) “How Voted in 2000” demographic sensitivity analysis,
5) state and precinct exit poll response optimizations analysis;
6) Gender vote analysis;
7) Ohio exit poll and
8) Census 2004 vote data.
The key assumptions which drive the model are pre-election undecided voter allocation; Exit Poll: “cluster” effect. This graph displays the results of a simulation of state and national pre-election and exit polls.
The True Vote Model encapsulates the mathematical arguments which strongly suggest that Kerry easily won the 2004 election. It uses 2000/2004 election data, 2000 voter mortality and voter turnout in 2004 in order to determine mathematically feasible (and plausible) weights. The 12:22am NEP vote shares are the base caseassumptions. According to the Census, a total of 125.74mm votes were cast and 3.44mm were uncounted.
A powerful sensitivity analysis feature enables the user to view the effects of incremental changes in the assumptions on Kerry’s national vote. Alternative scenario combinations are displayed in various tables.
Here’s a challenge to those who still believe Bush won: come up with just ONE plausible Bush win scenario.
(the 12:22am and Final 2pm NEP are available for reference)
Enter your own assumptions for:
1) Kerry's share of New, Gore, Bush and Other 2000 voters
2) Turnout of Gore, Bush, Other
2000 voters in 2004
3) Uncounted votes as a % of total votes cast (2.74% according to the 2004
Census)
Monte Carlo Polling Simulation
Illustrates how the Law of Large Numbers and the Central Limit Theorem apply to various polling sample sizes.
________________________________________________________________
Part
II: Response to the TruthIsAll FAQ
A TruthIsAll (TIA) FAQ
by Mark Lindeman
TruthIsAll (TIA) is the pseudonym of a former Democratic Underground (DU) regular who now posts elsewhere. Many of his writings are available at
http://www.truthisall.net. TIA argues, among other things, that the 2004 U.S. presidential pre-election polls and the exit polls both indicate that John Kerry
won the election.
Who is TruthIsAll (TIA) and why do you care what he says?
I don't know who he is. Apparently he has worked in quantitative analysis for many years; he has described himself as an "Excel expert." His allegations of election fraud -- in particular, his enumeration of (presumably far-fetched) things one must believe in order to believe that Bush won the 2004 election -- formed the template for the 2005 Project Censored story making the same case.
Many people believe that TIA's arguments irrefutably demonstrate that John Kerry won the popular vote and the election. Many more people believe that TIA's arguments have no merit whatsoever, and therefore don't bother to try to refute them. I do not like to see weak arguments go unchallenged. (But plenty of people have criticized TIA's arguments -- I make no claim to originality.)
I also think that these particular weak arguments lead to poor political judgments. If TruthIsAll is right, it follows that the 2004 election was obviously stolen. So, one might conclude, among other things, that (1) most voters preferred Kerry to Bush, (2) Democratic political leaders are effectively complicit in a cover-up, and (3) Democrats cannot win crucial elections until and unless the current voting systems are thrown out. I disagree with all of these conclusions.
(Now that the Democrats have won House and Senate majorities in the 2006 election, argument #3 must be modulated. Fraud-minded observers now often argue that the Republicans stole some votes and even some seats, but that either for some reason they could not -- or did not dare? -- steal enough votes, or that they had to decide how many votes to steal several weeks in advance, and were caught flat-footed by a late Democratic surge. As I address on the Miscellaneous page, I have seen no convincing evidence of widespread vote miscount.
OK, so what are TIA's arguments?
He has many posts, but many of them make these basic claims:
Pre-election polls (both state and national) gave Kerry better than a 99% chance of winning the election.
Well-established political generalizations, such as the "incumbent rule," buttress the conclusion that Kerry should have won.
The exit polls gave Kerry a lead in the popular vote well beyond the statistical margin of error, and diverged substantially from the official results in many states, generally overstating Kerry's vote total. (This claim is largely true, although not everything TIA says about it is.)
Fraud is the only good explanation of the exit poll discrepancies. In particular, there is no good reason to believe that Kerry voters participated in the exit polls
at a higher rate than Bush voters. Since Kerry did better than Bush among people who did not vote in 2000, Bush would have had to do much better among Gore 2000 voters than Kerry did among Bush 2000 voters -- and that can't have happened.
It is pretty easy to look around and determine that not many political scientists are expressing agreement with these views. But why not? It could be that political scientists have a status quo bias and/or are afraid to rock the boat by confronting unpleasant truths; perhaps some are even paid by Karl Rove. It could be that political scientists simply haven't looked at the evidence. It could be that political scientists see gaping holes in TIA's arguments. It could be some combination of those factors, and others besides. For what it's worth, I will explain at some length why I don't agree with TIA's views.
Please note that this is not a one-size-fits-all election integrity FAQ.
Do you think that electronic voting machines are almost ridiculously
insecure and unreliable?
I do, although I certainly don't agree with every word of every critic. Do you think that John Kerry won or should have won Ohio? You may be right. I don't know. I doubt it, but I haven't set out to knock down each and every argument about fraud or vote suppression in the 2004 election -- in fact, I agree with several of them. But the arguments (by TIA and others) that Kerry won the popular vote are not at all likely to be true, in my opinion.I have rarely quoted TIA at length because (1) the FAQ is already very long and (2) TIA's writing is often hard to read. But if you think I have mischaracterized one of his arguments, or if you have other questions or comments about the FAQ, please feel free to contact me at [my last name]@bard.edu.
TIA:
These are just a few well-known researchers whose analyses confirm mine: Steve Freeman, Ron Baiman, Kathy Dopp, Greg Palast, RFK Jr., Mark C. Miller, Bob Fitrakis, Michael Keefer, John Conyers, Richard Hayes Phillips, Paul Lehto, etc. At least four have advanced degrees in applied mathematics or systems analysis. I have three degrees in applied mathematics.
It would be useful if you would mention the names of the political scientists or statisticians who disagree with my analysis and believe that Bush won the election fairly in 2004. How do they account for his 3 million vote “mandate”? How do they explain where Bush found 16 million new voters which were added to his 2000 total (net of voter mortality and turnout)? What are their confirming demographics? Do any of the analysts you refer to have degrees in mathematics or statistics? Did their 2004 projections match the exit polls? Or did they match the vote miscount? Have any of them ever written about or considered election fraud in their analysis? Have they analyzed the impact of uncounted votes on election results? What is their track record? Were their projections based on economic or political factors or did they use state and national polling? What was the time period between Election Day and their final projections?
________________________________________________________________
TruthIsAll FAQ: (1)
1.1. What did the national pre-election
polls indicate?
According to most observers, most pre-election polls put George W. Bush slightly ahead of John Kerry. The summary of "final trial heats" at pollingreport.com shows Bush ahead in 10, Kerry ahead in 3, and one tied. (The average margin was Bush +1.45%.) Among the "pollster vote projections" (in which the pollsters may make subjective judgments about how undecided voters are likely to vote), five favor Bush, two favor Kerry, and one is a tie. (For what it is worth, both projections favoring Kerry are attributed to Democratic pollsters; one projection favoring Bush is attributed to a Republican pollster. So among nominally neutral pollsters, Bush was ahead in four projections and tied in the fifth; the average margin was Bush +1.3%.)
Please note that every single one of these polls yielded a result within its statistical margin of error, even assuming that the polls were otherwise perfect. So they certainly don't justify high confidence that Bush was "really" ahead, much less that he was destined to win. Some folks might say that the polls revealed a "statistical tie," but that characterization throws away useful information. As I said, most of the polls put Bush slightly ahead.
Yet TruthIsAll argued, in his final Election Model, that the pre-election polls gave Kerry a 99.99% probability of winning the popular vote (as well as a 99.8% probability of winning the electoral vote). Why are his numbers so different? There are two main reasons.
First, TruthIsAll uses poll results for all registered voters, rather than for likely voters, whenever possible. Presumably he believes that the pollsters were biased toward understating Kerry support. In many surveys, people who are least likely to vote tend to favor Democratic candidates. So, for instance, the final pre-election survey by the Pew Research Center gave Bush a 3-point lead among "likely voters," but gave Kerry a 1-point lead among all "registered voters." TruthIsAll uses the figure that puts Kerry ahead, even though Pew itself headlined the report, "Slight Bush Margin in Final Days of Campaign." [More on turnout and likely voters below.]
Second, TruthIsAll assumes that undecided voters will (or did) sharply favor Kerry. (His final model assumed that 75% of undecided voters would vote for Kerry -- although, in fairness, he also considered alternative proportions.) [More on undecided voters on the next page.
TIA:
Kerry and Bush were essentially tied at 48 in the final national pre-election polls, but the trend of undecided voters was to Kerry. Of the 18 national polls analyzed in the pre-Election Model, 9 were registered voter (RV) and 9 were likely voter (LV). Kerry led in 11 of the 18 polls, Bush in 6. The ABC RV poll was a tie. Kerry led the 18-poll average by 47.8-47.7% and the 9-RV poll average by 47.2-46.7%. Bush led the 9-LV poll average by 48.8-48.4%. Kerry led the 18-pre-election poll average every month except for January and September. The 0.87 statistical correlation between the 11-poll average Bush monthly approval and average poll was close to a perfect 1.0.
Final Election Day Zogby and Harris LV polls were not included in the Nov.1 election model. Both had Kerry winning by 50-47%. Including these polls, Kerry led in 13 by 48.0-47.5%. But that was before the allocation of undecided voters. Harris and Zogby said they were breaking 2-1 to 4-1 for Kerry. The 12:22am National Exit Poll (NEP) had Kerry winning the 6% of voters who decided on Election Day by 53-40% and the 10% who decided during the month prior to the election by 60-38%. So there is no doubt that Kerry won a solid majority of late undecided voters. The Nov.1 Election Model included a sensitivity analysis based on 5 undecided voter scenarios in which Kerry was projected to win 60, 67, 75, 80 and 87% of the undecided vote.
You continue to reject the historical fact that late undecided voters would break for the challenger, Kerry. But world-class pollsters Zogby and Harris, who have a combined 60 years of polling experience, indicated that their Election Day polling Kerry won undecided voters by 67-75%. The National Exit Poll also reported that Kerry won a clear majority of undecided voters. This was not unusual; historical evidence indicates that undecided voters break for the challenger over 80% of the time, especially when the incumbent is unpopular - and Bush had a 48.5% average approval rating on Election Day. Final Zogby polls in nine battleground states had Kerry leading by an average of 50-45%. He was projected to win all nine by 53-46%, but only won five by 50-49%. The margin of error was exceeded in six states - a 1 in 52 million probability.
You dismiss the significance of the Bush 48.5% approval rating on Election Day. But all presidential incumbents with approval below 50% lost re-election (Ford, Carter, Bush I) while all incumbents over 50% won (Eisenhower, Johnson, Nixon, Reagan and Clinton). The near-perfect 0.87 correlation between Bush’s monthly approval rating and national poll average share is further evidence. The correlation was confirmed by the 12:22am National Exit Poll which Kerry won by 51-48%.
You overlook the fact that 41 states switched to Bush from the final pre-election polls to the recorded vote. But none of the 10 states which switched to Kerry was a battleground state. Forty-three states red-shifted to Bush from the 12:22am exit polls. Oregon was the only battleground state which shifted to Kerry – by less than one percent. It’s also the only state in which voting is done by mail. Was this all just a coincidence, a case of bad polling or an indication that fraud occurred?
This is a graph of the 2004 National Pre-election Polls Monthly Trend
1.2. How does TIA come up with those 99+%
probabilities of a Kerry victory?
Basically, those probabilities (for both state and national polls) assume that all his assumptions (for instance, about how "undecided" voters will vote) are right, and that the only source of uncertainty is random sampling error. I argue below that his assumptions are more wrong than right. They certainly aren't 100% reliable. (TruthIsAll himself suggests that the polls might be biased -- against Kerry, of course.)
TIA:
Mark says that my assumptions are not “100% reliable” and “are more wrong than right”. What does 100% reliability mean when it comes to assumptions?
And how are they more wrong than right? Let’s take a close look at some assumptions.
-Does he mean the base case 12:22am NEP vote shares?
The sensitivity analysis provides a range of assumptions: 2000 voter turnout, Kerry’s share of returning Gore, Bush, Nader voters and others who did not
vote in 2000. Which assumptions does he believe are more wrong than right?
-Does he mean the undecided voter allocation?
I provide a 60-87% undecided voter allocation range (see the Monte Carlo EV sensitivity analysis). The 75% base case matches that of world-class pollsters Zogby and Harris. I trust their combined 70 years of experience a lot more than the Mystery Pollster. What polls did he run? Is Mark implying that MP knows more than Zogby and Harris?
-Does he mean the Margin of Error?
I use pre-election state poll 600- sample MoE (4%) to compute the MoE. The state exit poll MoE is adjusted for a user-entered cluster effect.
The 12:22am National Exit Poll (13047 sample) adjusted for a 30% cluster effect yields a 1.12% MoE. In the notes to the NEP, Edison-Mitofsky claim the MoE is 1.0%. http://www.geocities.com/electionmodel/NEP13047.mht
-Does he mean the annual mortality rate?
I use the published U.S. 0.87% annual rate. It’s a fact.
-Does he mean the assumption that only living Gore, Bush or Nader 2000
voters could have voted in 2004?
It’s a fact. Or does he believe in reincarnation?
-Does he mean the random sampling assumption?
I refer once again to Edison-Mitofsky’s notes (link above).
-Does he mean the assertion that the Final NEP “How Voted in 2000”
weights (43% Bush / 37% Gore) and corresponding vote shares were drastically
changed to match the Bush 51-48% vote?
It’s a fact. The Final NEP has always been matched the recorded vote.
-Does he disagree that the “How Voted in 2000” weights were
mathematically impossible?
It’s a fact. Do the math.
-Does he disagree that matching to the NEP only makes sense if the
election is fraud-free?
Is it his assumption that 2004 was fraud-free? What about 2000, 2002 and 2006?
-Does he disagree with the overwhelming statistical evidence that the
election was stolen?
In light of the above, is that not a fair conclusion?
1.3. Doesn't the high turnout in the
election mean that the registered-voter poll results are probably more accurate
than the likely-voter results?
No, high turnout is not a reason to dismiss the likely-voter results. Most pollsters already expected high turnout. For technical reasons, it is hard to compare pollsters' various turnout assumptions to the official figures, but the survey results don't change very sharply if we change turnout assumptions by a few points. To include every respondent who claims to be registered would include many people who have very little prospect of voting.
In Pew's final pre-election poll (data available for download here), Pew scored over 62% of its respondents as "likely voters," scoring 8 or 9 on its 0-to-9 likely voter scale. (Actually, this percentage is weighted -- for instance, young respondents weighh more heavily than older ones. The unweighted results are even less favorable to Kerry.) The actual presidential turnout in 2004 is estimated by Dr. Michael McDonald at about 60.3% of the eligible voting-age population. In order for Kerry to take a slight lead in the Pew survey, one must either include all voters scoring as low as 5 on the likely voter scale -- which implies about 77% voting-age turnout -- or assume that about three quarters of all undecided voters would vote for Kerry. In order to give Kerry an appreciable lead, one has to jack up the projected turnout and allocate the vast majority of undecided voters to Kerry.
By strange coincidence, TruthIsAll did exactly that: he jacked up the turnout to include all self-reported registered voters (which, in the Pew survey, would be about 80% voting-age turnout, or around 160 million voters nationwide instead of 120 million), and allocated three quarters of undecided voters to Kerry. Presto, Kerry took the lead.
In January 2005, TIA claimed, "Any reputable pollster will tell you that in this election, RV's were a more accurate gauge of the vote." What a strange claim. Pollingreport.com reports (here and on the following "earlier" pages) likely-voter results from well over a dozen separate pollsters. Were they all disreputable? Did they all repudiate their likely-voter models?
TIA:
It’s nonsense to extrapolate voter turnout based on the type of poll. Pollingreport.com also provides companion RV polls from these same pollsters. Nine of the final 18 national polls in my pre-election model were RVs – and presto! Kerry won 5. Nine were LV’s – and presto! Kerry won 6! You could look it up.
________________________________________________________________
1.4. How about the state polls?
There TIA's data hold up somewhat better, although his probabilities don't. While the national polls (prior to TIA's massaging) fit the official results rather closely, the state polls do not fit as well. The median state poll in TIA's analysis, prior to TIA's allocation of undecideds, had a Kerry margin about 2.8 points larger than Kerry's actual performance. After allocating undecideds 75% to Kerry, the median discrepancy is about 4.5 points.Looking at the crucial battleground states, the discrepancies don't seem very suspicious.
TruthIsAll had Kerry ahead by three points in Ohio, but only one Ohio poll out of the last ten actually put Kerry ahead. (This discrepancy could owe to flukes of timing, TIA's preference for registered-voter results, and/or TIA's reported propensity to ignore certain survey results he regards as biased.) Thus, although TIA's final model (again, the link -- find "OH") gave Kerry an 866.49% probability of winning Ohio, most observers would have leaned in the other direction. In my roundup, combining RealClearPolitics.com and electoral-vote.com figures, Bush had an average 1.9-point lead in the Ohio polls, quite close to his official margin of 2.1 points. (By the way, I checked two sources to ensure that RealClearPolitics' evident political bias didn't seep into its poll reporting; the results are closely comparable. Below, I link to RCP because its tables are easier to read.)
Similarly, because of TIA's allocation of most undecideds to Kerry, his Interactive Election Simulation spreadsheet gave Kerry a 73% chance of winning Florida despite depicting the race as nominally tied in the polls. In his final model report, Kerry has over an 86% probability of winning Florida. (The RealClearPolitics.com roundup gives Bush a narrow average margin of 0.6 points, with Bush ahead in 4 polls, Kerry ahead in 3, and the other 2 tied.) Bush did clearly do better in Florida than polls had projected, winning by just over 5 points.
Kerry won Pennsylvania as projected -- although even there, TIA's 96.69% proobability in the final model seems misplaced. Kerry's 2.3-point winning margin in Pennsylvania was smaller than TIA's estimated 5 points prior to allocating undecideds. However, in the RealClearPolitics.com roundup, no poll put Kerry more than 4 points ahead; the average was 0.9 points, and the median was 2 points.
In summary, first of all, TruthIsAll's simulation results asserting a 99.8% probability that Kerry would win the electoral vote depended heavily on very favorable assumptions about Ohio and Florida. Second, the state polls may have overstated Kerry's official vote share, although part of the overstatement probably owes to TIA's selection of polls. (Later I will consider the argument that the state-level pre-election poll discrepancies and the exit poll discrepancies support each other as evidence of fraud.)
TIA:
You fail to distinguish between weighted and unweighted averages, claiming Bush led the pre-election state polls. But you used an unweighted average to derive the national share. Kerry led the national weighted average (based on state voting population) from July to Election Day, except for a brief period in September. Kerry also led in the national pre-election polls all year.
You use the median of the data set when you should be using the weighted mean. Despite your protestations to the contrary, the pre-election polls did NOT match the official recorded vote, but DID match the exit polls. Kerry led the 18 nationals by a slight 0.5% - before my so-called undecided allocation “massaging”. Allocating undecided voters is necessary for projecting the final vote. Even professional pollsters do it. It’s foolish to ignore undecided voters, especially when a very unpopular president with a 48% approval rating is running. I believe Zogby and Harris.
Go here to see how the individual pre-election state and exit polls compared to each other - and to the recorded vote.
On the other hand, matching the Final NEP to a miscounted recorded vote is not massaging; at best, it’s inadvertent poll-rigging and intellectually dishonest. It implies ZERO fraud. There is no justification for matching the Final Exit Poll to the recorded vote. It’s just catapulting the propaganda for an illegitimate regime. The use of bogus, mathematically impossible weights and implausible vote shares in order to match the Final National Exit Poll to a fraudulent vote count is, well…fraudulent.
The Interactive Election Simulation graph displays the results of a 200- election trial run. In PA, Kerry’s RECORDED exit poll margin understated his TRUE margin by 5%. As for Ohio, you apparently still believe that Bush won the state. Kerry won the OH exit poll by 52-48%. And you claim that Bush clearly did better in Florida (he “won” by 5 points). Once again, you fall into the insidious trap of implicitly assuming that the RECORDED vote was fraud-free.
1.5. What about cell phones?
TIA and others have argued that the pre-election polls were biased against Kerry because they do not cover people who only use cell phones -- and these were disproportionately young voters who favored Kerry. Scott Keeter, drawing on a close analysis of Pew Research Center survey data, has concluded that because the polls are weighted to match the age distribution in the population, cell-phone-only voters had little effect on the polls' accuracy. "While cell-only voters were more supportive of John Kerry than voters overall, they were similar to voters within their own age cohort."
(Keeter's findings also appeared in Public Opinion Quarterly.) Certainly Pew's age weightings seem fairly close to the mark. For instance, in their final pre-election poll (weighted), respondents aged 18-24 comprise 8.5% of the likely voters, and respondents 18-34 total 22.9%.
In the Current Population Survey, self-reported voters 18-24 are 9.3% of all voters, and voters 18-34 are approximately 23.8% (derived from Table B). If one assumes, generously, that voters 18-24 favored Kerry about 60% to 40%, then any underrepresentation of young voters may have cost Kerry a small fraction of a percentage point in Pew's likely voter estimate.
TIA:
In 2004, 122.3 million votes were recorded. According to voting records cited by Greg Palast, over 3 million additional votes were uncounted (spoiled, provisional, absentees, etc), confirming the 2004 Census Vote Survey (0.30% MoE) which indicated that 125.7mm voted. Approximately 27 million (22% of 125.7mm) were voters who did not vote (DNV) in 2000.
According to the 7:33pm National Exit Poll, about 61% of DNV (16.5mm) were NEW voters (mostly younger cell-phone users). Kerry won the DNV group by 59-39% (5.4mm votes). According to the 12:22am NEP (13047 respondents) Kerry won DNV by 57-41% (4.4m votes).Assuming that Kerry’s share of NEW voters was equal to his total DNV vote share, then his vote margin was approximately 3.0m among these NEW voters. Since Kerry lost the RECORDED vote by 3 million, the number of NEW voters was a significant component of the TRUE Kerry vote.
________________________________________________________________
The
"Rules": Did They Favor Kerry?
2.1. Don't undecided voters break sharply
for the challenger?
Undecided voters probably sometimes break sharply for the challenger. But I can find no evidence that this rule is useful in "allocating" reported undecided voters in presidential elections. In fact, overall, reported undecideds seem to break about evenly.
In support of the claim that undecideds break for the challenger, TruthIsAll has cited an essay by Chris Bowers at MyDD. Bowers canvassed 28 presidential polls going back to 1976, and concluded that "undecideds break overwhelmingly -- better than 6 to 1 -- in favor of the challenger in a Presidential race." But a close reading reveals that Bowers did not examine declared "undecided" voters at all!
Bowers basically found that on average, incumbents did about 0.3 points better than the final polls indicated, while challengers did about two points better – indeed a ratio of more than 6 to 1. This result mostly had nothing to do with undecided voters. Nine of the 28 surveys were from 1996, a year in which the pre-election polls overstated incumbent Bill Clinton's winning margin by over 4 points on average. Five of those surveys reported no undecided voters whatsoever -- and their errors were not systematically different from the other four surveys'. (The second most accurate survey that year reported 11% undecided, equalling the other eight surveys combined.) Clearly Bowers's analysis cannot be used as a guide to allocate reported undecided voters. At most it might imply that challengers tend to do well when some polls report a lot of undecideds, but I see little support for even this inference.
I examined a total of 31 presidential polls going back to 1972, using the same National Council on Public Polls dataset used by Bowers. (1972 was the earliest year with multiple polls, at least one of which reported undecided voters.) In some elections, the polls with higher reported undecided rates indicated less net support for the incumbent than the other polls; in others, they indicated greater incumbent support. Overall, the results indicate no statistically significant relationship between percentage undecided and incumbent support. Thus, there is no statistical support for altering the margin to account for reported undecideds. Another way to say that is that reported undecideds seem to break about evenly (since allocating them doesn't appreciably alter the margin), perhaps slightly toward the challenger on average. But every election and every poll is different, so it is probably best just to say that we don't know.
TIA:
You neglect to mention that in our previous discussions (on DU and elsewhere), I cited a 155- election survey in which challengers won the undecided vote in 127 and incumbents won the undecided vote in just 19.
http://www.pollingreport.com/incumbent.htm
This is what the Gallup poll said about undecided voters:
“In the final USA TODAY/CNN/GALLUP poll before
the election, President Bush held a 49-47 edge over Sen. John Kerry when the
undecided voters were not allocated to a particular candidate. When Gallup, using a statistical model that
assumes that 9 of 10 of those voters would support Kerry, allocated the
voters, the poll ended as a dead heat with each candidate garnering 49%. The Gallup allocation formula is based on
analyses of previous presidential races involving an incumbent”.
You also fail to mention that I have referred to world-class pollsters Zogby and Harris. They have stated that challengers typically win over 2/3 of the undecided vote. The reason is straightforward. Voters are undecided when they are not enthusiastic about the incumbent. Bush had a 48.5% average rating in Election Day. A clear majority were NOT satisfied with his performance - especially undecided voters.
Assuming that Kerry got 2/3 of the late undecided votes, he was poised to be 51.5-47.5% winner. My pre-election model forecast a 51.3 - 47.7% Kerry win based on final state pre-election polls and 51.1 - 47.9% based on the final 18 national pre-election polls. The exit polls indicate that Kerry won a solid majority of the late undecided voters (last three days), as well as those who decided in the last month (60-38%).
This is what Zogby had to say about undecided
voters and Bush approval ratings a few days before the election:
So, first of all, the numbers. We have been looking for months at what we call a virtual tie between Kerry and Bush. I can report to you this morning that it's an actual tie. It's 47 percent for Kerry and 47 percent for Bush. You will note that my hair is a little grayer these days than it has been, where we stand today, we have approximately 5 percent undecided. We go as low as 4 percent undecided on some days.
Who are these undecided voters? They do tend to be Independents, that is, in terms of party affiliation. They do tend to be moderates, meaning not liberal and not conservative. Unlike previous years, they tend to be middle-aged voters, meaning not young and not old. We have polled them – the undecideds, that is. We have also done focus groups among undecideds. Contrary to popular belief, contrary to what I, personally, believed; these undecideds generally have told us that they had their minds made up in the past. This is a new phenomenon for them. They also told us that they were paying attention. They could identify for us basically where each candidate stood on the issues. Since we did the focus groups in the so called "battleground states" of Michigan, Ohio, Pennsylvania, Florida and Minnesota, they told us that they have seen campaign commercials.
Here are some of the things that we have found out among undecided voters: They like the President as a person. They give the President good marks for leadership and decisiveness. They appear to be very much opposed to the war and to the way that we got into the war. They give the President good marks on personal morality and family values. At the same time, they tell us that they like John Kerry, that he is smart enough, they believe that he is competent enough to be President. They also feel that John Kerry is one that they identify with on their issues, which are domestic issues that we heard about, the economy and health care, education and so on. They have questions about whether or not they trust Kerry, about whether or not they believe where he stands on issues. They do tend to say, and I guess after hearing so many commercials and seeing so many commercials, that they feel that Kerry is a person who changes his position to win popular support.
The undecideds told us that they're passionate, that they will vote. Some of them indicated that they were actually agonizing over their choice. And they also told us that they're genuinely undecided. Significantly, from the polling, and not from the focus groups, we find that only 1 in 5 of the undecided voters tell us that the President of the United States deserves to be reelected. Between one-third and 40 percent, so between 30 and 40 percent of the undecideds tell us that they feel it is time for someone new, and then half of the undecideds are not sure, or they're undecided, about that question, the President.
Now, on the basis of history, if history is any guide whatsoever, I still believe: number one, that the race is about the incumbent, a referendum on the incumbent, and the fact that the incumbent has not broken 48 percent suggests to me that the President is not polling good numbers for reelection. In addition to that, in terms of the other barometric readings that I look at, you still have a net negative of voters who say that the President is not doing a good job. He gets a negative job performance rating. He gets a negative reelect, meaning slightly more people think it's time for someone new than that he deserves to be reelected. And slightly more people feel that the country is headed on the wrong direction. Now, the President has improved all of those numbers, but they're still not reelection numbers. In addition to that, on the top five issues that the voters tell us are tops on their minds, the President leads in one of those issues, fighting the war on terrorism: He leads substantially against Senator Kerry. Among the other four issues, Senator Kerry leads by double digits over the President.
The key reason why I still think that Kerry will win, perhaps, possibly (laughter) -- have I made myself clear here? Okay. That traditionally, the undecideds break for the challenger against the incumbent on the basis of the fact, simply, that the voters already know the incumbent, and it's a referendum on the incumbent. And if the incumbent is polling, generally, under 50 percent and leading by less than 10, historically, incumbents have lost 7 out of 10 times. In this instance you have a tie, a President who is not going over 48, undecideds who tell us by small percentages that the President deserves to be reelected. And in essence, it gives all the appearances that the undecideds -- the most important people in the world today -- have made up their minds about President Bush. The only question left is: Can they vote for John Kerry? If it's a good turnout, look for a Kerry victory. If it's a lower turnout, it means that the President has succeeded in raising questions about John Kerry's fitness”.
---------------------------------------------------------------------------------------------------------------------------
This is what Harris Interactive said about
undecided voters:
Final Pre-election Harris Polls: Still Too Close to Call but Kerry
Makes Modest Gains
“The final Harris Polls show Senator John Kerry making modest gains at the very end of the campaign in an election that is still too close to call using telephone methods of polling. At the same time, the final Harris Internet-based poll suggests that Kerry will win the White House today in a narrow victory. Harris Interactive’s final online survey of 5,508 likely voters shows a three-point lead for Senator Kerry. The final Harris Interactive telephone survey of 1,509 likely voters shows a one-point lead for President Bush. Both surveys are based on interviews conducted between October 29, 2004 and November 1, 2004. The telephone survey is consistent with most of the other telephone polls, which show the race virtually tied.
If this trend is real, then Kerry may actually do better than these numbers suggest. In the past, presidential challengers tend to do better against an incumbent President among the undecided voters during the last three days of the election, and that appears to be the case here. The reason: undecided voters are more often voters who dislike the President but do not know the challenger well enough to make a decision. When they decide, they frequently split 2:1 to 4:1 for the challenger.
About one percentage point of the current difference probably reflects the inclusion in the online sample of people with cell phones but no landline (and therefore not included in the telephone survey) who favor Kerry by a wide margin”.
---------------------------------------------------------------------------------------------------------------------------
This is what Frank Newport, Editor in Chief of the Gallup Poll, said about undecided
voters and Bush approval:
Is the presidential race still too close to call?
Yes. No matter how you look at the
data, the two major-party candidates are neck and neck. Gallup's final Oct.
29-31 CNN/USA Today/Gallup poll shows that if all registered voters actually
turn out (which is not likely to happen, of course), John Kerry wins over
George W. Bush by two points.
Among likely voters, including our estimate of what the remaining undecided voters will do on Election Day, the race is dead even at 49% for each candidate.
Analyzing the data in other ways, such as modifying likely voter assumptions and changing turnout estimates, doesn't make a substantial difference in the election predictions. The support for both candidates is basically in the upper-40% range, and the final popular vote may well depend on which side is best able to mobilize its voters to go to the polls.
How does Gallup decide how to "allocate" undecided voters?
The allocation procedure is a
Gallup tradition, and represents Gallup scientists' best estimate of what the
final popular vote will be on Election Day.Here's how it works. The unallocated
numbers in the pool of likely voters (that is, the percentages of likely voters
supporting Bush and Kerry, not including undecided voters) are 49% for Bush and
47% for Kerry. We assume, based on an analysis of previous presidential and
other elections, that there is a high probability that the challenger (in an
incumbent race) will receive a higher percentage of the popular vote than he
did in the last pre-election poll, while there is a high probability that the
incumbent will maintain his share of the vote without any increase.
This has been dubbed the "challenger rule."
There are various explanations for why this may occur, including the theory that any voter who maintains that he or she is undecided about voting for a well-known incumbent this late in the game is probably leaning toward voting for the challenger.This persistent historical pattern is the basis for Gallup's decision to allocate the 3% undecided vote to Kerry and Nader/other, making the final estimate 49% Bush, 49% Kerry and 2% Nader/other.
How might the president's job approval rating influence the outcome of the election?
A president's job approval rating is an important indicator of re-election probabilities. But like so much else in this election, this measure isn't giving us a great deal of direction right now. Bush's job approval has slipped to 48% among national adults and is thus below the symbolically important 50% point. If we take that 50% line seriously, then Bush is in a less-than-auspicious position. No president since Harry Truman has won re-election with a job approval rating below 50%.
But the last two presidents who lost (George H. W. Bush and Jimmy Carter) had job approval ratings much worse than George W. Bush's 48%. He is clearly not as bad off as they were. On the other hand, the winners all had job approval ratings well above 50%. Bush is in a gray zone when it comes to his job approval rating.
What is the impact of turnout among younger voters?
We've heard a lot about the impact of younger voters this year. The data indeed show that Kerry does better among younger voters -- that is, those under age 30. Among all national adults in that age group, Kerry wins by a 59% to 34% margin.
_______________________________________________________________
2.2. What about the rule that incumbents don't
do better than their predicted shares in the final polls?
On average, it is true that incumbents don't do better -- or, rather, much better -- than their predicted shares in the final polls. As noted above, in the polls examined by Bowers (and by me), on average, incumbents did about 0.3 points better than the final polls indicated.
Averages can be misleading, and this one is. Remember the old joke about the hapless target shooter who grazes a tree with one shot, kills a bystander with the next, but brags that on average he nailed the bullseye? Well, in two of the five elections in the Bowers analysis (the five being 1996, 1992, 1984, 1980,
and 1976), the incumbent improved his vote share by about 2 points over the polls. In 1984, Ronald Reagan averaged 57% over six polls and got 58.8% in the official returns. In 1976, Gerald Ford averaged 45.7% over three polls (although that average is influenced by one poll that is much lower than the others) and got 48.0% in the official returns.
These elections are partly offset by 1996, not only because Clinton actually earned a lower vote share than predicted in the polls (50.3% in the polls, 49.2% in the vote), but because there were more polls in that year. So, on average, the incumbent poll figures are close to the official percentages. George W. Bush's 2004 share across the 14 trial heats in the pollingreport.com roundup was about 48.5%; his official vote share was 50.7%. Thus, an improvement of about two points, as in 1976 and 1984 -- hardly a wild exception to a well-established rule.
TIA:
I refer you to the preceding Zogby and Harris statements. Apparently, you disregard their combined 70 years of polling experience. You resort to citing a 2% deviation from the vote in 2 of the five elections. Reagan won a landslide. To say that he did 2% better in the poll average than the vote is reaching. As for Ford, you cite a limited 3-poll average. Since one of the three polls was much lower than the average, Ford’s vote share had to be lower than his other poll numbers indicated. Why not provide the actual poll results?
Once again, you assume that Bush’s true vote was 50.7%, and that there was no fraud. That is not a good assumption to make. This is analogous to the Final Exit Poll matching to an assumed fraud-free recorded vote count. My exit poll analysis indicates that the true Bush vote was 47%. The pre-election projection model had Kerry leading the final 18 national poll average by 48-47%.
2.3. What about the rule that incumbents
don't win when their final approval rating is below 50%?
TIA has stated that Bush's approval rating on November 1 was 48.5% based on the "average of 11 polls." I'm not sure which polls are included in that figure; different surveys typically yield slightly higher or lower approval figures. During October 2004, the Gallup Poll reported six approval figures for Bush: two above 50%, three below 50%, and one exactly 50%. The last pre-election survey put him at 48% approval, 47% disapproval, and 5% "not sure." Gallup's two November polls gave Bush 52% and 55% approval.) So, Bush's final Gallup approval rating was below 50%, although not very far below. So, is a final Gallup approval rating (slightly) below 50% a sure sign of imminent defeat? Starting in 1972, TIA cites three incumbents with approval ratings below 50, and two with approval ratings in the 50s. In order of approval rating, they are:
|
Year |
Incumbent |
Approval |
Vote |
|
1992 |
Bush (I) |
30 |
46.5% |
|
1980 |
Carter |
31 |
45.4% |
|
1976 |
Ford |
46 |
48.9% |
|
1996 |
Clinton |
55 |
54.7% |
|
1972 |
Nixon |
59 |
61.8% |
(By the way, TIA's 1992 figure appears to be from late September. A Gallup/Newsweek poll in late October gave Bush a 37% approval rating, which does not much alter the analysis. I do not know why TIA excluded 1984; a Gallup poll in late October showed Reagan at 58% approval, and he won 59.2% of the vote.)
Notice that prior to 2004, there is no incumbent with an approval rating between 46 and 55. So, one might say it is a rule that "incumbents with approval ratings under 50 never win." But one might just as accurately say that "incumbents with approval ratings over 46 always win." Does one of these statements make more sense than the other? For what it is worth, let's examine a plot of final approval ratings vis-a-vis incumbent two-party vote shares from 1956 on.
http://www.geocities.com/electionmodel/TruthIsAllFAQResponse_image001
In the plot above, the dashed blue line is the best-fit line for all these elections. The solid purple line is the best-fit line excluding the 1956 and 1964 elections, which appear to be out of trend. (The 1956 and 1964 approval ratings are from summer polls -- as are the 1972 and 1976 ratings.) Either way, it appears that incumbents with approval ratings over 45 are likely to win! The thinner, vertical purple line depicts this break-even point. (Notice that Carter in 1980 and Bush in 1992 each won over 45% of the two-party vote despite approval ratings in the low 30s.) Note also that 2004 lies below the best-fit lines: if anything, Bush might have been expected to do slightly better in the election based on his approval rating. With so few data points, it would be fairest to say that the election could have gone either way.
TIA:
Carter and Bush both LOST and had approval ratings below 50%. You can have your own theories, but not your own facts. And the FACT is that ALL incumbents with final approval ratings under 50% LOST the election – and that includes Bush. Your attempt to twist this FACT is patently obvious. Your scatter plot is just a diversion. Why don’t you just accept this FACT and move on?
The 0.87 correlation between the Bush 11-poll average 2004 monthly approval rating and his monthly pre-election 18-poll average was close to a perfect 1.0, indicating a very strong relationship. His Election Day approval rating was 48.5%. Kerry won the 12:22am National Exit Poll by 51-48%.
_______________________________________________________________
TruthIsAll FAQ: (3)
Describing
the Exit Poll Discrepancies
3.1. How do the exit polls work?
That's a long story. Let me say first of all that the main point of the exit polls is not to project who will win the election -- although the exit poll interviews are combined with vote count data in order to make projections. Mostly, the exit polls are used to provide information about who voted for whom and why. This purpose explains why the exit poll questionnaires are so long -- containing up to 30 questions.
In 2004, the exit pollsters chose anywhere from 15 to 55 precincts in each state for their exit poll sample: a total of 1480 precincts nationwide. Interviewers are sent to the corresponding polling places, some of which host more than one precinct. At some polling places, interviewers were instructed to approach every voter; at most, interviewers were instructed to approach every "Xth" voter, where X could be anywhere from 2 to 10. This instruction is intended to provide a random sample within the precinct; the value of X is chosen to obtain about 100 completed questionnaires per polling place.
The interviewers ask each approached voter to complete the exit poll questionnaire (attached to a clipboard). Slightly over half of the approached voters agreed to complete the questionnaire. Three times during the day, the interviewers call in tallied results for reported votes (presidential and often statewide races), plus all the answers on a subsample of questionnaires. In some states with many early/absentee voters, the exit pollsters also conduct telephone surveys of these early voters. (In vote-by-mail Oregon, only a telephone survey is conducted.)
Back at 'exit poll central,' the exit pollsters use these data in two ways: to make projections and tabulations. Projections are estimates of the vote shares in each state (and DC), together with measures of the uncertainty in those estimates. These projections initially are based on the interview tallies, which are compared with past results from the same precincts. Sometimes the interview tallies alone suffice to "call" the winner of a state with great confidence, especially if the race was not expected to be very close to begin with. Often the interview tallies are inconclusive. In these more competitive states, the exit pollsters continually update their projections to incorporate actual vote counts. The analysts examine both "quick counts" from the exit poll precincts and selected other precincts, and cumulative county-level totals. As quick counts become available, they replace the interview data in the projections.
Tabulations "break down" the vote share by various categories: for instance, gender, family income, or religious affiliation. These tabulations are computed for each state and for a special national sample. Preliminary tabulations were released for each state as the polls closed, and later updated to match the updated projections -- in effect, to match the official returns. (Actually, the initial tabulations were weighted to match the composite projections, which incorporate not only interview data but pre-election expectations.) National tabulations were updated several times, incorporating interview data and official returns from various states as they became available. Such tabulations, as posted on CNN.com, became the basis for much of the exit poll controversy.
3.2. How accurate are exit polls?
It depends, of course. Most attempts to argue that exit polls are highly accurate strangely steer around U.S. national exit polls; Steve Freeman, for instance, in his well-known 2004 paper, focuses on Germany and Utah. There is no single measure of exit poll accuracy, and even if there were, we wouldn't know what it equaled for all past U.S. exit polls. If you look closely, many of the arguments boil down to assertions that the exit polls should be accurate.
One useful accuracy measure is the "Within Precinct Error" (WPE), which basically equals the percentage difference between the exit poll margin and the official margin for each precinct. By convention, WPE is positive if the Republican candidate does better in the exit poll than in the official count, and negative if the Democratic candidate does better in the exit poll. (For instance, if Kerry led in a precinct exit poll by 5 points, but trailed in the official count by 3 points, the WPE would be -8 points.)
We know that in the last five large-scale presidential exit polls*, the average WPE has always been substantially negative, overstating the Democratic performance: -2.2 points in 1988, -5.0 points in 1992, -2.2 points in 1996, -1.8 points in 2000, and -6.5 points in 2004. (See page 34 of the evaluation report.) So, as far as we can tell from WPE, no recent exit poll has been accurate within the margin of error. And the 1992 survey was almost as far off as the 2004 survey. As Mark Blumenthal has pointed out, the documentary The War Room confirms that the actual 1992 exit poll projections -- at least at midday -- overstated Bill Clinton's performance. Few people noticed at the time: partly because the exit polls were not leaked on the Internet, partly because the discrepancies only altered the magnitude of Clinton's victory.
* Fine print: (1) I said "large-scale" because the Los Angeles Times has conducted national presidential exit polls, but those are much smaller. (2) In 1988, each network conducted its own exit polls; the WPE figure here is for CBS, the exit poll on which Warren Mitofsky worked. Later exit polls have been conducted by a series of network-sponsored consortiums.
Another useful accuracy measure is the Call 3 (end-of-day) "Best Geo Error" for each state. The Best Geo error is the discrepancy between the vote share estimate, based on interview data, and the official returns. (Like WPE, the Best Geo error is reported as a percentage difference in margins.) The vote share estimates can vary substantially from the raw percentages used to calculate WPE; they incorporate information on turnout, estimates of early and absentee voting (often based on telephone polls), and comparisons with past races. The average state Best Geo Error in 2004 was -5.0 points, somewhat smaller than the mean WPE.
TIA:
The exit polls always do not overstate the Democratic share; the vote count does. Remember, approximately 3% of total votes cast are never counted. Since about 80% (2.4%) are democratic, the exit poll margin differential due to this factor alone is 1.8%.
3.3. Couldn't spoiled ballots and/or fraud
account for these past discrepancies?
Probably not, although they certainly may contribute. Greg Palast offers an estimate of 3.6 million (or "3,600,380 to be exact") uncounted ballots in 2004 alone. In Palast's account, these include about 1.4 million spoiled ballots (ballots for which no presidential vote was counted, such as the infamous "hanging chad" ballots in Florida) -- also known as "residual votes" or "overvotes and undervotes." They also include about 1.1 million uncounted provisional ballots and over half a million absentee ballots. These figures do not add up to 3.6 million, and it isn't clear where they come from, how accurate they are, or what proportion of these ballots were cast for Kerry. (Electionline.org reported approximately 528,000 uncounted provisional ballots nationwide, although these figures were known to be incomplete.) We can at least say that many ballots go uncounted in each election, and there is good reason to believe that these uncounted ballots are disproportionately Democratic. (It is very hard to say how disproportionately Democratic they are.)
Whatever advantage uncounted ballots have conferred to Republican candidates in the past, they are unlikely to account for much of the exit poll discrepancies. There is no obvious relationship between uncounted ballots and exit poll results. For instance, New Hampshire has had double-digit exit poll discrepancies (Within Precinct Error) in three of the last four presidential elections (evaluation report, page 33), but its residual vote rate was 1.7% in 2000 and 1.2% in 2004. (Incidentally, 2000 was the election without a double-digit WPE in New Hampshire.)
One might suppose that uncounted ballots could at least account for a mean WPE of about -2, arguing like this: if 3% of votes are never counted, and if these uncounted votes skew 80:20 to Democrats (2.4% of total vote to 0.6%), then they cost Democrats about 1.8% on the margin. However, the arithmetic is less favorable to this analysis than one might suppose, because Democratic votes lost in heavily Democratic (or heavily Republican) precincts have minimal impact on expected WPE in those precincts. For instance, if a precinct's voters actually cast 90% of their votes for the Democratic candidate, but fully 5% of those Democratic votes go uncounted, the Democrat will end up with about 89.5% of the vote, for an expected WPE of -1 in that precinct.
One certainly can't rule out a priori that fraud might account for at least part of the 1992 exit poll discrepancies. But as far as I know, no one has made a serious attempt to argue that George H. W. Bush committed double-digit fraud in New Jersey that year (as the exit polls might be taken to suggest) – or, more generally, to explain how Bush stole perhaps 5 million net votes that year, and why he bothered. In the end, the argument seems circular at best. People who began by asserting that exit polls are accurate end up asserting that the 1992 exit polls possibly may have been accurate.
TIA:
You gloss over uncounted votes as
having minimal impact on WPE in heavily Democratic precincts. This assertion
makes no sense. Votes are accumulated
at the state level. The WPE in a particular precinct is irrelevant to the final accumulated state total. Compare the 2004 recorded vote (122.3m) to total votes cast (125.7m). That’s a 3.4 million vote difference. If we assume that 80% of the 3.4 million or 2.7 million were Kerry votes and the other 20% (0.70 million) were Bush votes, that’s a net loss of 2 million votes to Kerry. Since Bush “won” the recorded vote by 62-59mm, a full 2/3 of the 3 million vote margin was due to uncounted votes. Let’s do the numbers: Add Kerry‘s 2.7m UNCOUNTED votes to his RECORDED 59m to get his total of 61.7 million. Do the same for Bush: 62+0.7= 62.7m. There goes the Bush “mandate” – from 3 to 1 million. And we haven’t even yet considered the votes which were SWITCHED electronically from Kerry to Bush.
________________________________________________________________
3.4. What about exit pollster Warren Mitofsky's reputation for
accuracy?
Here is how Mitofsky International's website puts it: "[Mitofsky's] record for accuracy is well known. 'This caution in projecting winners is a Mitofsky trademark, one which has served him well...,' said David W. Moore, the managing editor of the Gallup Poll in his book, The Super Pollsters." http://mitofskyinternational.com/company.htm). In other words, Mitofsky very rarely "called" or predicted the winner incorrectly. (Mitofsky died on September 1, 2006; as of this writing, the page I have cited is still active.)
If Mitofsky's calls were rarely wrong, doesn't this mean that the exit poll data must be highly accurate? No, it doesn't. One reason for Mitofsky's success was that he avoided making calls in close races based on interview data alone. Edison/Mitofsky (the firms that jointly conducted the 2004 exit poll) did not make any incorrect projections in 2004. Perhaps people who believe that the exit polls evince fraud should take Mitofsky's "caution in projecting winners" more seriously.
TIA:
“Mitofsky’s record for accuracy was well-known”. Does this quote refer to the preliminary or the Final exit polls? The Final is always matched to the vote
count. We know that 3% of total votes cast in every election are uncounted and heavily Democratic. So from the get-go, matching to the Final vote is incorrect. And what about votes which are switched? So to argue that Mitofsky is accurate is a double-edged sword. Final exit polls are matched to a fraudulent recorded vote count while preliminary polls are closer to the True vote. But few are aware of the preliminary exit poll timeline, whereas the finals are shown on media sites and in the newspapers.
3.5. Didn't the exit polls indicate that Kerry won by more than the
polls' margin of error?
It depends on what one means by "the exit polls" and "won." As I explained above, there are really 51 different exit polls (if one counts the telephone-only poll in Oregon), one for each state plus D.C. For each state exit poll, we now know the final projection based on interview data alone (called the Call 3 Best Geo), as well as the pollsters' estimate of the uncertainty in each projection. (See the table on pages 21-22 of the exit poll evaluation report.)
The final interview-only projection for Ohio showed Kerry ahead by 6.5 points with a "standard error" of 3.9 points. Using the conventional 95% standard for
"margin of error," the margin of error would be 7.8 points. Using the 99.5% standard that the exit pollsters used as the first (not only) criterion for a "call status," the margin of error was over 10 points. So, Kerry's apparent lead in Ohio was within the margin of error. Kerry led in three other interview-only projections in states that Bush eventually won; all three were also within the margin of error. The election was too close to call based on exit poll data alone.
However, the national sample had about 12,000 respondents, and it gave John Kerry about a three-point margin. If the national exit poll were a random sample, its 95% margin of error on the margin would be about 1.8% -- so Kerry's lead appears to be outside the margin of error. The pollsters did not calculate an uncertainty estimate for the national sample, because they do not figure projections for the popular vote. If they did, probably even Kerry's lead in the national sample would be within the margin of error, at least using the 99.5% standard. (Note that the concept of "margin of error" is widely misunderstood: see point 3.9 below.)
TIA:
You say: “However, the national sample had about 12,000 respondents, and it gave John Kerry about a three-point margin. If the national exit poll were a random sample, its 95% margin of error on the margin would be about 1.8% -- so Kerry's lead appears to be outside the margin of error.” Not true. The NEP had 13047 respondents. The MoE is 0.86% assuming a zero cluster effect. For a 30% cluster effect, it’s 1.12%.
Pollsters always use a 95% confidence level to calculate the MoE (1.96 standard deviations from the mean).
If p = the Bush state poll vote share; 1-p = Kerry’s poll share; n= sample size.
MoE = 1.96 * sqrt (p* (1-p) / n) is the standard deviation.
The probability that the Bush state vote (v) would exceed his exit poll share (p) is given by the Excel function:
Probability = NORMDIST (p, v, MoE/1.96, true).
The probability that the Bush vote discrepancy would exceed the MoE in any given state is .025 (1 in 40)
The Bush vote/poll discrepancy exceeded the MoE in 16 states.
The probability that the MoE would be exceeded in 16 or more states by Bush is given by the Excel function:
Probability = 1- BINOMDIST (15, 50, .025, true).
The probability is 1 in 19 trillion!
3.6. Why are the pollsters' estimates of uncertainty larger than the
ones calculated by TruthIsAll and others?
TruthIsAll sometimes has argued that the exit polls should be treated as simple random samples (like drawing marbles from a hat). In this instance, the margin of error for Ohio, with a reported sample size of 2040, would be about 4.5 points on the margin using the 95% standard. There are two problems with this reasoning. First, the exit polls are not simple random samples; they are limited to a relatively small number of precincts (49 in Ohio), and this limitation increases the statistical uncertainty. Second, the pollsters do not use a textbook formula to calculate their margins of error. Instead, they examine the actual deviations of their exit poll samples from past results in the same precincts. Ideally, all these deviations would be of the same size, in the same direction. (For instance, hypothetically, the poll might show Bush doing 2 points better everywhere in 2004 compared to 2000 -- although a result that neat would be extraordinarily unlikely.) The greater the variability in these deviations, the larger the margin of error.
So, the pollsters' estimates of uncertainty (margins of error) were relatively large because the precinct-level results varied widely, compared with past returns.
This wide variation could be an indicator of problems with the exit poll interviews. (One source of variation is that, as I mentioned, some of the polling places contain multiple precincts. Because the interviewers have no way to tell which voters come from which precincts, they interview voters from all the precincts -- but the interview results are compared with past returns from the "intended" precinct only.)
TIA:
E-M provides cumulative vote totals from 1250 precincts. An individual precinct MoE is not relevant. The Law of Large Numbers still applies. E-M clearly indicate the margin of error for various sample sizes in the NEP Methods statement table.
3.7. Doesn't E/M's own table show that the
margin of error is plus-or-minus 1% for 8000 respondents or more?
That table (on page 2 of the national methods statement) applies to percentages in the tabulations, not to the vote projections.
TIA:
The final exit poll “projections” are forced to match the recorded vote count. And what if the vote count is corrupted? So much for the “projections”. Read the Edison - Mitofsky notes at the bottom of the 12:22am NEP screen shot.
3.8. Doesn't everyone agree that the exit
poll results were outside the margin of error?
Yes: overall, and in many states, the exit poll results differed from the official results by beyond the margin of error, overstating Kerry's performance. (This overstatement is often called red shift, meaning that the "red candidate" Bush did better in the official returns than in the exit polls.) For instance, I noted above that in Ohio, Kerry led in the best interview-only estimate by 6.5 points with a "standard error" of 3.9 points. A 95% confidence interval for the margin is about double the size of the standard error: plus or minus 7.8 points. So Kerry's lead was less than the margin of error, and Ohio was too close to call based on the interview data (even if the pollsters accepted nominal 95% confidence, which they don't). However, since Bush officially won Ohio by 2.1 points, the exit poll discrepancy in Ohio (based on this estimate) was 8.6 points. That discrepancy is beyond the margin of error, at least at a 95% confidence level.
As I mentioned earlier, it turns out that at least the last five presidential exit polls have had overall discrepancies (measured as Within Precinct Error) outside the margin of error, but the 2004 discrepancies were the largest. We don't know how many states were outside the margin of error.
TIA:
Based on the 12:22am exit polls, the Margin of Error was exceeded in 16 states – all in favor of Bush. Based on the E-M provided average state WPE’s, the MoE was exceeded in 29 states.
Once again, your facts are wrong. The 12:22am Ohio exit poll discrepancy from the recorded vote was 3.12% - not 8.6%. Kerry led the 12:22am Ohio Exit Poll by 52.06 - 47.94%. Bush “won” the recorded vote by 51.06-48.94%. Assuming zero cluster effect, the margin of error was 2.21% for 1963 respondents; the exit poll discrepancy was 0.91% beyond the MoE. Assuming a 30% cluster effect, the MoE was 2.87% - still below the 3.12% discrepancy. Bush won the Final Ohio Exit Poll of 2020 respondents by 50.94-49.06%, but the vote shares and weights were forced to match the miscounted Ohio recorded vote. This was just like the final 2pm NEP in which vote shares and weights were changed from the 12:22am timeline to match the miscounted National vote.
But the exit poll matched the results of two independent models. The first was based on 12:22am NEP vote shares with weights adjusted to the Ohio 2000 recorded vote less the national 3.5% mortality rate and 95% turnout assumptions. Kerry was the 51.74-48.26% winner, within 0.32% of the exit poll. The second model was based on uncounted (3%) and switched vote (6.15%) assumptions applied to the recorded vote. Kerry was the 52.6-47.4% winner. A statistical analysis of actual ballots in Ohio’s Cuyahoga County (Cleveland) indicated that 6.15% of Kerry’s votes were switched.
3.9. Aren't survey results far outside the
margin of error prima facie evidence of fraud?
Margins of "error" refer to random sampling error. Most survey researchers would say that results outside the calculated margin of error most likely evince non-sampling error in the survey, such as non-response bias, sampling bias, or measurement error. The statistical "margin of error" assumes an unbiased sample, but competent survey researchers are rarely in a position to assume that they actually have unbiased samples.
Many people are under the mistaken impression that larger surveys are inherently more accurate. Larger surveys do have smaller margins of (sampling) error,
but they are not inherently less vulnerable to non-sampling error. For instance, the 1936 Literary Digest presidential poll had a huge sample size of over 2.2 million respondents (out of 10 million post cards mailed), giving it a nominal margin of error of less than 0.1%. In the poll, Alf Landon held a dominating lead over Franklin Delano Roosevelt, with 57% of the projected vote. In the actual election, Landon got under 37%. The statistical odds against this outcome appear to be larger than anything ever reported by TruthIsAll. But the sample was not random: the mailing lists used to address the post cards tended to favor more prosperous voters, and in 1936 this class bias turned out to be catastrophic.
(People sometimes misinterpret these points as arguing that we should assume that fraud did not occur in 2004 -- whereupon they protest that other eviidence
points to fraud in 2004. But my point here has nothing to do with whether fraud occurred in 2004. It is about whether large survey errors should be interpreted
as evidence of fraud.)
TIA:
Did you really mean to say “vote count” errors and not “survey” errors? The 1936 presidential poll only illustrates that polling was in its infancy. Scientific polling was unheard of. Since then, pollsters have constantly IMPROVED their methodology through sophisticated sampling techniques. Bush election fraud
has given polling a bad name. It’s the institutionalized uncounted and switched electronic votes which are the major cause of the polling discrepancies. But the fraud is not limited to these factors. Voter disenfranchisement works heavily against the Democrats even before the votes are miscounted. If all the votes were counted and everyone eligible was allowed to vote, the Democrats would win every election.
3.10. Which states had the largest exit poll discrepancies? Wasn't it
the battleground states?
No, the largest exit poll discrepancies were generally not in battleground states. Using the "IM WPE" statistic (which averages the WPEs for all precincts in each state, as opposed to other methods that trim extreme values), the largest discrepancies were in Mississippi (-18.5), Connecticut (-16.0), Delaware (-15.9), Vermont (-15.2), and New Hampshire (-14.0). Using the actual interview-only projections, the largest discrepancies were in Vermont (-16.5), Delaware (-16.0), New York (-13.9), New Hampshire (-13.6), and Mississippi (-13.1). Of these six states, only New Hampshire was a battleground state. (It is true, however, that the average discrepancy in the battleground states was larger than the average discrepancy in other states. Edison/Mitofsky report that at the precinct level, the average WPE was -7.9 for precincts in 11 "swing states," and 'only' -6.1 for precincts in other states.)
TIA:
First of all, let’s get the magnitude of the discrepancies right. Your discrepancy is margin-based. That is misleading. For instance, the NY exit poll said that Kerry won by 64-35%. The recorded vote was 58.5- 40.1%, a 4.5% Kerry discrepancy, far below your 13.9% figure. In 2000, Gore won by 60-35% with 5% for Nader/other. According to the National Exit Poll, approximately 71% of Nader 2000 voters voted for Kerry and 21% for Bush. So let’s allocate the Nader vote: 75% to Kerry and 25% to Bush. Assuming Kerry matched Gore’s 61% vote and picked up an additional 3% from returning Nader voters, his true NY vote share was 61+3% = 64%. matching the “pristine WPE-adjusted Exit Poll. It implies that fraud (uncounted and switched votes) cost Kerry 5.5% (64-58.5%).
TruthIsAll FAQ: (4)
Explaining
the Exit Poll Discrepancies
4.1. How did the exit pollsters explain the
discrepancies in 2004?
In their evaluation
report, they stated that the Within Precinct Error was "most likely
due to Kerry voters participating in the exit polls at a higher rate than Bush
voters" (page 3). They further state, "It is difficult to pinpoint
precisely the reasons that, in general, Kerry voters were more likely to
participate in the exit polls than Bush voters. There were certainly
motivational factors that are impossible to quantify, but which led to Kerry
voters being less likely than Bush voters to refuse to take the survey. In
addition there are interactions between respondents and interviewers that can
contribute to differential non-response rates" (page 4). The evaluation
report lists several factors that were associated with differences in WPE,
including interviewer distance from the polls; interviewer age and education;
number of precincts at the polling place; and sampling rate at the polling
place. It does not offer a master theory of the discrepancy.
TIA:
What about the fact that discrepancies are caused by uncounted and miscounted votes? Why don’t the exit pollsters even mention that? Why did they ignore the fact that their own data indicated a slight Bush bias? Why didn’t they provide a rationale for the fact that paper ballot precincts had a low average WPE compared to the touch screens, levers and optical scanners?
4.2. What is the "reluctant Bush responder" (rBr) hypothesis?
First of all, it is a name coined by critics. What the pollsters concluded in the evaluation report was simply that Kerry voters apparently participated at a higher rate. That statement doesn't entail that Bush voters recoiled from the interviewers. It is possible that some Bush voters did steer around interviewers, and/or that some Kerry voters steered toward interviewers, and/or that some interviewers subtly favored Kerry voters over Bush voters. The statements I quoted above do emphasize non-response bias -- i.e., that Kerry voters were less likely to refuse than Bush voters were. Sampling bias by interviewers (approaching more Kerry voters than Bush voters) could also contribute to a difference in participation rates.
The evaluation report never refers to "reluctant Bush responders." In fact, it doesn't venture any specific motivations -- reluctance, eagerness, fear, enthusiasm, defiance, shyness, or anything else. This reserve is appropriate because, after all, the exit pollsters did not interview the non-respondents, and therefore they cannot know specifically why the non-respondents did not respond. (Indeed, even being able to interview the non-respondents might not help very much.)
TIA:
The exit pollsters “concluded” that Kerry voters participated at a higher rate? Where is the evidence to that effect; the exit poll data implies a Bush bias (see Freeman). Could the discrepancy simply be due to Kerry voters outnumbering Bush voters? Once again, the exit pollsters had to conjure up an explanation of why the polls were “wrong” without considering the very real probability of fraud. But since the polls didn’t match the recorded vote, they assumed that the vote count was accurate, so…they adjusted exit poll weights and vote shares to match the vote count.
4.3. Does the participation bias explanation assume that fraud is
unthinkable?
I will present several lines of argument that participation bias accounts for much of the exit poll discrepancy, and that fraud does not. (By the way, concluding that fraud doesn't account for the exit poll results isn't the same as ruling out fraud generally.) The pollsters had several good reasons to suspect from the outset that participation bias was important. First of all, non-response bias -- and other forms of non-sampling error -- are ubiquitous concerns in survey research. Survey researchers do not assume that their data are accurate within the computed "margin of error," because they are well aware of everything that can go wrong. Second, the national exit polls' history of overstating the Democratic vote share in precincts, as described in point 3.2, gives additional reason to consider participation bias likely.
Also, we know that the exit pollsters tested a specific hypothesis about massive fraud: that millions of votes were stolen on electronic voting equipment (Direct Recording Electronic machines and/or optical scanners). In the evaluation report, the pollsters state, "Exit polls do not support the allegations of fraud due to rigging of voting equipment. Our analysis of the difference between the vote count and the exit poll at each polling location in our sample has found no systematic differences for precincts using touch screen and optical scan voting equipment. We say this because these differences are similar to the differences for punch card voting equipment, and less than the difference for mechanical voting equipment." (pages 3-4) That is, the largest exit poll discrepancies on average were in precincts with lever machines. Granted, it might be possible to steal many, many votes on lever machines, but as far as I know, no one predicted or suspected it. Again, below I present other lines of argument that tend to point toward participation bias, and away from fraud, as explaining the exit poll discrepancies.
TIA:
There was no difference in WPE between touch-screens and optical scanners? They are really reaching with that one. That only means that both machines were rigged. Optical scanners results are fed into central tabulators, just like the touch screens. Were the central tabulators rigged? And what was the WPE in paper ballot precincts? How does it compare to the machines?
4.4. Don't the high completion rates in "Bush strongholds"
disprove the rBr or bias hypothesis?
No, and I'm amazed how much mental effort has gone into elaborating this very weak argument. Here is the argument: The reported completion rate in precincts that voted 80%+ for Bush ("Bush strongholds") was 56%. The reported completion rate in precincts that voted 80%+ for Kerry was only 53%.
So how can anyone claim that Kerry voters had a higher completion rate than Bush voters? Doesn't it appear that Bush voters had a higher completion rate?
One can work a lot of math into the argument, but basically the math is irrelevant. It seems that either one finds this argument compelling or one doesn't, regardless of the numbers attached. As a matter of logic, the argument has no force.
It is perfectly possible -- even likely -- that both Kerry voters and Bush voters completed the exit polls at a somewhat higher rate in "Bush strongholds" than their counterparts in "Kerry strongholds." The evaluation report suggests (on page 31) that "hypothetical completion rates of 56% among Kerry voters and 50% among Bush voters overall would account for the entire Within Precinct Error that we observed in 2004," but no one believes that those rates could apply everywhere. Indeed, the reported state-level completion rates ranged from 42.7% in South Dakota to 66.7% in Tennessee (pages 54-55) -- so we can be pretty sure that that both Kerry and Bush voters in Tennessee participated at a higher rate than their counterparts in South Dakota! Since Kerry did better in Tennessee than in South Dakota, can we conclude that Kerry voters had a higher completion rate overall? Absolutely not -- and if even the suggestion seems strange to you, then the "stronghold" argument should seem strange for the same reason. Comparing the overall completion rates in "Bush strongholds" and "Kerry strongholds" simply cannot tell us whether Kerry or Bush voters participated at a higher rate within either -- much less nationwide.
TIA:
Once again, you confound the basics. A Linear regression analysis of state exit poll response vs. poll and recorded/vote share indicates this relationship: exit poll response rates decreased going from Bush states to Kerry states, while Kerry’s poll and vote shares increased. To you, the regression analysis is irrelevant, but it disproves your case. The regression tells us that non-responders were more likely to be Kerry voters.
4.5. How can you explain the impossible changes in the national exit
poll results after midnight?
First to explain the "problem": The tabulation of the national exit poll at 7:33 pm on election night, based on 11,027 respondents, indicated that Kerry had a 3-point edge. The tabulation was later updated; a version time-stamped 12:22 am (just after midnight) showed 13,047 respondents, and one can infer that Kerry still leads by 3 points. The final tabulation, still available on CNN.com, reports 13,660 respondents and shows Bush ahead by approximately 3 points, as in the official returns.
At times TruthIsAll and others have suggested that these results are "impossible" in the sense that an additional 613 respondents cannot account for the shift from Kerry to Bush. Indeed they cannot. As I explained above, the tabulations are periodically updated in line with the projections -- and, therefore, in line with the official returns. The tabulation would have been updated even if there had been no additional respondents. So the whole idea of "impossible changes" is a red herring.
TIA:
You are creating the red herring by failing to mention that the FINAL EXIT POLL WAS FORCED TO MATCH THE VOTE COUNT – COME HELL OR HIGH WATER. THE FACT THAT THE “HOW VOTED IN 2000” WEIGHTS WERE MATHEMATICALLY IMPOSSIBLE, AND CORRESPONDING VOTE SHARES NOT PLAUSIBLE, WAS NEVER A CONSIDERATION.
Interested readers should refer to the DU Game thread in which you were finally forced to provide a plausible rationale for the Bush “mandate”. Unfortunately, you only succeeded in proving that there was none. Because you had to finally agreed that the 43/37 weightings were impossible, you had to force Bush vote shares much higher than they were in Final Exit Poll where they were already inflated to match the votes. So you compounded the fakery by hypothesizing that 14.6% of Gore voters defected to Bush in 2004. The 12:22am National Exit Poll said that 8% did – a 6.6% discrepancy. The margin of error assuming a 90/10 vote split for 3200 respondents is 1.7%.
4.6. Why were the tabulations forced to
match the official returns?
If the official returns are more accurate than the exit polls -- and bear in mind that exit polls have been (presumably) wrong in the past -- then weighting to the official returns should, generally, provide more accurate tabulations. Weighting results to match known characteristics of the population (in this case, the voters) is called "post-stratification," and it is standard statistical practice. Of course, if the exit polls were more accurate than the official returns, then weighting to the official returns would provide less accurate tabulations. But even if one believes that they were, I see no reason to conclude that the exit pollsters thought so.
TIA:
Exit polls were presumably wrong in the past? Or was it the vote count? Could the “errors” have been a result of uncounted and miscounted votes? If demographic weightings are designed to match the population, then why were MATHEMATICALLY IMPOSSIBLE 43% Bush / 37% Gore weights used in the Final Exit Poll? Post-stratification or post-misinformation? You see no reason to believe that the exit pollsters were aware of the significance of the demographic impossibility? They HAD to match the vote count, so they were well aware. And so they went along with the Big Scam.
4.7. Wasn't there an effort to cover up the exit poll discrepancies?
Not that I can see. The original tabulations were online for many hours, at the hardly obscure CNN.com. Exit pollsters commented on the results for reporters, and Warren Mitofsky appeared on PBS's NewsHour three days after the election. The exit poll discrepancies were not secret.
TIA:
The preliminary exit polls notes say that they were “not for public viewing”. Without the 12:22am download from Jonathan Simon, we would never know the true exit poll results.
4.8. Is there any specific reason to think that the exit poll
discrepancies don't point to fraud?
There are several. One of my favorites is based on TruthIsAll's observation: "Based on the pre-election polls: 41 out of 51 states (incl DC) deviated to Bush. Based on the exit polls: 43 out of 51 deviated to Bush." As I discussed in Point 1, TruthIsAll's analysis of the pre-election polls is idiosyncratic: for instance, he estimated an 85% probability that Kerry would win Ohio, although only one poll out of the last ten put Kerry ahead there. Nevertheless, if the two sets of deviations tended to coincide -- if, for instance, Bush tended to do much better than the pre-election polls in the same states where he did much better than
the exit polls -- then one might judge that both sets of results tended to point to fraud. (Note: this argument assumes that the extent of fraud varied from state
to state, and that the differences in exit poll discrepancies partly reflect differences in fraud.)
Interestingly, as I show here, the relationship between these two deviations (official vs. pre-election polls, and official vs. exit polls) is flat to negative. That is, if anything, exit poll "red shift" overstating Kerry's support was largest in states where he did better than predicted in pre-election polls, or at least no worse. These results are calculated using TruthIsAll's own pre-election poll measures! While many people (including TruthIsAll) have asserted that pre-election polls may be biased, no one has explained why some state polls would be more biased than others, in a pattern that would cancel out the evidence of fraud. The lack of a positive correlation between these two deviations isn't strong evidence against fraud in any particular state, but it appreciably weakens the case that the exit polls point to fraud around the country. (A more detailed exploration of the data is here.)
Another strong reason to think that the exit poll discrepancies do not point to fraud involves the "swing" statistic. "Swing" is the percentage change in Bush's performance from 2000 to 2004, in each exit poll precinct. Swing tends to be fairly small, generally within a range of plus-or-minus 10 points. Generally, if an exit poll "red shift" of (say) 30 points tended to indicate 30-point fraud favoring Bush, then one would expect swing favoring Bush to be larger in such precincts than in precincts where the exit polls closely matched the official returns or even overstated Bush's support. But in fact, as I show here, there is essentially no correlation whatsoever between "swing" and "red shift." This result is hard to reconcile with fraud in the exit poll precincts, unless the fraud was precisely targeted in precincts where Bush would otherwise have done worse than in 2000.
TIA:
The naysayer swing vs. red-shift scatter
chart flat regression line is the rationale for claiming that the
exit poll discrepancies had little effect and therefore fraud was unlikely. But
it is not supported by the mathematics; there are an infinite number of
scenarios which would invalidate the premise. And you are comparing apples
to oranges; you did not adjust the 2000 recorded vote. According to the 2004
National Exit Poll, Kerry won 71% of returning Nader voters compared to 21% for
Bush. A similar split would have increased Gore’s margin by
1.4m. Assuming that 75% of approximately 3 million uncounted votes were
for Gore, his margin increases by another 1.5mm. When added to his recorded
540,000 vote majority, Gore’s adjusted margin becomes 3.4m.
And we have not yet considered the effects of vote-switching. Thanks to Ohio, we know a lot more about vote-switching than we did in 2000. It’s very likely that Gore votes were switched to Bush. If 3% (1.5 million) were switched, then his final adjusted margin is 6.4 million: 3m switched + 1.5m uncounted + 1.4m Nader + 0.54m recorded.
You never normalized the 2-party state vote shares in calculating “swing”. Assuming 3% vote- switching from Gore to Bush, swing exceeded red-shift in 43 states. Average adjusted state swing was 4.0%; average red-shift, 1.5%. Weighted average adjusted swing was 3.74%; weighted average red-shift, 1.41%. Assuming zero vote-switching in 2000, adjusted swing exceeded red-shift in 32 states. Average adjusted swing was 2.58%; weighted average swing was 2.39%.
An adjusted
swing vs. redshift bar graph displays the deviations.
Another scatter
chart shows that adjusted swing exceeded 4% in 18 states while
red-shift exceeded 4% in only 2 states. The naysayer swing vs. red-shift
argument is just another ruse meant to divert, confuse and mislead.
The recorded 2000 vote needs to be adjusted by these factors:
1) Third-party (Nader) share of 2000 voters:
According to the National Exit Poll, Kerry won returning Nader 2000 voters by 71-21% over Bush. We need to revise the 2000 vote totals accordingly by allocating the Nader vote to Gore and Bush in the same proportion.
2) Uncounted votes:
According to the 2004 Election Census, there were 125.7mm total votes cast but only 122.3mm were recorded; 3.4mm (2.74%) were uncounted. In 2000, there were 104.7mm votes recorded. Assuming that the 2000 uncounted vote rate was equal to the 2004 rate, then 107.7mm total votes were cast and 3.0mm were uncounted. Since the majority of uncounted ballots are found in Democratic minority districts, a fair assumption is that 75% of these uncounted votes were for Gore. There were 180,000 spoiled ballots (under and over votes) in Florida.
3) Switched votes:
The True Vote Model base case scenario indicates that 6.8% of total votes cast for Kerry were switched to Bush. An exhaustive review of the ballots in Ohio's Cuyahoga County determined that 6.15% of Kerry’s votes were switched. For this analysis, the best case assumption is that 3.0% of Gore votes were switched.
4.9. Is there any specific reason to believe that participation bias does
explain the discrepancies?
Yes, beyond the facts that participation bias is common, that past exit polls have overstated Democratic performance, and that the exit poll discrepancies
don't correlate with pre-election poll discrepancies, "swing" from 2000, or electronic voting machine use, there is also some evidence indicating participation
bias in 2004. Specifically, some patterns in the exit poll discrepancies fit well with participation bias.
For instance, "red shift" is much greater in precincts where interviewers stood further from the polling place. The average WPE increases from -5.3 where interviewers stood inside the polling place to -12.3 where interviewers stood more than 100 feet away (evaluation report, p. 37). This result is consistent with the conjecture that Kerry voters were more eager to participate in the exit polls than Bush voters were -- and this disparity was more manifest in polling places where it was easier to avoid the interviewers entirely. The recorded completion rate falls from 59% where interviewers stood inside the polling place to 43% where they were more than 100 feet away; both refusal and "miss" rates go up. At that distance, the "random sample"
becomes largely voluntary.
(Some people have objected that interviewer distance cannot account for the error in the poll because the WPE is so large even when interviewers stood inside the polling place. This misses the point. Edison/Mitofsky never asserted that interviewer distance accounts for non-response bias. If Bush voters and Kerry voters are equally willing to participate in the survey, then distance should not matter. But if they differ overall in their willingness to be interviewed, then it makes sense that greater distance would accentuate the difference.)
"Red shift" is also much larger at polling places with high interviewing rates -- that is, where interviewers were supposed to skip more voters between interviews (evaluation report, p. 36). Interestingly, however, the reported completion rates were not lower at these polling places. So it appears hat interviewers at these polling places sometimes (probably unawares) ended up interviewing Kerry voters when they "should have" interviewed Bush voters. Indeed, there is anecdotal evidence that some interviewers did not rigorously enforce these interviewing rates, but rather sometimes interviewed voters who seemed more cooperative.
Red shift also varies with certain interviewer characteristics, such as age and education (evaluation report, pp. 43-45); it appears that interviewers who were college students were especially prone to biased results. Voters may have tended to assume that college students would be Kerry voters, and gravitate toward
or away from them accordingly.
TIA:
Red-shift or red-herring? Check this graph of Kerry State Vote vs Exit Poll vs. Completion Rate. As we move from high completion rate states to low completion, Kerry’s vote and poll shares increase. This is a graphic contradiction of the Bush voter non-response theory.
________________________________________________________________
4.10. Aren't you offering a lot of unproven speculation?
You could call it that, or you could call it scientific reasoning on the basis of incomplete evidence. William Jennings Bryan once said that "Darwinism... is only a guess and was never anything more" -- but Bryan made no systematic attempt to consider how well "Darwinism" explained a broad variety of evidence, compared with the explanatory power of alternative theories. Attributing outcomes to the unfathomable will of God "explains" them by eschewing any attempt to understand them. In practice, attributing exit poll outcomes to fraud often suffers the same limitation. People who insist that the exit polls evince fraud have made little or no attempt to explain, for instance, why the exit poll discrepancies vary with interviewer age and education, or why the exit polls point to double-digit fraud in New York, a lever-machine state where Bush had no chance of winning, and where the official result is very close to pre-election predictions.
Given all the respects in which participation bias fits the data, and in which massive fraud does not, it is hard to understand how anyone can argue straight-faced that participation bias is the more speculative theory.
TIA:
The exit polls point to double-digit fraud in NY? That’s misleading. According to the exit poll, Kerry won NY by 63-36%. The recorded vote was 58.5- 40.1%, a 4.5% discrepancy. In 2000, Gore won NY by 61-35% with 4% of the vote going to Nader. According to the NEP, 71% of Nader 2000 voters switched to Kerry in 2004; just 21% voted for Bush, a better than 3-1 ratio. Let’s assume that Kerry matched Gore’s 61% and won 75% of Nader 2000 voters. Then Kerry won by 63-36%, matching the Exit Poll. And yes, there is evidence that Lever machines are vulnerable to miscounts at the voting machine and central tabulator.
4.11. Are you saying that the exit polls disprove fraud?
No. As noted earlier, many forms of fraud may be compatible with the exit poll results. However, it seems hard to reconcile massive, widespread fraud – on the order of many millions of miscounted votes -- with the exit poll results unless one begins by discounting the details of the exit poll results. By and large, the exit polls point to fraud in bizarre places (Delaware?) and sizes (how likely is it that Kerry would have won New Hampshire by double digits – or New York by over 30 points?). One can explain away some of these results individually, but the entire pattern simply isn't very consistent with massive, widespread fraud.
TIA:
How likely is it that Kerry won NY by over 30 points? As we have shown, Gore won NY by 60-35% over Bush, with the remaining 5% to Nader/other. It’s very conceivable that Kerry at least matched Gore and won 75% of the Nader vote to end up with a 64-35% margin.
4.12. Are you saying that you are sure Bush didn't steal the election?
No, depending on what one means by "steal." In particular, I think it is at least possible that some combination of vote suppression (purges, long lines, intimidation, etc.) and uncounted votes cost John Kerry a victory in Ohio, and therefore in the election. (Obviously "uncounted votes" can be regarded as a form of vote suppression.) I doubt it, but I am not arguing against it here. Many forms of vote suppression would not even affect the exit poll results, if they discouraged people from coming to the polls in the first place. It is easier to believe that Kerry "could have" won Ohio than to believe that he should have won by over 6 points despite vote suppression, as the exit poll indicates.
Please note: I think that efforts to prevent people from voting, or to prevent their votes from being counted, are despicable regardless of whether they affect the outcome.
TIA:
Please note: switching votes electronically from Kerry to Bush is also despicable.
Go here for an analysis of Uncounted and Switched Votes
TruthIsAll FAQ: (5)
5.1. Why has TruthIsAll called the "2000 presidential
vote" question the clincher?
About 3200 exit poll respondents around the country were asked who they voted for in 2000. The weighted results look like this (screen shot excerpted from cnn.com): http://www.geocities.com/electionmodel/TruthIsAllFAQimage002.jpg
TIA emphasizes two aspects of this table. First, he notes, it is impossible that 43% of the 2004 electorate voted for Bush in 2000.
That would be over 52 million Bush voters, whereas Bush only got about 50.5 million votes in 2000. (Some of those voters must have died, or not voted for other reasons.) Ergo, it is necessary to apply "mathematically impossible weights" to the exit poll data in order to match the official returns, and so Kerry must actually have won. I will call this the "impossible 43%" argument.
Second, he argues: if the previous election's Gore voters and Bush voters turned out in roughly equal numbers in 2004, and if they 'defected' in 2004 to the other party at roughly equal rates, as in the table (10% of Gore voters to Bush, 9% of Bush 2000 voters to Kerry), and if Kerry won among the "Other" voters (mostly Nader voters) and those who did not vote, then Kerry must have won.
The second argument is especially appealing to many people who regarded the 2004 election as in some sense a replay of the 2000 election. It seems very reasonable to say that if Kerry could just battle to a stalemate among the previous election's Gore and Bush voters, the Nader voters and new voters were bound to put Kerry over the top.
5.2. What is wrong with the
"impossible 43%" argument?
It assumes that exit poll respondents accurately report whom they voted for in the previous election. In reality, exit poll respondents seem to have overstated their support for the previous winner in every exit poll for which I could obtain data, ten in all, going back to 1976. (Yes, even Richard Nixon, despite resigning in disgrace, garnered a higher "recalled vote" percentage in 1976 than his official vote share in 1972!) In fact, TIA's first argument could just as well be applied to 2000: in that year, proportionately more exit poll respondents recalled having voted for Clinton in 1996 than could actually have done so.
Lots of other evidence indicates that people often report having voted for the previous winner although they didn't. Perhaps most telling is an (American) National Election Study (NES) "panel" in which people were interviewed soon after the 2000 election, and then reinterviewed in 2004. Of the people who said in 2000 that they had voted for Gore, about 7% said in 2004 that actually they had voted for Bush in 2000. (A smaller proportion, under 2%, similarly "switched" from Bush to Gore.) Also, among those who said in 2000 that they hadn't voted for president, about 36% said in 2004 that they had voted and those respondents reported voting for Bush by about 2 to 1. For several reasons, these percentages cannot be directly applied to the exit polls.Nevertheless, the panel does provide direct evidence of people misreporting their past votes, in Bush's favor.
So, while it is impossible that 43% of voters in 2004 actually voted for Bush in 2000, it is not at all impossible that 43% of voters would report having voted for Bush in 2000. In fact, this overstatement of past support is consistent with past exit poll results; it would be surprising if the percentage were not "too high."
TIA:
Ah, the “false recall” argument that people often report voting for the previous winner. But in 2000 GORE won by 540,000 votes in the official count. You cite the 2000 exit poll in which 45.5% respondents (48.1 of 104.74m) said they voted for Clinton in 1996. His recorded vote was 45.6m. How do we account for the 2.5m discrepancy?
Once again, you assume that Clinton’s 45.6m recorded vote was correct. Remember the uncounted votes? We need to compute Clinton’s true 1996 vote. The recorded vote was 91.3 million. If 3% of the total votes cast were uncounted, then 94.1m votes were cast; 2.8mm were uncounted. Assuming 2.1m (75%) of the uncounted votes Clinton’s, his true vote was 47.7m , a 0.40mm deviation (0.83%) from the 48.1mm exit poll. That’s well within the 1.0% MoE.
In any case, it doesn’t matter what 2004 exit poll respondents said as to how they voted in 2000. The maximum number of returning 2000 voters in 2004 is limited to those who were still living in 2004. You have agreed to this simple fact, so false recall is a non-issue. It comes down to this: where did Bush find 16 million new votes? Assuming that 95% (46.5 of 48.7) million Bush 2000 voters also voted in 2004, he needed 62-46.2= 15.8 million new voters to match his 2004 recorded vote!
The second argument assumes that Kerry did about as well among Bush 2000 voters as Bush did among Gore 2000 voters. Superficially, the exit poll table supports this assumption. And many Democrats cannot believe that any appreciable number of Gore 2000 voters -- presumably outraged by the Supreme Court's intervention, not to mention countless Bush actions -- would actually vote for Bush in 2004.
But the problem with the first argument is crucial to understanding the problem with the second: one cannot assume that people have reported their past votes correctly. Among the people who reported having voted for Gore, only about 10% "defected" to Bush. But what about the people who actually voted for Gore in 2000 but reported having voted for Bush? One would expect that in 2004, such people would be more likely to vote for Bush than for Kerry. Indeed, in the 2000-2004 NES panel, this group favored Bush over Kerry by greater than a 5-to-2 ratio. Thus, the 10% Gore-to-Bush "defection rate" is understated, because it excludes people who actually voted for Gore in 2000 (but misreported this fact) and who voted for Bush in 2004.
By similar logic (also supported by evidence from the NES panel), the 9% "defection rate" of Bush 2000 voters to Kerry is somewhat overstated. It includes some people who actually voted for Gore, but reported having voting for Bush (in 2000) -- and then voted for Kerry! This findinng may seem strange: one might imagine that people who misreported having voted for Bush in 2000 would invariably support Bush in 2004. But, as I just noted, this is observably not the case in the NES panel. Some people seem simply to forget having voted for Al Gore in 2000, but nonetheless end up (apparently) voting for Kerry.
(Kerry's margin among "new voters," i.e., people who did not vote in 2000, is probably also overstated, because some actual new voters who voted for Bush will have reported voting for Bush in 2000 as well. Of course I am leaving out several permutations of actual and reported votes!)
While there is no way of knowing the true defection rates, I estimate that the data are consistent with a Bush-to-Kerry defection rate of about 7-8% and a ore-to-Bush defection rate of about 14%. For a more extensive discussion, see my paper, "Too Many Bush Voters?"
This argument is consistent with the fact that the pre-election national polls generally gave Bush a slight lead. Kerry was widely expected to do better than Bush among new voters -- so if these new voters were going to break a stalemate in Kerry's favor, they should have done so in the polls before the election. (Many people tend to discount this point because they assume that the pre-election polls somehow missed these new voters -- perhaps because the pollsters underestimated turnout and/or because many of the new voters were cell-phone-only users. I address both these arguments above.)
TIA:
Wow! That can only be described as a convoluted, faith-based set of hyper-hypotheticals. And this is where we part company. For one to believe that over 7 million Democratic Gore voters would defect and vote for the most incompetent, dishonest pRresident in history (with a 48.5% approval rating) who STOLE the 2000 election from them, is really a stretch – a perfect example of faith-based naysayer fundamentalism.
5.4. But... but... why would 14% of Gore
voters vote for Bush??
If one thinks of "Gore voters" as people who strongly supported Gore and resented the Supreme Court ruling that halted the Florida recount, then the result makes no sense. For that matter, if one thinks of "Gore voters" in that way, it makes no sense that they would forget (or at any rate not report) having voted for Gore. Nevertheless, the NES panel evidence indicates that many did. (Of course, the figure may not be as high as 14% -- although it could conceivably be even higher.)
One has to consider that many Americans who vote in presidential elections do not follow politics very closely. Some will unenthusiastically opt for one candidate or the other late in the process; if they voted for the candidate who ultimately lost, they may literally forget him. (Mike Dukakis, the 1988 Democratic nominee, seems to have been singularly subject to this fate. Dukakis lost the election by under 8 points, but in the 1993 General Social Survey, he retrospectively lost by 41 points.) Considerable research indicates that incumbent presidents tend to have an inherent advantage, which might be characterized as a "devil-you-know factor." Ray Fair estimates that from 1916 through 2000, an incumbent running for reelection had about a 3-point boost in expected vote share, although this advantage seems to have declined since 1960.
Some observers argue that George W. Bush had a particular advantage in 2004 given his standing as a wartime president. Americans are said to be reluctant to vote against incumbents in wartime. I am ambivalent about this argument, but we do not need to arrive at a sound-bite explanation of why an appreciable minority of Gore voters defected to Bush in order to conclude that they did.
TIA:
You sure as hell do need a sound-bite explanation of why so many Gore voters defected to Bush; all evidence indicates the opposite. NES, NES, NES. (N)ot (E)xactly (S)cientific. That’s the essence of your case.
Take a look at the True Vote Model
TruthIsAll FAQ:
M.1. What about the reports of flipped
votes on touch screens in 2004?
Many people reported difficulty voting on electronic voting machines (DREs), in particular, that attempts to vote for one candidate initially registered as votes for another. The Election Incident Reporting System (EIRS), connected to the "OUR-VOTE" telephone hotline, recorded close to 100 such incidents. TruthIsAll has asserted that 86 out of 88 reports of electronic vote-flipping favored Bush. He cites the odds of this imbalance as 1 in 79,010,724,999,066,700,000,000. Another observer reports that actually,
87 out of 94 EIRS reports favored Bush. The odds of this imbalance are, of course, still prohibitive -- on the order of 500 trillion to 1 against.
Is this compelling evidence of a stolen election? No, it really isn't at all -- because the actual election returns from DREs on crucial states don't support election theft concentrated upon DREs. In Florida, some analysts who looked for evidence of vote-switching on DREs concluded that the optical-scan results were actually more suspicious. (Of course, it is possible that both could be hacked.) In Ohio, most Ohioans voted on punch cards. Walter Mebane and Michael Herron, in an analysis of the Ohio returns for the Democratic National Committee's Voting Rights Institute, found no statistical evidence implicating either DREs or optical scanners in vote-switching. As noted earlier, the exit polls also fail to support the hypothesis of massive vote-switching on DREs -- unless one is prepared to stipulate even more massive vote-switching on lever machines.
One also wonders about the inherent plausibility of visible vote-switching as a means of widespread election fraud. If someone had the insider access to force visible vote-switching, wouldn't s/he also have the ability to engineer invisible vote-switching? This question may have a compelling answer, but I haven't seen one yet. (On the other hand, the mere fact that a fraud mechanism seems suboptimal doesn't prove that it wasn't used.)
While TIA's reported odds are breathtaking, they do not interpret themselves, for two reasons. First of all, the odds calculation depends on the underlying assumption that Bush-to-Kerry and Kerry-to-Bush switches were equally likely to be reported to EIRS. Actually, the EIRS hotline was widely publicized in liberal-leaning media sources, and the election protection volunteers who promoted the hotline were concentrated in heavily Democratic precincts. Given these facts, asell as pre-election concerns about Diebold and DREs, one would expect Kerry-to-Bush switches to be reported at a higher rate. But how much higher? There is simply no way of knowing. Certainly the imbalance of reports is suspicious.
The second problem is that these 88 or 94 reports are not a sample, but rather the universe of all EIRS vote-switching reports. (Presumably some additional vote-switching reports are not logged in the EIRS.) Moreover, most of these reports assert that the voter was ultimately able successfully to vote for the correct candidate. So, what is the likely frequency of vote-switching implied by the data? People who leap from fewer than 100 problem reports to multi-million-vote conclusions obviously are not following the data alone. Are these reports the tip of the proverbial iceberg, representing huge numbers of vote switches not detected or not reported? Again, there is simply no way of knowing. However, again, statistical analysis of the election returns generally indicates, probably not. Surely there were more problems than reported in the EIRS, and some of the problems may reflect tampering, but they seem to have had little impact on the outcome.
There is solid evidence of excessive "undervotes" on pushbutton DREs in New Mexico, disproportionately concentrated in Democratic precincts and presumably costing Kerry many net votes. The magnitude of this effect is unclear, but it possibly may have been large enough to reverse the outcome in New Mexico. The problem has been attributed in part to the implementation of the straight-ticket option on these machines: many voters may have inadvertently voided their presidential votes by initially selecting a straight ticket, then voting for another party's candidate elsewhere on the ballot.
M.2. Did the 2006 exit polls manifest
"red shift" compared with official returns?
Yes. For instance, the initial national House tabulation -- posted a bit after 7 PM Eastern time on election night -- indicates that Democratic candidates had a net margin of about 11.3 points over Republican candidates. The actual margin was probably about 7 points, depending on how uncontested races are handled.
TIA:
What is your justification for stating that “the actual margin was
probably about 7 points, depending on how uncontested races are handled”?
M.3. Do pre-election "generic"
House polls in 2006 match the initial exit poll returns?
Not really. A "generic" poll is one that asks respondents whether they would vote for (in Gallup's words) "the Democratic Party's candidate or the Republican Party's candidate," rather than naming specific candidates. (Typically the order is rotated: half of respondents are asked about Republicans first.) Generic polls are common because of the logistical complexity of (1) trying to match randomly dialed telephone numbers to congressional districts and (2) prompting the interviewers to pronounce the names of the candidates in each of the 435 districts -- for an average of perhaps two or three interviews per district. Nevertheless, in real life, voters choose between named candidates, not generic ones, and this distinction makes a difference. Joseph Bafumi and colleagues state (PDF page 6):
We know that they [the generic polls] perform poorly as point estimates. For instance, an 18-point Democrat lead from early in an election year most likely will translate into a far smaller vote lead on Election Day. However, regression equations accounting for the vote in terms of the generic vote do predict well, as they properly discount the exaggerated sizes of the generic poll leads.
What it means to "predict well" is a matter of perspective: Bafumi et al. report (PDF p. 2) that midterm House vote share predictions based on generic polls over the last 30 days have an estimated margin of error of plus-or-minus 3.7 points. Vote margin predictions therefore have a margin of error of more than 7 points.
The 2006 generic poll results varied widely. Seven polls conducted in the last week before the election agreed that the Democrats were ahead, but the estimated Democratic margin ranged from 4 to 20 points. The average margin in these polls was about 11.6 points. Using these polls in Bafumi et al.'s regression equation, we can estimate that the Democrats would win by about 8 points, with (as I mentioned) roughly a 7-point margin of error. (Bafumi et al., using generic polls through "early October 24," estimated that the Democrats would win by about 10 points based on an average margin of over 15 points in the polls to that date.)
David Moore and Lydia Saad noted in 1997 that the final generic Gallup poll has generally been more accurate than the generic-poll averages. They reported that from 1954 through 1990, the final Gallup poll had an average error of under 1.3 points on vote share (about 2.5 points on margin). (The 1994 through 2002 Gallup results were also close, on average, to the official totals, although the 1998 poll overstated the Democratic vote share by 2.5 points -- still within the margin of error.) The final Gallup poll in 2006 projected a 7-point Democratic margin.
Given statistical margins of error, these generic poll results could be consistent with a Democratic vote margin of 7 points or of 11-plus points -- although a 7-point margin is somewhat likelier than an 11-point margin. But we do not have to settle for the generic poll results. We can examine pre-election polls in particular House races. As Mark Blumenthal has demonstrated, overall these pre-election polls come very close to the actual returns. Thus, neither generic nor race-specific pre-election polls support the conjecture of widespread miscount in House races. (In Senate and gubernatorial races, Blumenthal showed earlier, Democratic candidates on average did as well as or better than in pre-election polls.)
TIA: Not Really? Let’s look at the evidence.
This analysis shows how the Final Exit poll weights were manipulated to cut the Democratic margin in half.
This analysis shows that the 120 Generic Poll Trend matched the7:07pm Exit Poll.
This is an analysis of uncounted and switched votes.
This analysis shows that the 120 Generic Poll Trend matched the 10 Final Generic Polls.
This is the final of three pre-election articles I wrote with Michael Collins (autorank) and Alistair Thompson of SCOOP. The purpose was to quantify the risk of fraud in the 2006 Mid-terms. The analysis forecast that the Democrats would gain control of the House and Senate. It also indicated the House seats and Senate races where fraud was most likely to occur.
M.4. What about the massive undervotes in
Sarasota County, Florida (C.D. 13)?
Without getting into the specifics, the short answer is: I think that if voters had been able to cast their votes as they intended, the Democratic candidate Christine Jennings would have won the House race in Florida's 13th Congressional District (FL-13) by thousands of votes, instead of losing by under 400. I have seen no evidence that the events in FL-13 shed light on outcomes in any other Congressional race.
TIA:
Are you implying that FL-13 was an isolated case of missing and/or switched votes? And that there is no evidence of miscounting in the other 434 districts? Mark, you’re in a constant state of denial. What about Ohio? There are quite a few articles which document the fraud.
This Pew 2006 Election Analysis of voting “glitches”, “snafus” and “hiccups” describes the chaos state by state.
This Survey of
Pollworker and Voter Experience Reveals Pervasive and Recurrent Failures among
Computerized Voting Systems.
An extensive analysis of ballots cast in the Ohio 2006 Senate Race by Richard Hayes Phillips, Ph.D. proved that the recorded vote count was imposssible.
ABSTRACT: In the November 7, 2006 election in Ohio there were 350,669 more ballots cast than the number of votes counted for United States Senator. In 16 counties there were 268,987 uncounted votes, or 19.46% of ballots cast, compared to 82,957, or 2.99%, in 71 other counties. Cuyahoga County alone accounted for 148,928 uncounted votes, or 26.48% of ballots cast in the county, and 42.47% of the statewide total of uncounted ballots. In Marion County there were 1,275 more votes counted for United States Senator than the reported number of ballots cast, which is an impossibility.
If the rate of uncounted ballots in the 17 suspect counties had been about 3%, as was the case elsewhere in the state, there would have been about 42,000 uncounted ballots instead of 269,000. This indicates that 227,000 votes may have been lost by the touch screen voting machines, which were utilized in all 17 of the suspect counties.
________________________________________________________________
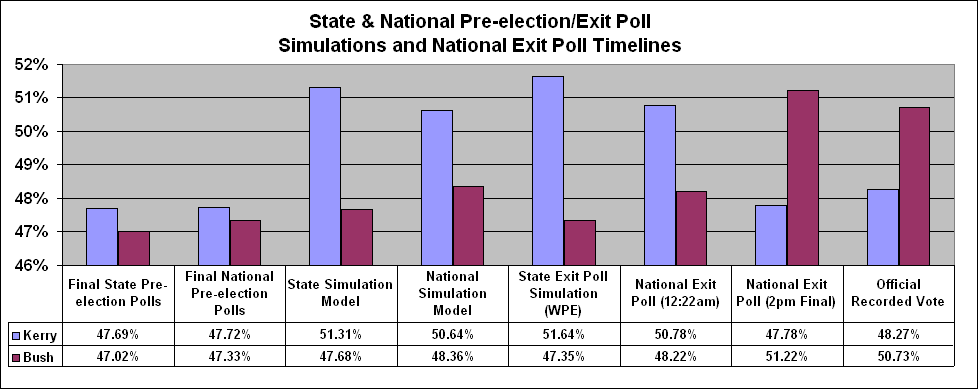
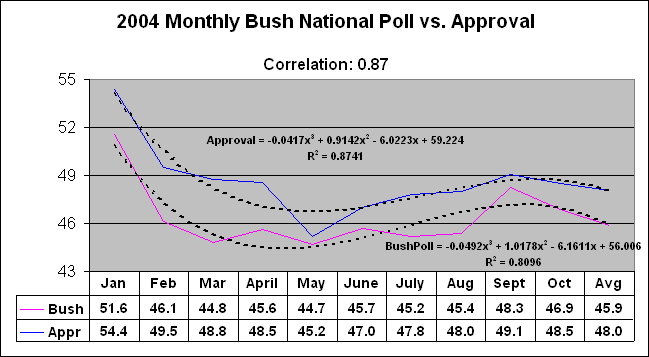
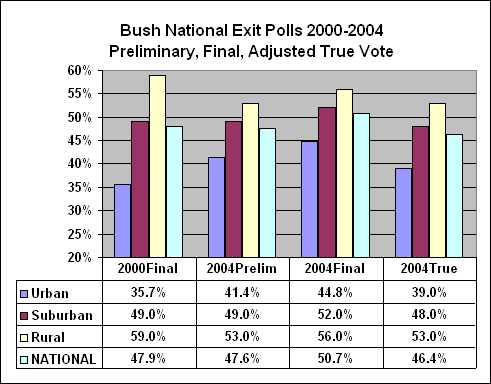
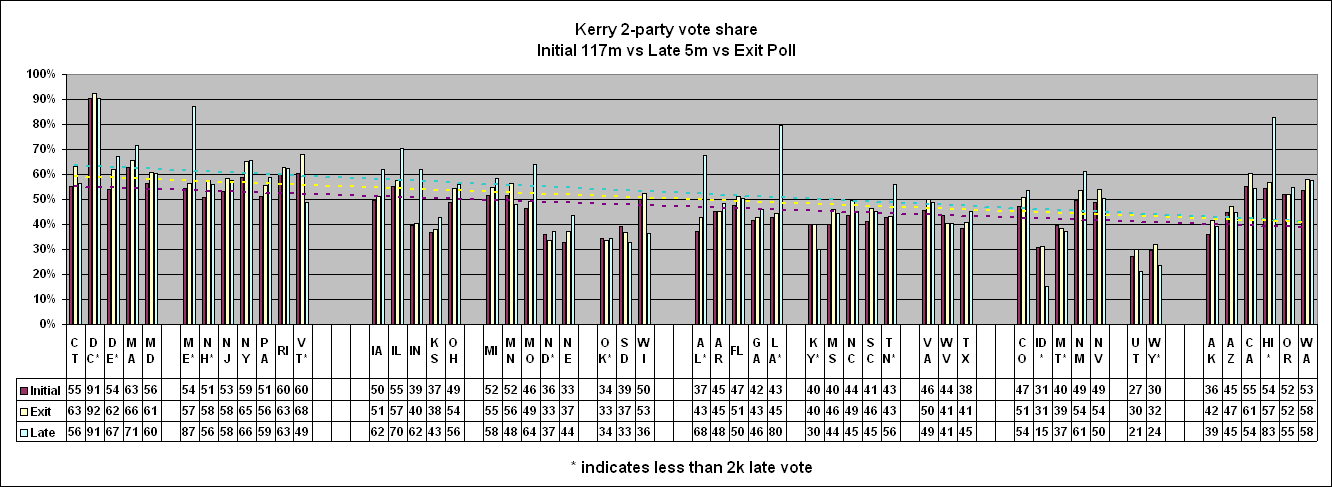
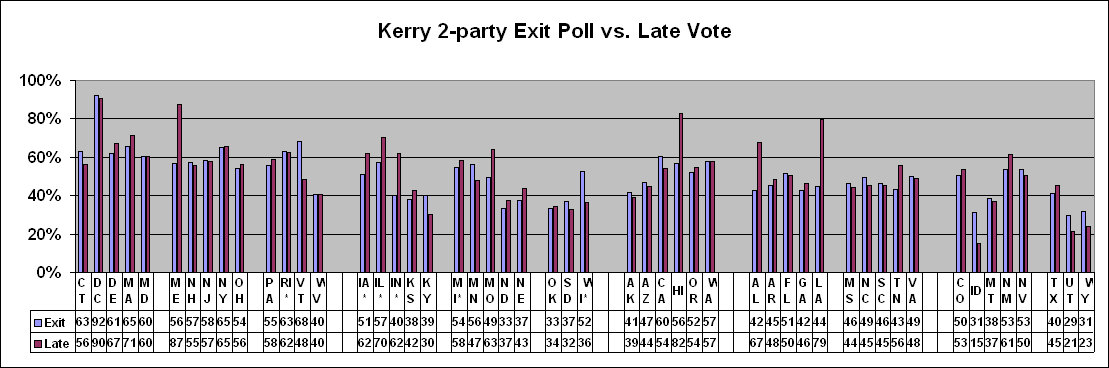
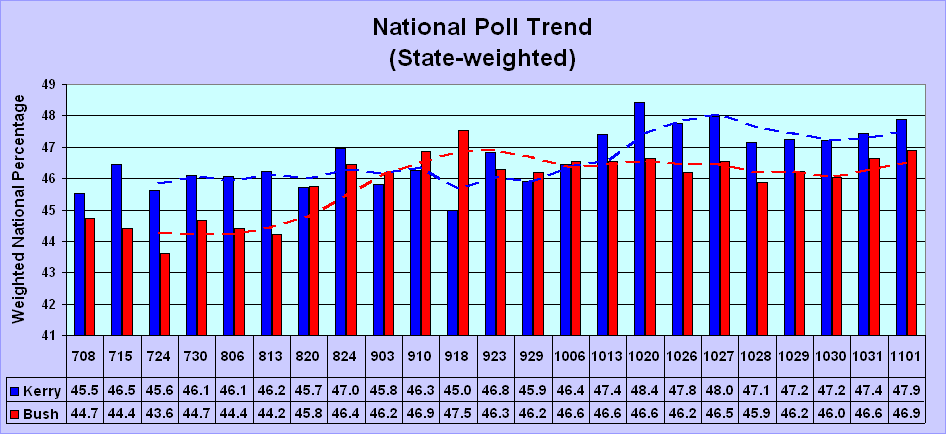
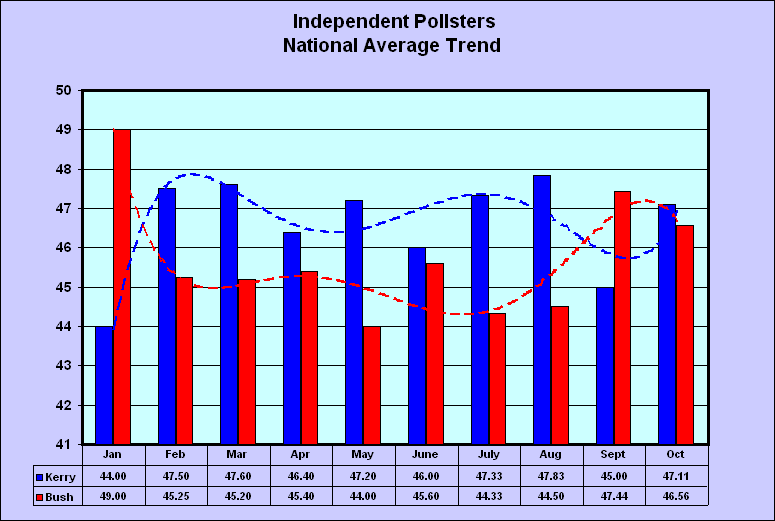
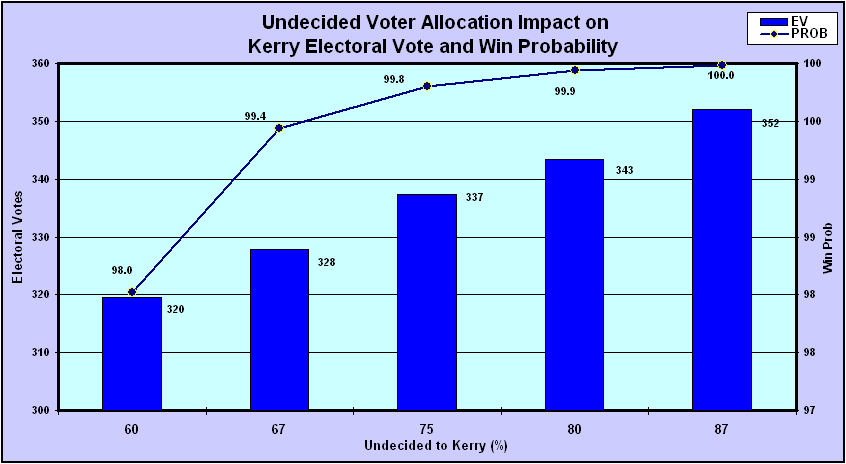
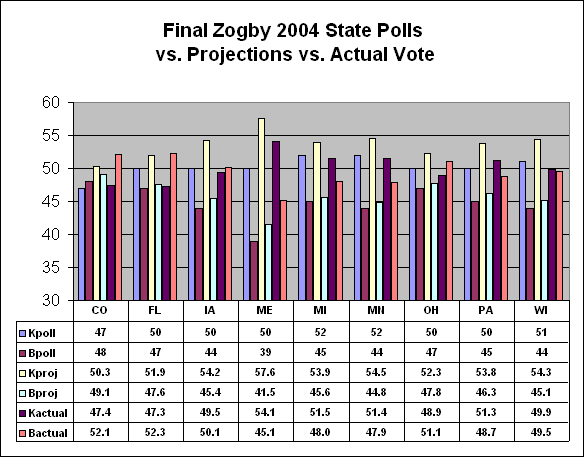
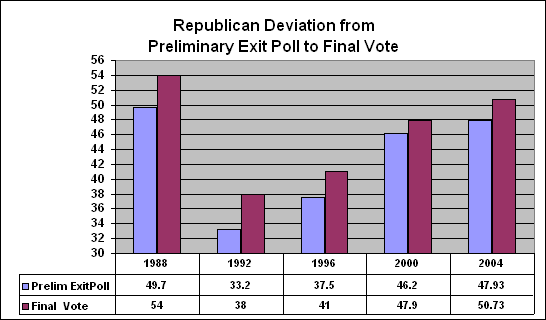
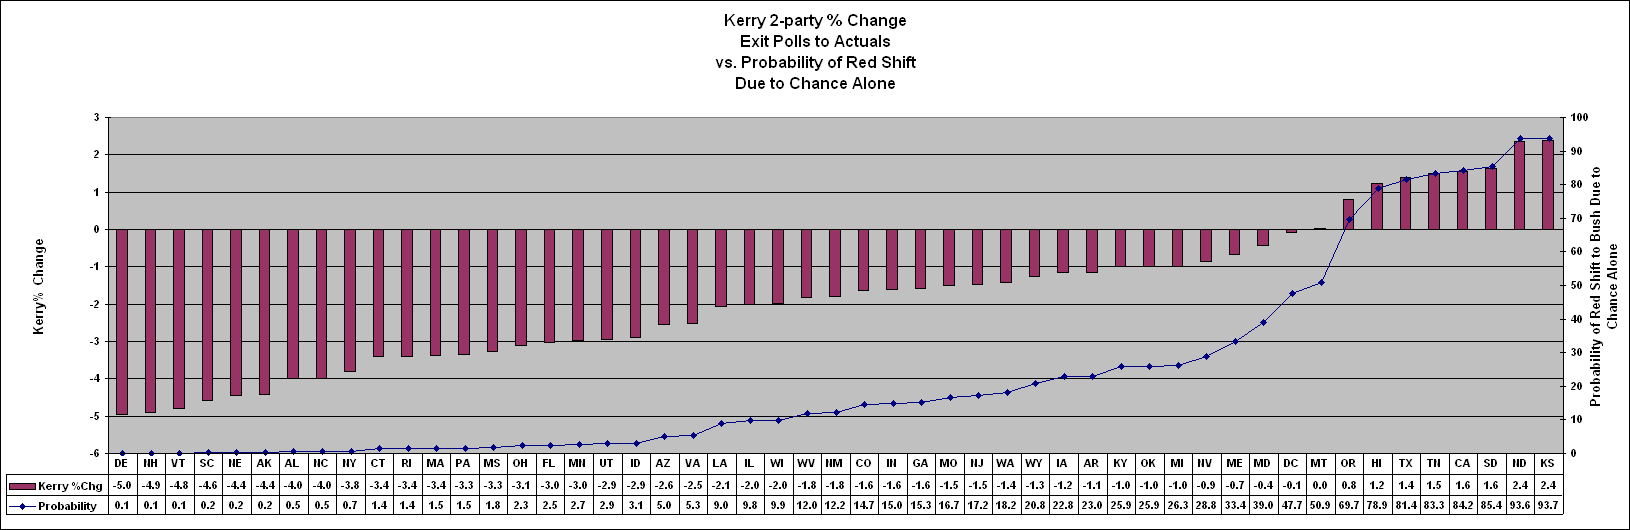
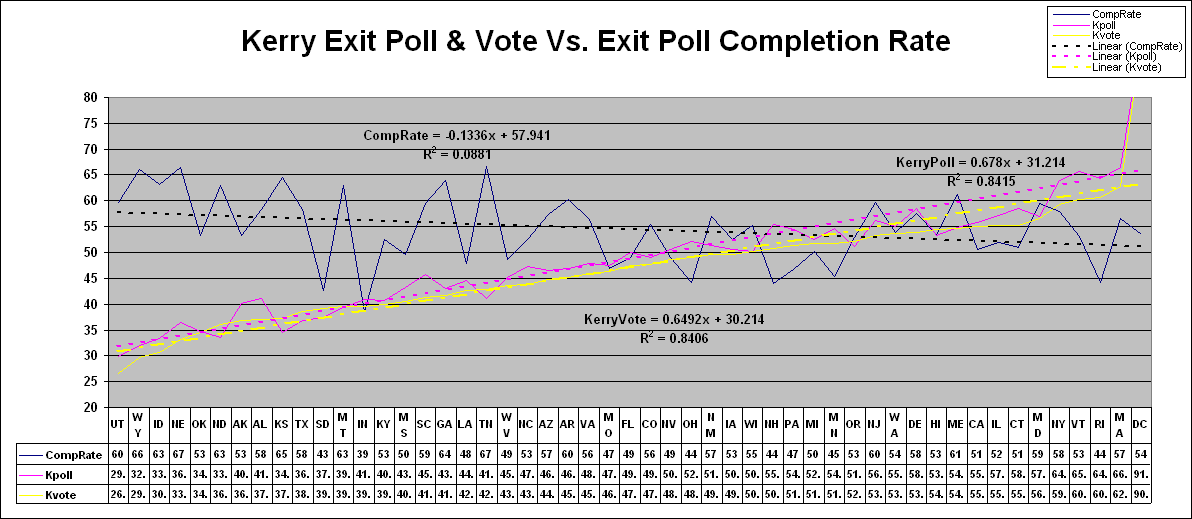
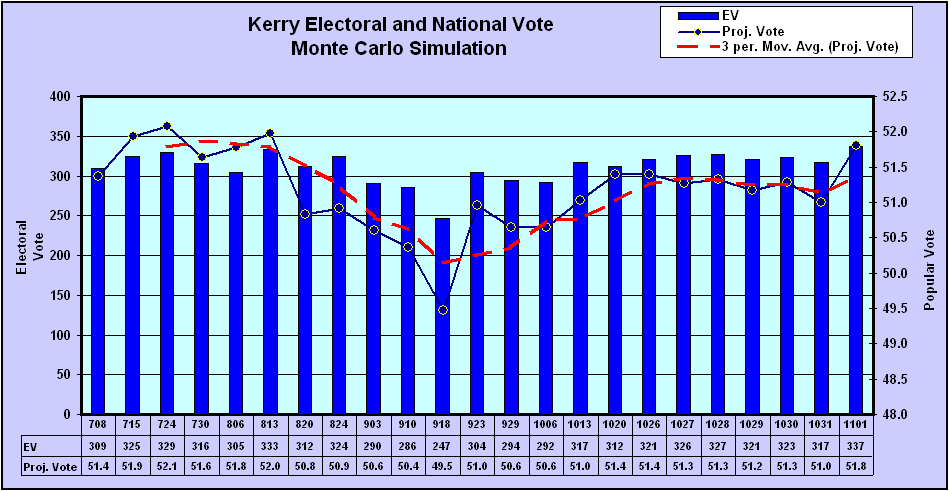
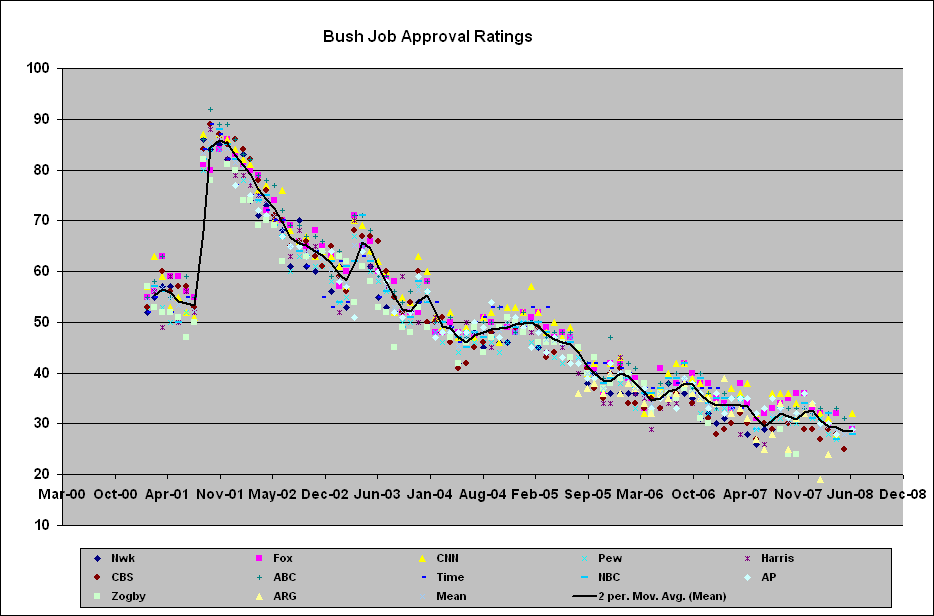
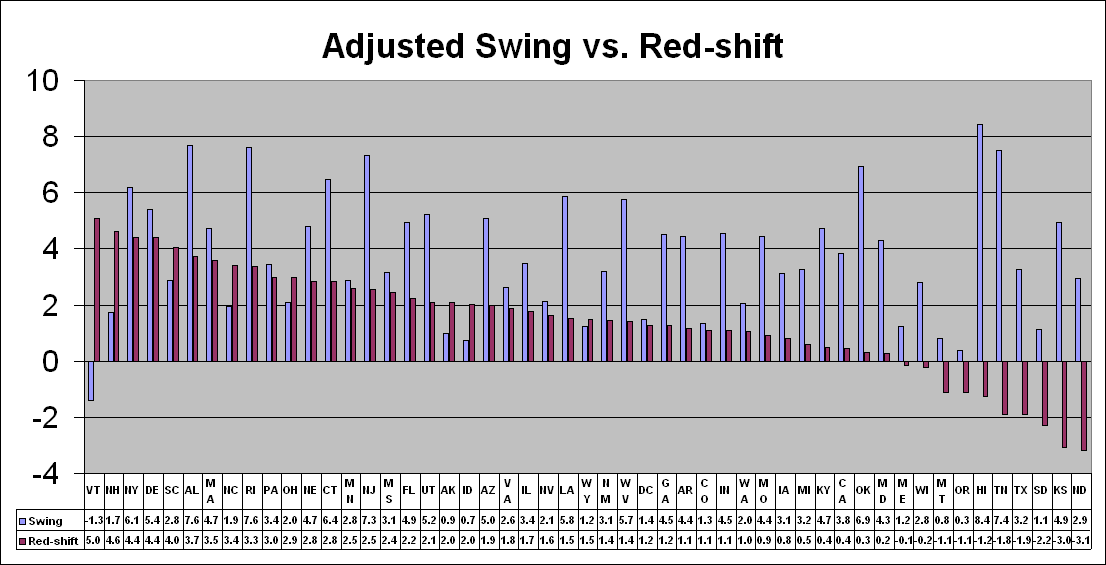
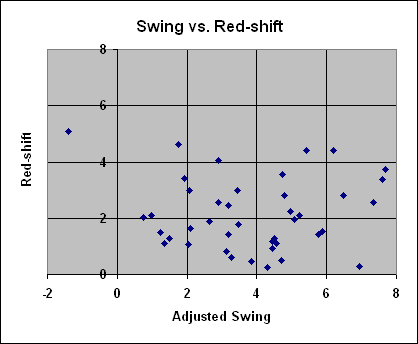
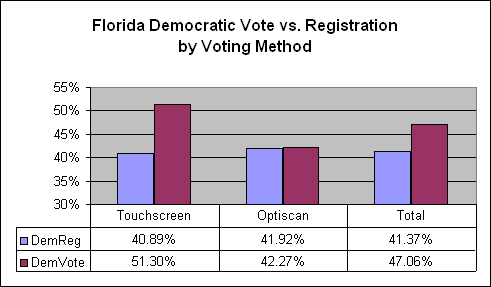
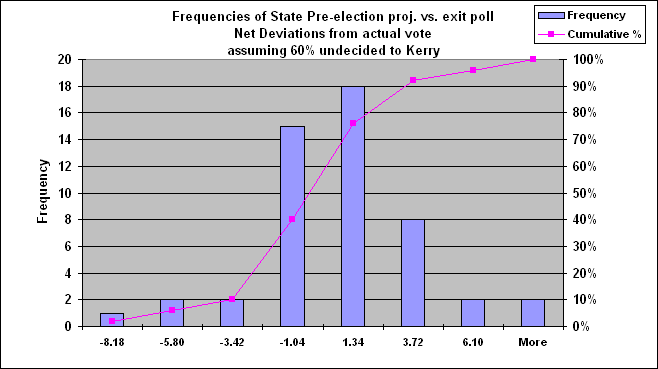
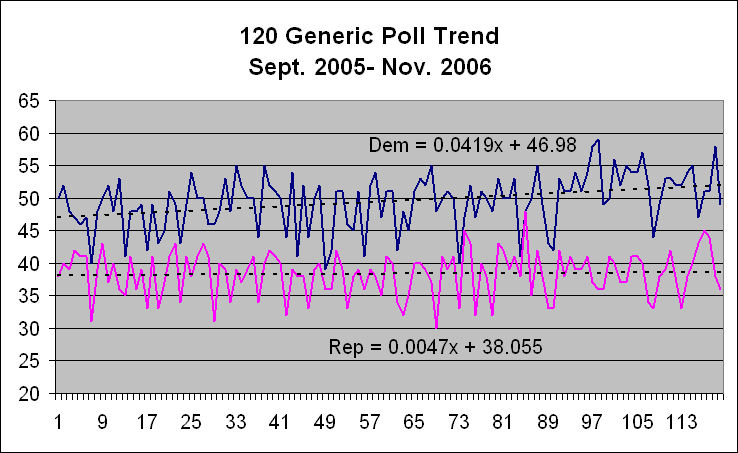
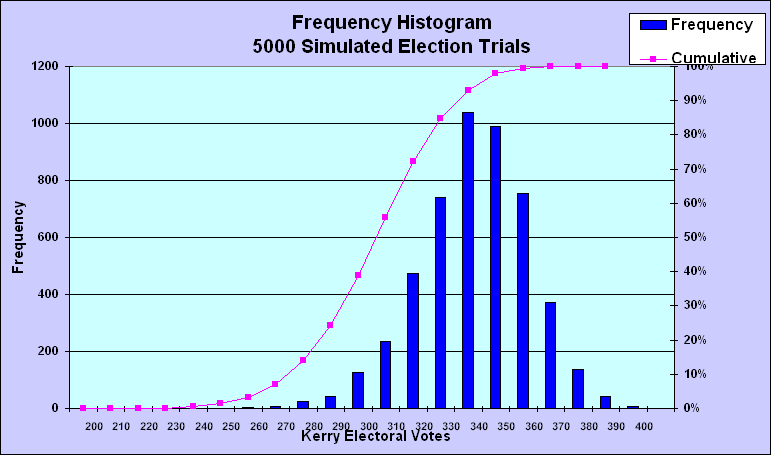
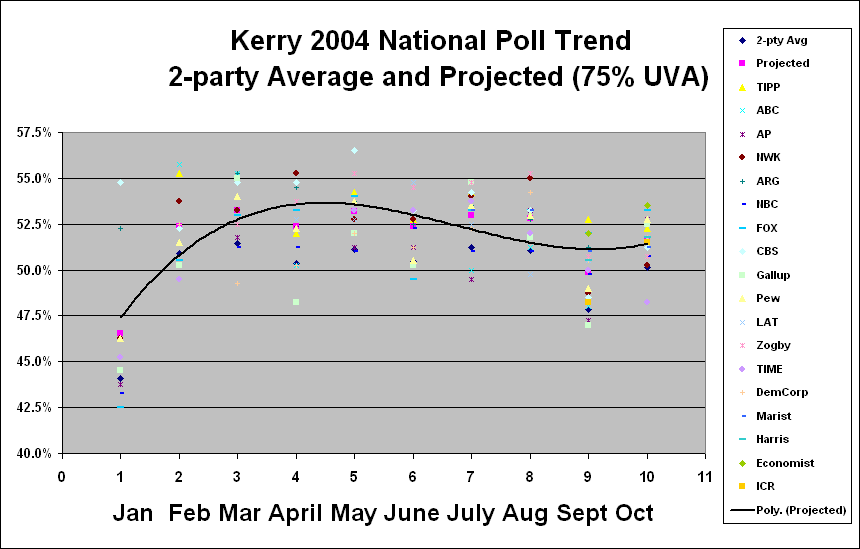
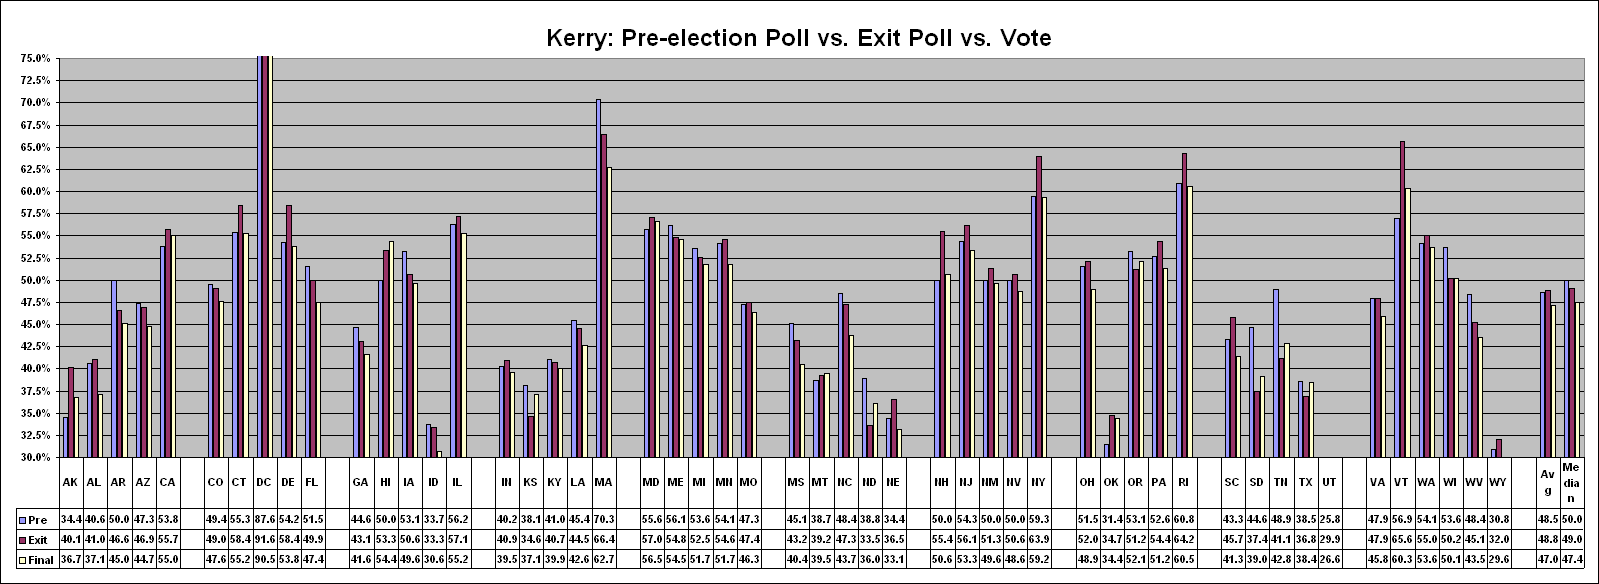
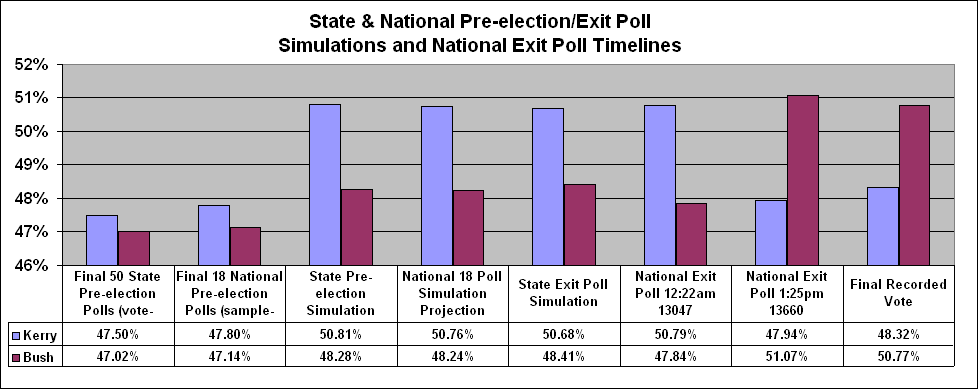
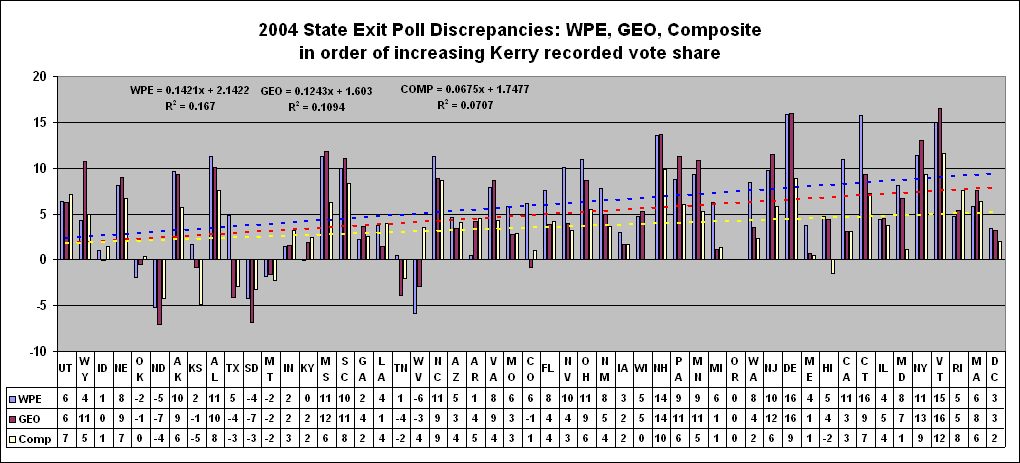
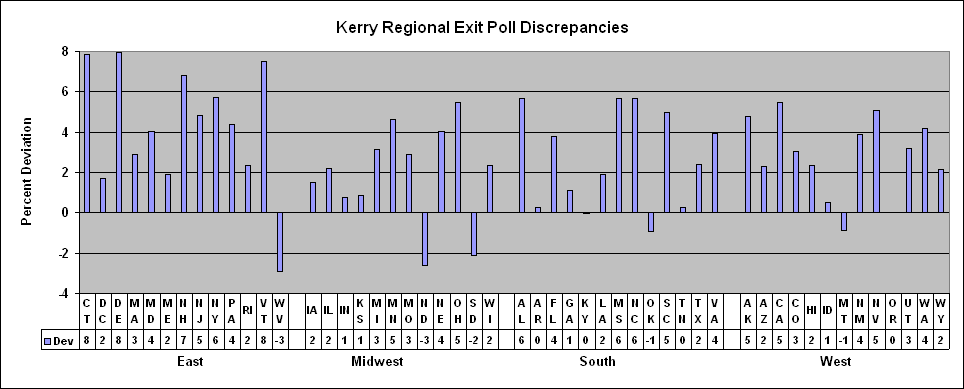
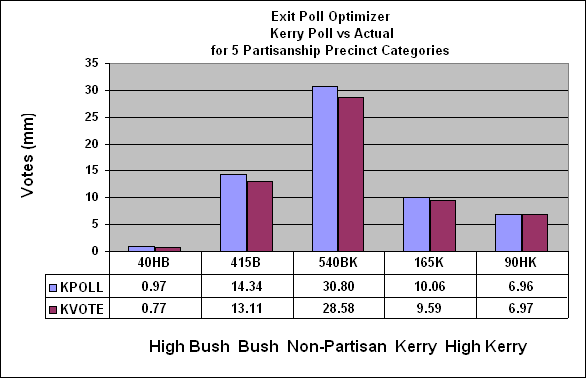
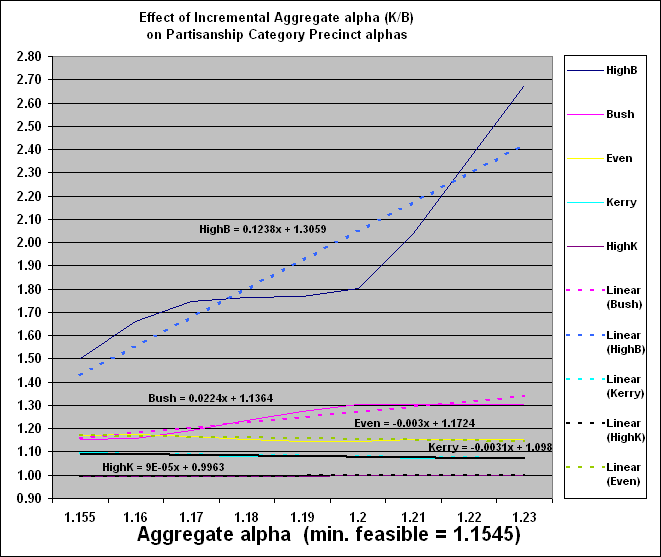
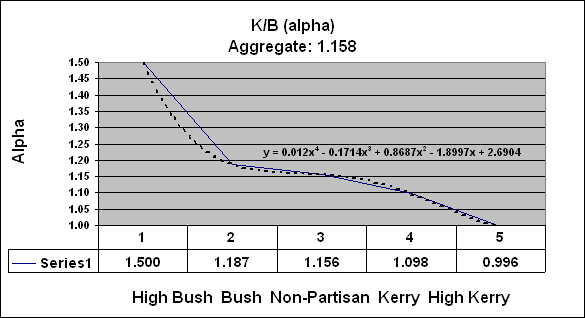
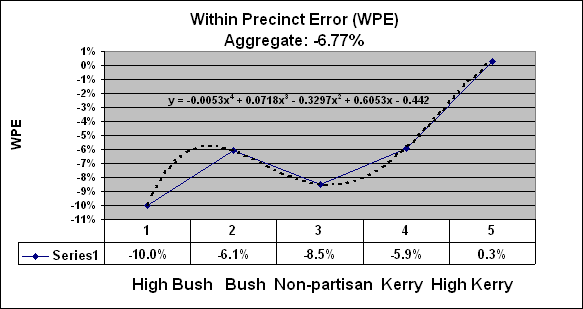
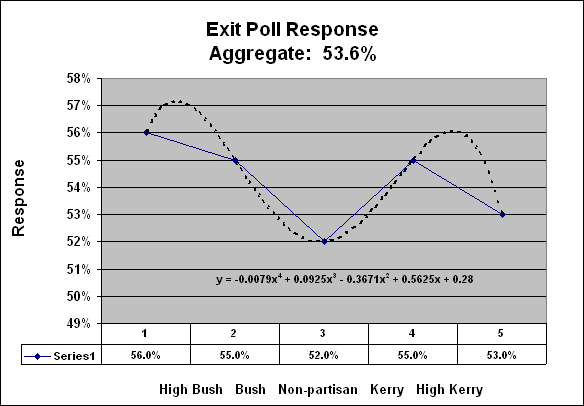
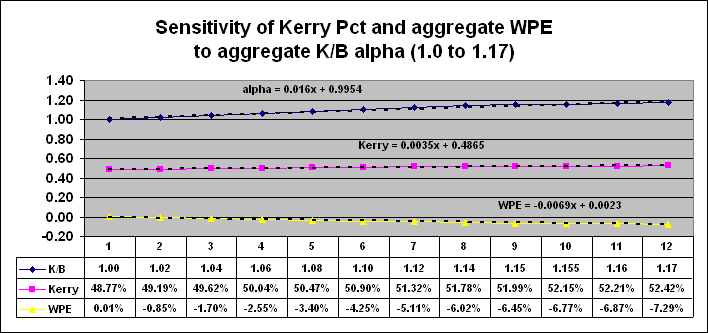
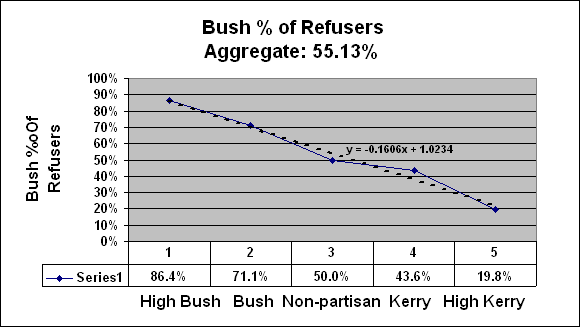
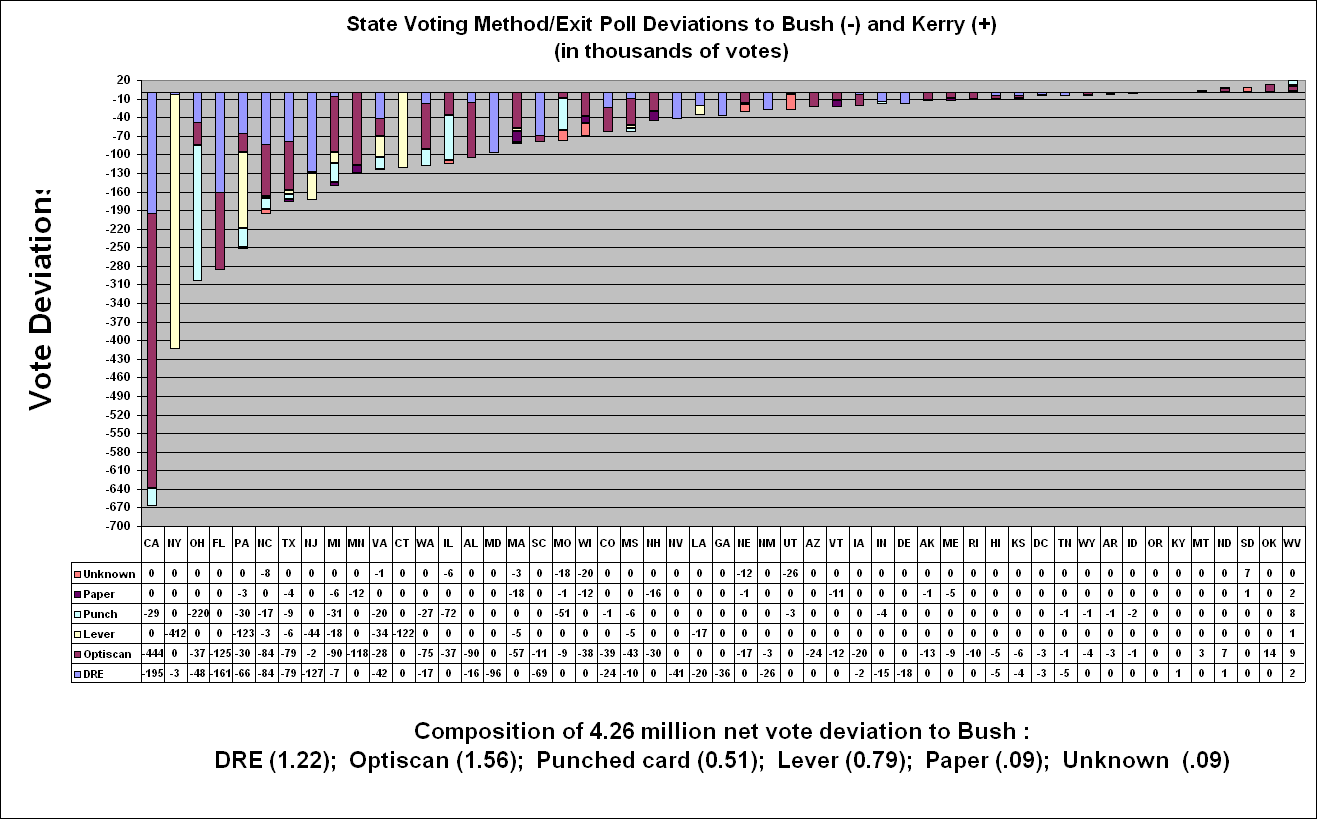
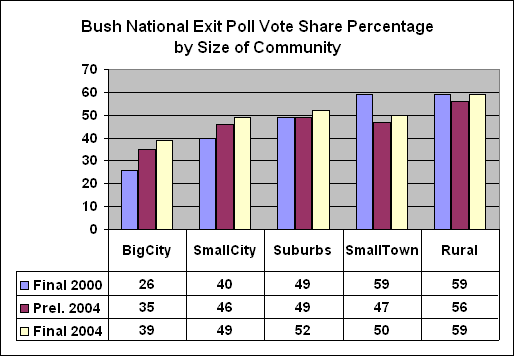
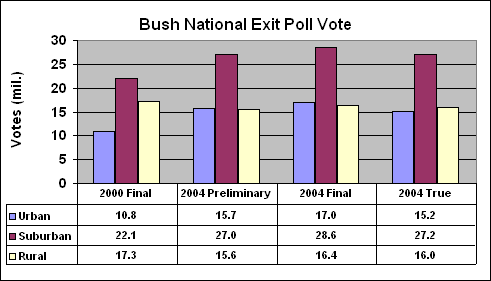
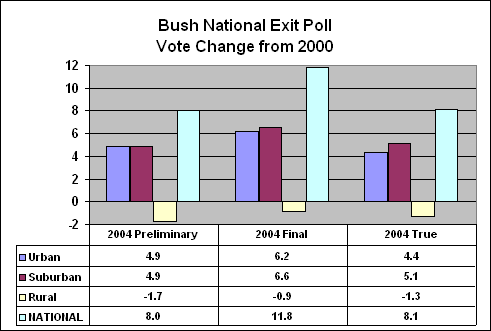
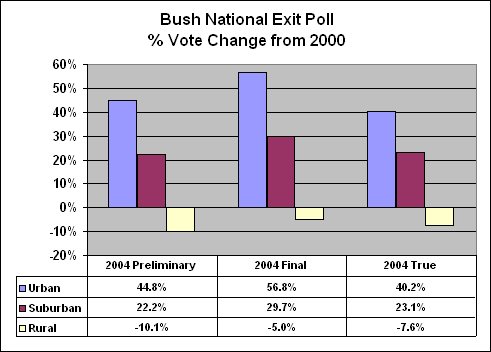
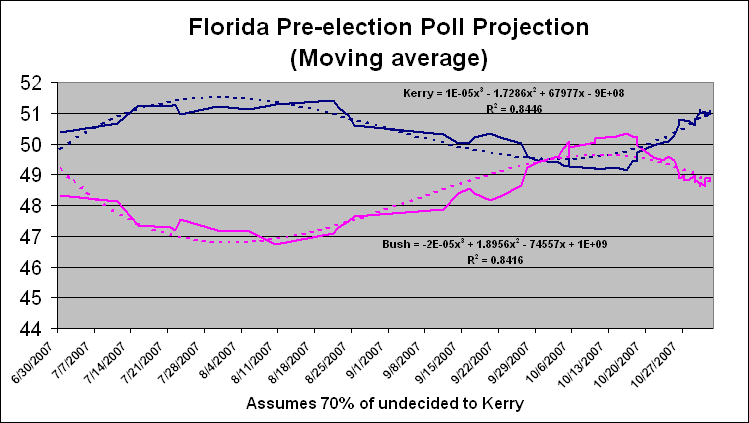
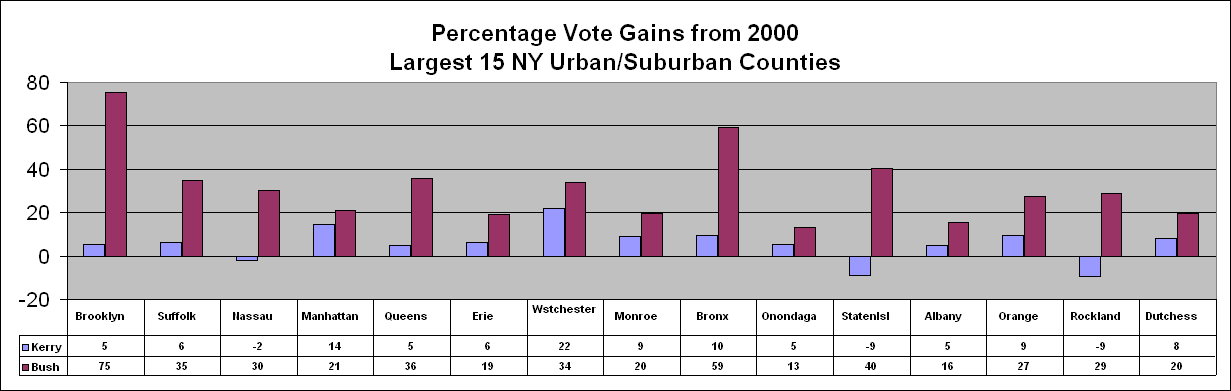
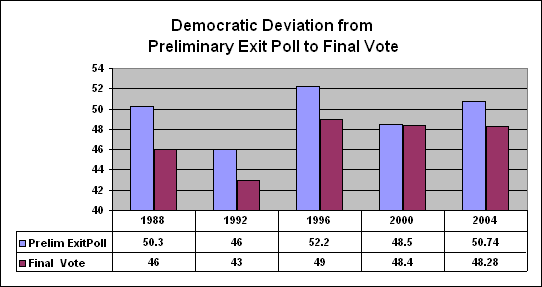
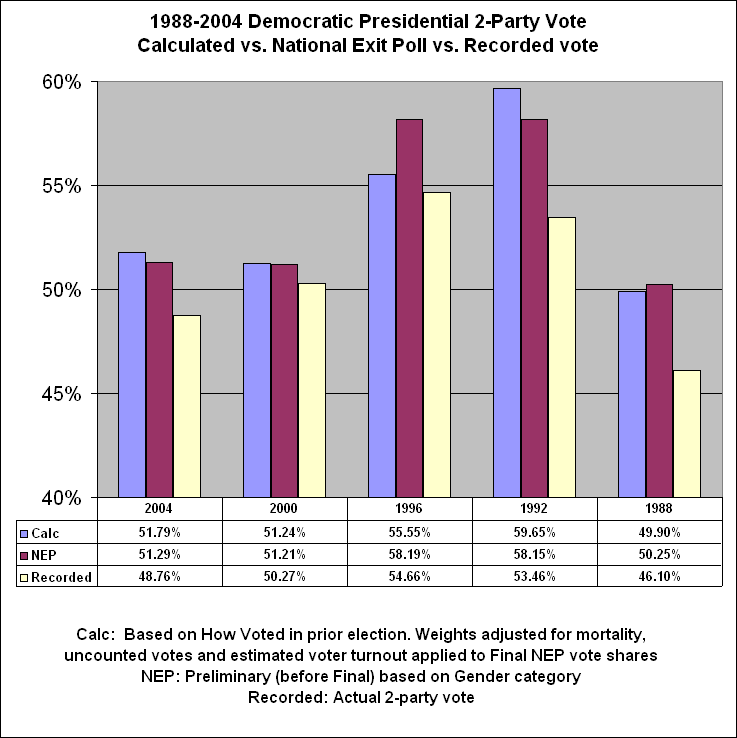
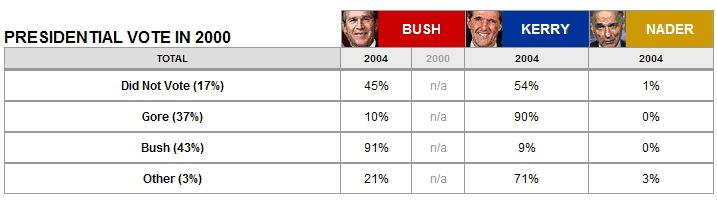