Further Confirmation of a Kerry Landslide
Latest Threads (Progressive Independent)
Polling Analysis Threads (2004-2006)
2004-2006 Election Fraud Analytics
1988-2004 Election Calculator Model (Excel)
Interactive Election Simulation Model (Excel)
-updated 7/24/07
Monte Carlo Polling Simulation Model (Excel)
THE ELECTION MODEL
Created
by TruthIsAll
Final
Projection
Last
update: Nov.1, 2004
Kerry 337 EV / 51.8%
Bush 201 EV / 48.2%
The
model projects Kerry the winner in 27 states:
AR, CA, CO, CT, DE, DC, FL, HI, IL, IA,
ME, MD, MA, MI, MN, MO, NH, NJ, NM, NY,
OH, OR, PA, RI, VT, WA, WI
Election Model Projections
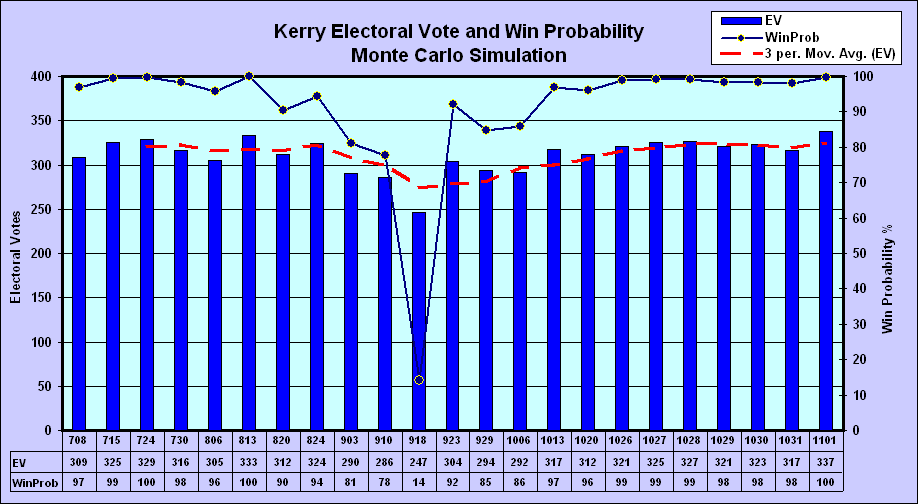
If the election were held today, then based on recent
state polling, the Electoral Vote Simulation model calculates that
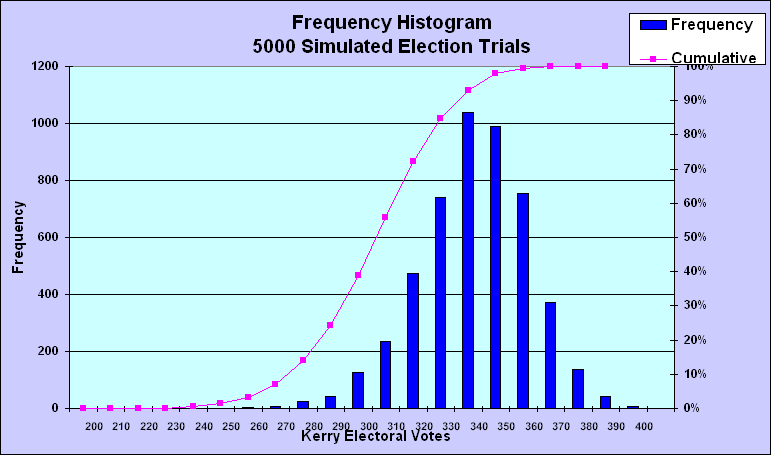
John Kerry has a 99.8% probability of winning an electoral vote majority by a 337-201 margin and 51.80%
of the popular vote. Kerry won 4990
of 5000
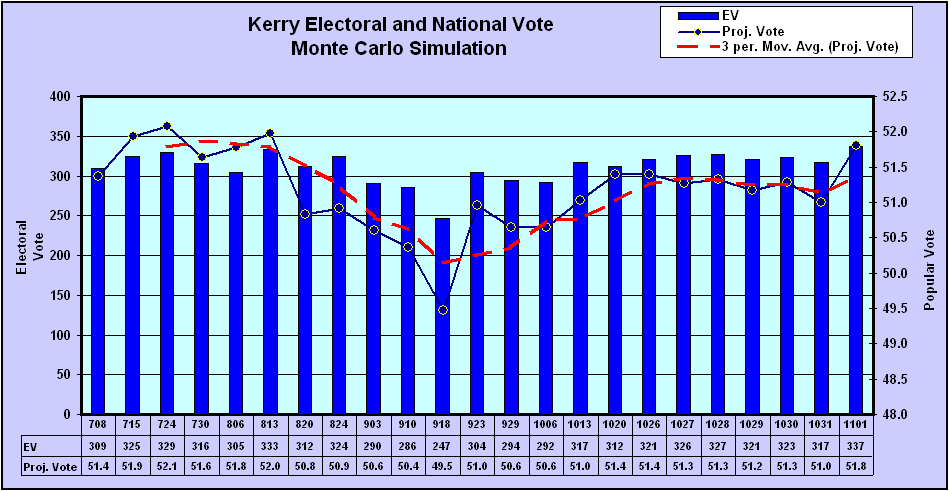
Based on the average of eighteen
national polls, the National Vote Projection model calculates that
Kerry has a 99.99% probability of
winning a popular vote majority with 51.63% of the vote.
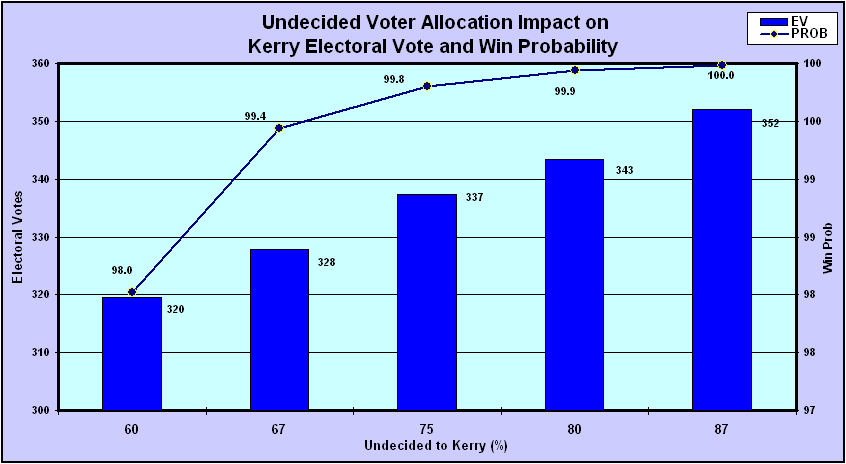
For the final projection, the base case undecided/other allocation assumption
to Kerry has been changed from 60% to 75%. This is consistent with the opinion of
professional political pollsters. To gauge the sensitivity
of the expected electoral vote and win probability to the allocation, the model
calculated five scenarios: 60%, 67%, 75%, 80% and
87%.
|
|
|
|
|
|
|
|
|
|
|
Current (%) |
Simulation Model State Polling Weighted
Average |
Projection Model National Polling Combined Average |
|
|
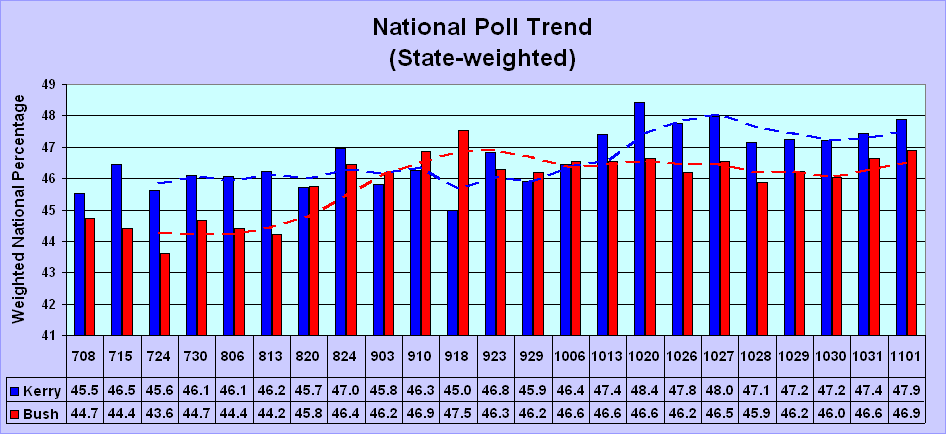
Kerry |
47.88 |
47.17 |
|
|
Bush |
46.89 |
46.89 |
|
|
|
|
|
|
|
Projected (%) |
EV/Popular Vote |
Popular Vote |
|
|
Kerry |
337 / 51.80 |
51.63 |
|
|
Bush |
201 / 48.20 |
48.38 |
|
|
|
|
|
|
|
Win Prob (%) |
Electoral Vote (5000 trials) |
Majority Vote (MOE: 0.73%) |
|
|
Kerry |
99.80 |
99.99 |
|
|
Bush |
0.20 |
0.01 |
|
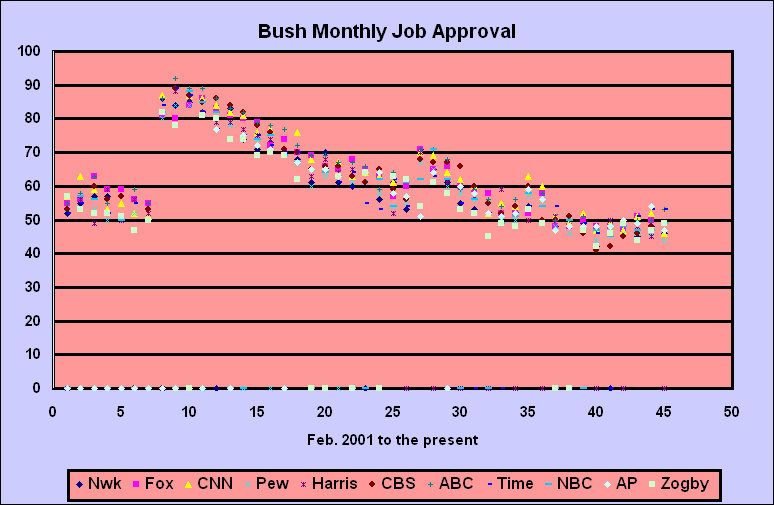
Bush Job Approval: 48.50%
(11 Poll average)
Click for detailed polling and analytic reports
Click a graph to
view:
1. Kerry/Bush National
Trend derived from Weighted State Polls
2. Kerry Electoral Vote and Win Probability Projection Trend
3. Kerry Electoral and National Vote Projection Trend
4. Undecided Voter Allocation Impact on Kerry EV and Win
Probability
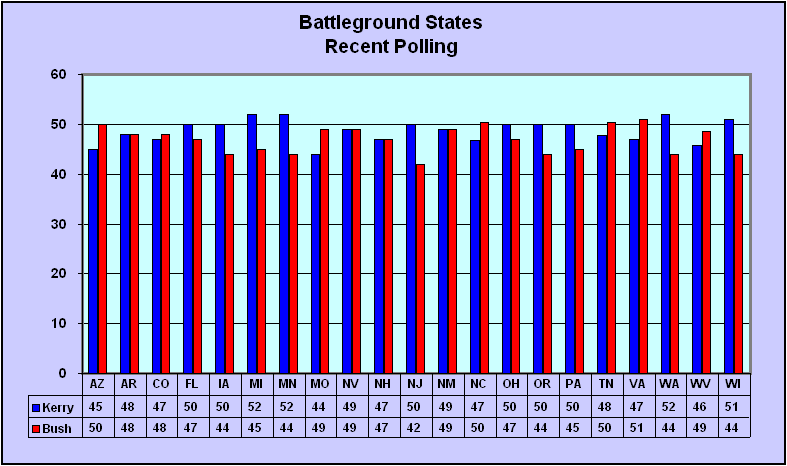
5. Recent Battleground State Polls
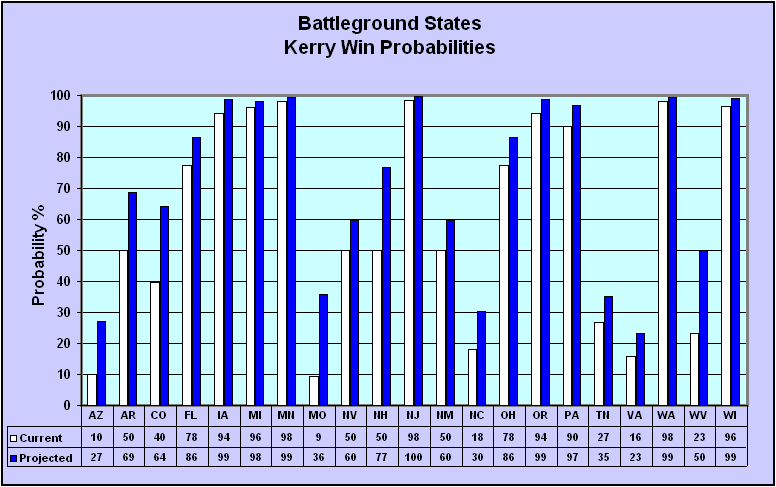
6. Battleground States: Probabilities of a Kerry Win
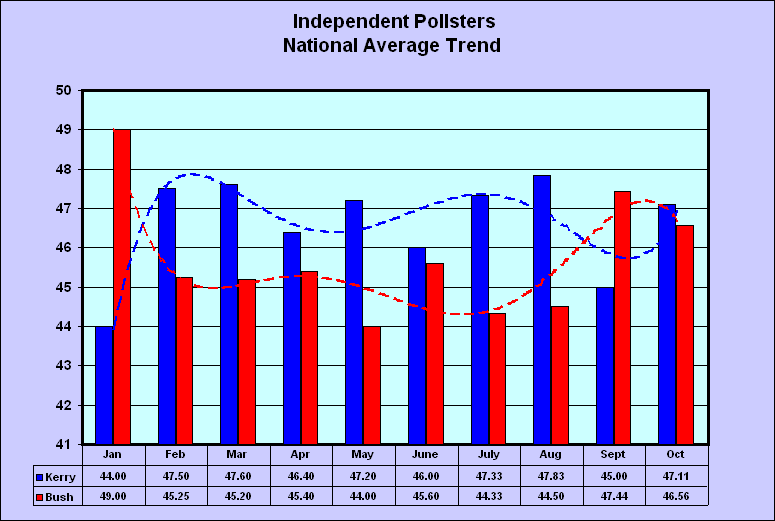
7. Independent National
Polls: Kerry Vs. Bush Monthly Trend
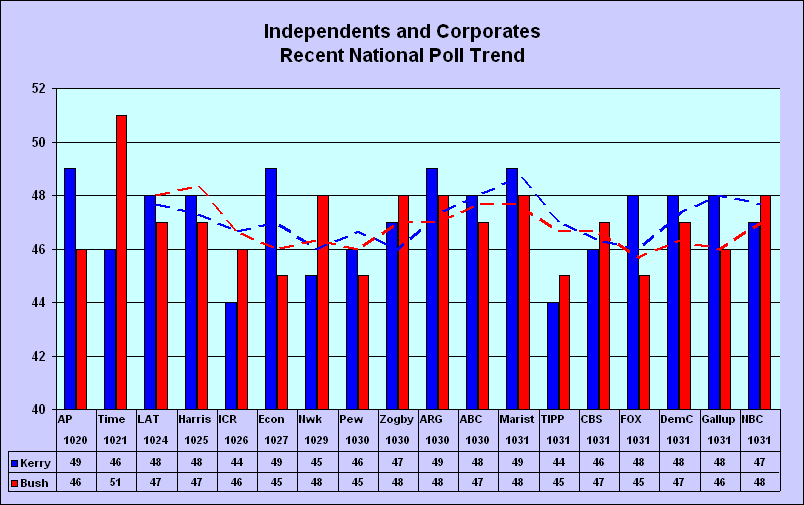
8. Recent Independent and Corporate Media National Polls
9. Bush Monthly Job Approval Ratings from Feb. 2001
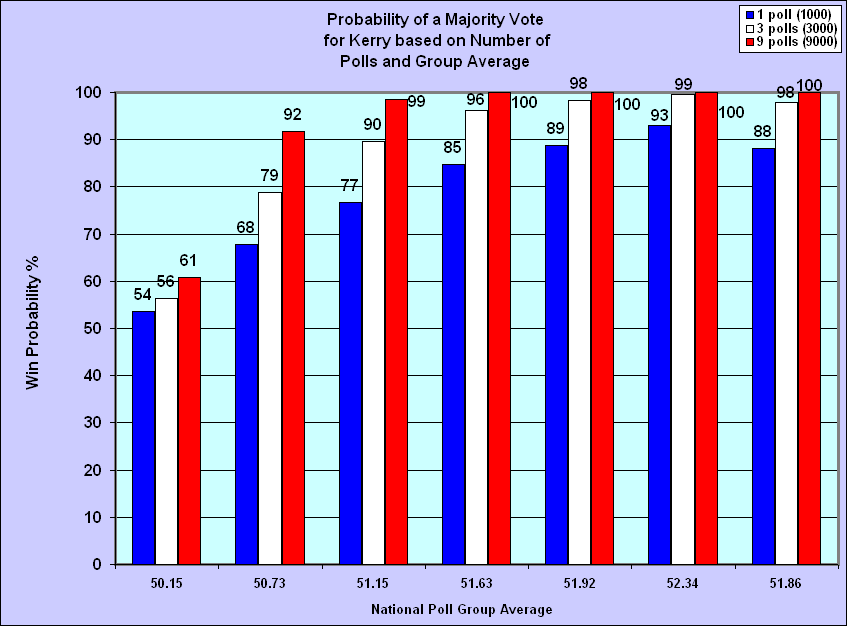
10. Win Probability Sensitivity to Number of Polls and Group
Average
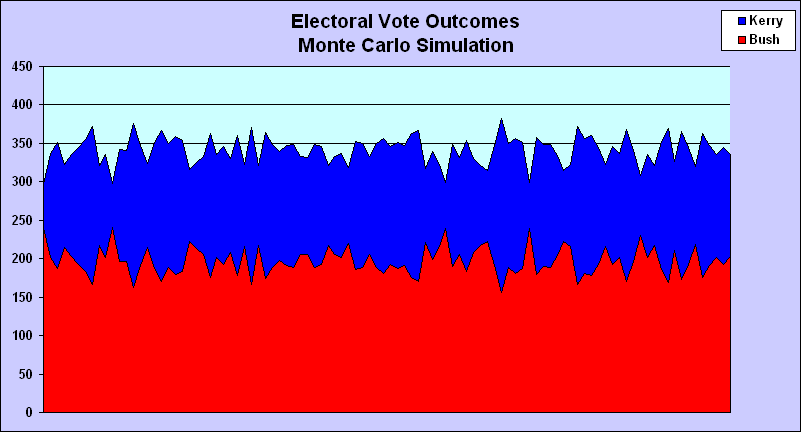
11. 5000 Monte Carlo Simulation Trials
12. 5000 Monte Carlo Simulation Trials: Kerry Electoral Vote Frequency
The
Gospel according to the Polling Gurus:
1- If an incumbent is polling below 50%, he's in trouble.
Bush is barely averaging 47%.
2- If an incumbent's approval rating is below 50%, he's in trouble.
Bush is at 48.50%.
3- If an incumbent has less than a 3%-4% lead in the final polls, he’s in
trouble.
Bush is tied with Kerry.
4- Undecided voters break for the
challenger.
Poll Updates:
Zogby: Kerry 47 Bush 48 (Kerry -1)
TIPP: Kerry 44 Bush 45
(Kerry +4)
Rasmussen: Kerry 47.4 Bush
48.8 (Kerry -.4)
FOX: Kerry 48 Bush 45
(Kerry +1)
WaPo: Kerry 48 Bush 48 (Kerry -1)
If Kerry
1) wins FL and loses OH, he has a 99.3% win probability with 307 EV.
2) loses
FL and wins OH, he has a 98% win probability with 300 EV.
3) loses
FL and loses OH, he has a 75% win probability with 280 EV.
4) wins
FL and wins OH, he has a 99.8% win probability with 327EV.
Election Model Methodology (see below for
a complete description):
The Election
Model actually consists of three individual models:
1) National Polling Model I – based on
national polls from 9 independent polling firms.
2) National Polling Model II – based on
national polls from 18 independent and corporate media firms.
3)
In each
National Polling model, the average vote percentage split is calculated. All three models PROJECT a vote percentage by
ALLOCATING the undecided and others to Kerry and Bush. The base case assumption
is that 60% will split for Kerry and 40% to Bush. The rationale for the
assumption: historically, the undecided vote breaks for the challenger.
National and
state win probabilities are calculated based on the adjusted poll projections.
The Normal Distribution is used to compute the probability of winning a
majority of the national votes in the National models, and the probability of
winning a majority in each of the states in the
The
Sensitivity Analysis
A powerful feature of the
Election Model is the built-in sensitivity analysis. We analyze how various
undecided voter allocation assumptions effect Kerry’s projected popular vote,
electoral vote and win probability. The
base case assumption is that Kerry will win 60% of the undecided vote. But what
if he does better than that? What if he does worse? To get a feel for the
probabilities, we calculate Kerry’s prospects for the following undecided
allocations: 50%, 55%, 60%, 67% and 75%.
In the EV Simulation model,
Kerry’s electoral vote win probabilities increase as his undecided allocation
increases from 50% to 75%. His projected vote, electoral vote margin and number
of winning states increase accordingly.
Both National models
calculate the probability of a popular vote majority, given the same undecided
allocation scenarios. The win probabilities are calculated using national
polling data, unlike the EV simulation which uses state polling.
Election Model Methodology
There are three
primary methods for tracking and predict elections. Each utilizes different
data sources.
The first analyzes economic factors: growth, jobs, inflation, etc. Economic and
political forecasters have had some success using this approach (after all,
this is what they do for a living) by employing an econometric models based on
multiple regression and/or factor analysis. The derived formula weights the
variables in order to predict those which most affect the popular vote. How
some can forecast a 58% popular vote for Bush, considering the economic and
political events of the last four years, is a mystery to me.
The second method tracks the national polls and projects undecided or third
party voters in order to predict the winner of the popular vote. There are
about 15-20 national pollsters. A
majority of the popular vote does not mean the winner will gain 270 electoral
votes. For all practical purposes the
winner of the popular vote will most certainly win the electoral vote. The
possibility that he won’t can only occur in extremely close elections where the
winning margin is less than 0.5%. In fact, in a 51-49 popular vote split, there
is virtually zero probability that the popular vote winner would lose in the
Electoral College. In 2000, Gore won the national vote by 0.5% and would have
won
A third method tracks the individual state polls. The focus of this method is
to predict the electoral vote spread.
Ten to twenty tight battleground states usually hold the key to the
election.
In the Election Model, methods two and three are used. Polls have been pretty
good indicators, provided they are current and unbiased.
The Model uses national and state polls as the basis for the projections. The
only projection assumption
is in the allocation of undecided/other voters. Historically,
undecided voters have split at least 2-1 for the challenger. The Model projects
60% will vote for Kerry as a base case assumption. So if a poll has the race tied at 45-45, then
Kerry’s is considered to be leading by 51-49, since he will receive 60% of the
remaining 10%.
One advantage of
national polling is its relative simplicity and point “spread” focus. If the
spread exceeds the polling margin of error (MoE),
typically +/-3% for polls of 1000 sample size, then based on statistical theory,
the leader has a 95% chance of winning the election - assuming a) the election was held that day
and b) poll is an unbiased sample of the actual voting population.
But that is just the
probability for a single poll. If we consider three polls, or equivalently, a
single poll of 3000 samples, the MoE tightens to
+/-1.80%. Assuming that the average
split is 52-48%, there is a 95% probability that the leader will receive
between 50.2% and 53.8%. If we add the
2.5% probability that he will exceed 53.8%, then he has a 97.5% probability of winning at least
50.2% of the vote.
Now let’s consider fifteen polls. Here the MOE is a very tight +/-0.80%
confidence interval. For the same 52-48
% average spread, the probability is 95% that the leader will receive between
51.2% and 52.8% of the popular vote. The probability that the leader will
exceed 50% of the national vote is 99.99+%. If the leader has an average
52%-48% lead in 15 national polls the day before the election, then an election
defeat will be extremely unlikely. In
fact the odds would be less than one in a thousand.
The 95% confidence interval around the mean is derived from the MOE. The MOE is
1.96 times the standard deviation, which is a statistical measure of the
variability of polling observations. The standard deviation, along with the
2-party poll ratio, is input to the normal distribution (the bell-shaped curve)
in order to determine the probability of winning a majority of the vote in the
national (2) and state models.
But an electoral vote majority (270), not the popular vote, is the magic
number. To calculate the expected EV from state polling data, we calculate the
probability of winning each state and then apply the popular
In the case of a 50-50
poll split, assuming undecided voters are allocated equally, each candidate has
a 50% probability of winning the state. If the split is 60-40, the probability
that the leader will win the state is 99.99%. If the polling split is 51-49,
the leader has a 69% chance of winning the election. For 52-48, the probability
is 83%. It’s 97% for a 53-47 split
(outside the MOE).
So this is how we determine the probability of winning the election: In a
In each state trial run, the model generates a random number (RND) between 0
and 1. The RND determines who wins the state. For example, if the RND generated
for FL is .55 and Kerry has a .60 probability of winning the state, then he
wins the state in this trial since the RND fell in the interval from 0 to
0.60. If the RND is greater than .60,
then FL would go to Bush in this trial run.
In this fashion, the model proceeds to generate an RND for each state,
assigning its electoral votes (EV) to the winner. The total number of electoral
votes calculated for each of the 5000 election trials. If Kerry wins 4900, then he has a 98%
probability (4900/5000) of winning the election. The model also calculates
Kerry’s expected (mean) electoral vote by averaging his EV totals in the 5000
trials.
An advantage of the simulation approach is that it minimizes poll “whiplash”
(slight changes in state polling which causes the leader to change. This will
not affect the total expected EV as much it would if we assigned ALL of the
electoral votes to the leader, even if he was ahead by just 0.5%.
Using national and state models has another advantage: it provides a
mathematical confirmation between the two methods. If the results differ, it
could mean that the state polls are more current than the nationals, or that
the accuracy of the state or national polling data (or both) is questionable.
That is why the model uses 18 national and 51 state polls. This reduces the
margin of error, so that we have more confidence in the results.
A final word, one that cannot be over-emphasized: The Election Model calculates
the PROBABILITY of a Kerry win. It does not PREDICT a Kerry win.
The Election Model
AVERAGES the latest national and state polls, then ADJUSTS the averages by
ADDING an ASSUMED undecided voter allocation, and APPLIES statistical theory,
based on the number of polls and the average MOE, to determine the PROBABILITY
of winning the election.
Favorite Links
An incumbent who can’t break 50 percent is in trouble, even if
he’s ahead.
http://www.prospect.org/web/page.ww?section=root&name=ViewWeb&articleId=8694
Undecided
voters break for the challenger.
http://unfutz.blogspot.com/2004/09/how-undecideds-break.html
Polling
Data
http://online.wsj.com/public/resources/documents/info-battleground04.html
http://www.americanresearchgroup.com/
http://www.economist.com/media/pdf/YouGovN.pdf
http://www.electoral-vote.com/
Commentary
and Analysis
http://www.emergingdemocraticmajorityweblog.com/donkeyrising/
http://members1.chello.nl/~a.horlings/doc-polls.html
http://synapse.princeton.edu/~sam/pollcalc.html
2000
Election Exit Poll Statistics
http://www.cnn.com/ELECTION/2000/epolls/US/P000.html