|
.
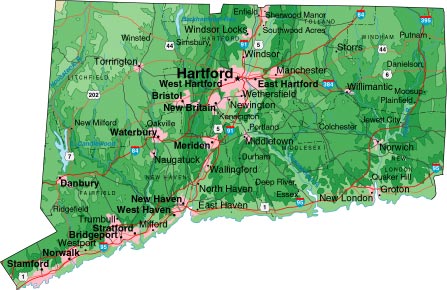
Connecticut is New England’s
second smallest and southernmost state. Its 5,009 square miles
(13,023 square kilometers) are bordered by New York State on the
west, Rhode Island on the east, Massachusetts on the north and by
Long Island sound on the south.
The southerly flow of the Connecticut River divides the state
roughly in half. The coastal plain and central valley are relatively
flat; they contain most of the larger cities. Other parts of the
state are hilly, with the highest altitudes in the northwest corner.
Hills are largely covered with hardwood forests, and about
two-thirds of the state is in open land.
Despite New England’s reputation for a rugged climate,
Connecticut’s weather is relatively mild. On the average, there
are only 12 days a year when the temperature goes above 90 degrees,
and about six days when it falls to zero or below. The growing
season is fairly long, with the first killing frost generally in
mid-October and the last in mid-April. This, together with moderate
rainfall, provides good growing conditions.
Despite Connecticut’s small size, there is some variety in
climate, with temperatures in the northern hills as much as 10
degrees lower than those in the central valley year-round. |
Connecticut is New England's second smallest and southernmost state
with a square mileage of 5,009. It is only 100 miles across and 60
miles high, yet its scenic vistas are among New England's most
beautiful. With its winding country roads, rolling hills, 100 state
parks, unspoiled valleys and lakes and 250 miles of shoreline, you
can understand why tourism brings more than $4 billion a year into
this small state.
|
POPULATION CHANGES AND HIGHER
EDUCATION |
| Educational
Preparedness of Connecticut Youth |
| Some 41 percent of Connecticut's
households do not own a computer, and 45 percent do not have
Internet access. In the schools, there is one Internet-connected
computer for every 9 students (and only one for every 16 students in
schools located in high-poverty districts). Over one-fourth of all
4th and 8th graders tested for basic math knowledge scored below the
level expected for their grade. For the full report, visit
Young
Americans and the Digital Future Campaign. |
THE SOCIAL STATE OF CONNECTICUT '98
|
|
Median Household Income
Average Household Income
Per Capita Income
Median Housing Value
Density/sq. mile
New London County
Median Household Income
Average Household Income
Per Capita Income
Median Housing Value
Density/sq. mile
Windham County
Median Household Income
Average Household Income
Per Capita Income
Median Housing Value
Density/sq. mile |
$ 50,734.00
$ 64,509.00
$ 25,529.00
$ 216,210.00
658.92
$ 46,151.00
$ 53,711.00
$ 21,474.00
$ 183,678.00
354.34
$ 40,814.00
$ 47,098.00
$ 18,076
$ 152,882.00
203.65 |
Source: Norwich Bulletin, 2002 |
2002 STATE ASSET DEVELOMENT REPORT
CARD |
The Corporation for Enterprise
Development has issued its 2002
State asset development report card, ranking states based on
the extent to which public policies encourage wealth accumulation on
the part of lower income citizens. The report indicates that in
every state except New Mexico, asset poverty is greater than income
poverty. The problem is most severe in New York, where "almost
one third of [its citizens] do not have sufficient net worth to live
for more than three months at the federal poverty level without
other support." The situation in Connecticut is somewhat
better, but Connecticut ranks 20th in the nation (above the
neighboring states of Massachusetts and Rhode Island) but well
behind New Hampshire and Vermont. From the report:
"Owning a home is the largest source of assets for
most Americans, but in Connecticut, this opportunity is limited.
The homeownership rate in Connecticut is below the median (28th),
and in particular, the gap in homeownership between white and
non-white families is the 5th largest among all states."
|
|