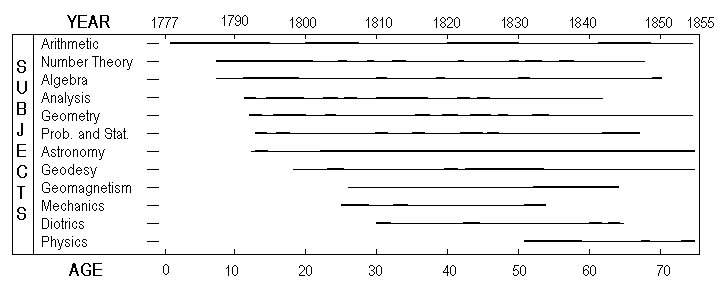
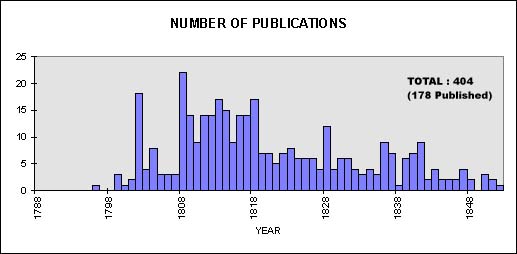
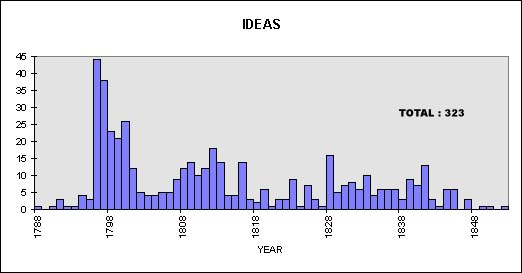
Interest, ideas and publications. The horizontal lines show time spans of Gauss' interests in different subjects. Heavy lines indicate periods of intensive activity. The annual accounts of recorded ideas include published and unpublished "results" (conjectures, theorems, proofs, concepts, hypotheses, theories), significant observations, experimental findings, and inventions. They are based on an examination of published materials, including correspondence and notebooks published after his death. Because of intrinsic ambiguities in dating, identification, and evaluation, this chart gives only an approximate picture of creative flux. the graph of publications shows the number of titles published in each year, including reviews. A count of pages would be similar except for surges.
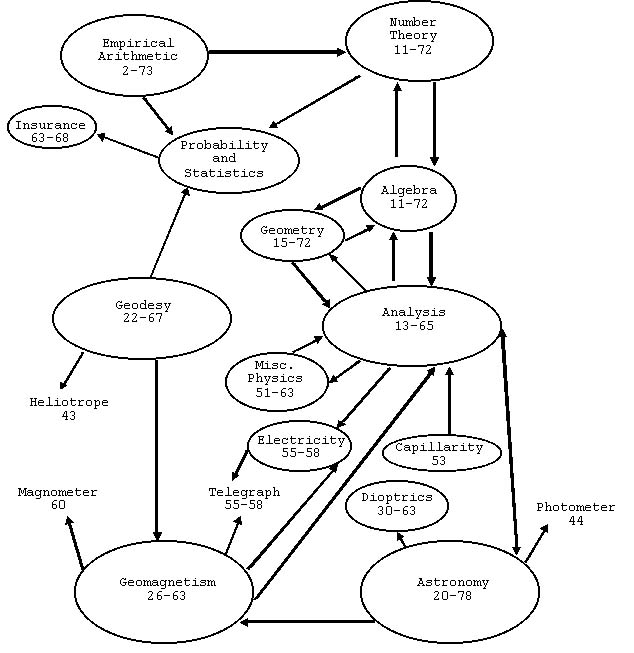
Main lines of development of Gauss' scientific ideas. Arrows suggest the most important directions of motivation and inspiration. Numerals indicate ages. His four most important inventions are given outside of any enclosing ovals. The sizes of the ellipses suggest the weight of each field in his total effort, and the year span is indicative also of the number and variety of activities in each field. The figure should be compared with the graphs above.