Liquidity Ratios and Gross Profit Margin
|
||||||||||||||||||||||||||||||||||
| Internal / Financial Analysis Liquidity Ratios and Gross Profit Margin |
||||||||||||||||||||||||||||||||||
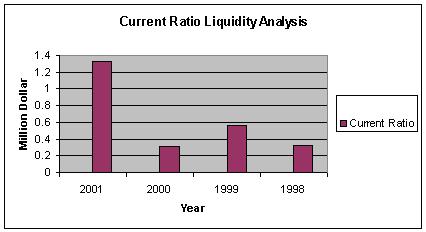
| HOME | Current Ratio Liquidity Ratios: Carnival�s short-term indicator of their ability to pay their short-term liabilities from short-term assets. | |||||||||||||||||||||||||||||||||
| Company Overview | ||||||||||||||||||||||||||||||||||
| Current Situation | ||||||||||||||||||||||||||||||||||
|
||||||||||||||||||||||||||||||||||
| Objectives/Goals | ||||||||||||||||||||||||||||||||||
| Family of Companies | ||||||||||||||||||||||||||||||||||
| Executives / Board | ||||||||||||||||||||||||||||||||||
| Environmental Analysis | ||||||||||||||||||||||||||||||||||
| Industry Trends | ||||||||||||||||||||||||||||||||||
| Environmental Factors | ||||||||||||||||||||||||||||||||||
| Internal/Financial Analysis | ||||||||||||||||||||||||||||||||||
| Corporate Strategy | ||||||||||||||||||||||||||||||||||
| Competitive Strategy | ||||||||||||||||||||||||||||||||||
| Analysis of Strategy | ||||||||||||||||||||||||||||||||||
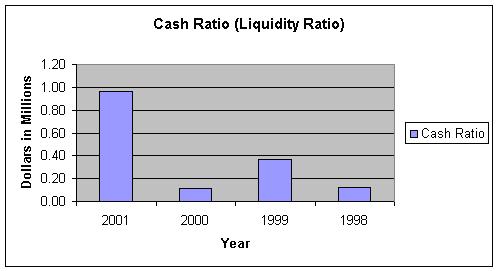
| Cash Ratio: The cash ratio is another form of liquidity ratio that measures the extent to which the company�s capital is in cash or cash equivalents. Since 1998, Carnival Lines has increased the liquidity ratio. This is probably because most of the shipbuilding activities were to be completed in the year 2000. | ||||||||||||||||||||||||||||||||||
| Future Strategy Options | ||||||||||||||||||||||||||||||||||
| Recommended Strategy | ||||||||||||||||||||||||||||||||||
| Strategy Implementation | ||||||||||||||||||||||||||||||||||
|
||||||||||||||||||||||||||||||||||
| The Love Boat | ||||||||||||||||||||||||||||||||||
| References/Sources | ||||||||||||||||||||||||||||||||||
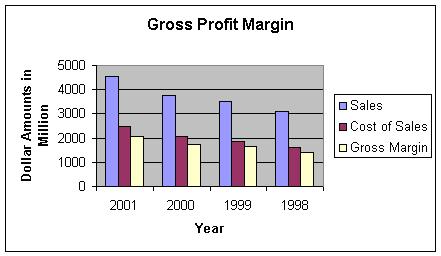
| Profitabililty Ratios: The primary profitability analysis will be taken from the Gross Profit Margin as reflected below. Keep in mind, the Gross Profit Margin represents the total margin available to cover other expense beyond the cost of goods sold. | ||||||||||||||||||||||||||||||||||
|
||||||||||||||||||||||||||||||||||
| Gross Profit Margin: The Gross Profit Margin for Carnival is slightly below Cost of Sales. Ideally, Carnival would like to increase of Gross Profit Margin in the next few years to be above the cost of sales. | ||||||||||||||||||||||||||||||||||
| Click here to see additional ratio analyses. | ||||||||||||||||||||||||||||||||||