| A
mass spectrum is a graph of ion intensity as a function
of mass-to-charge ratio.
Mass spectra are often depicted as simple histograms as shown in the
figure on the left. This record of ions and their intensities serve
to establish the molecular mass and structure of the compound being
mass analysed.
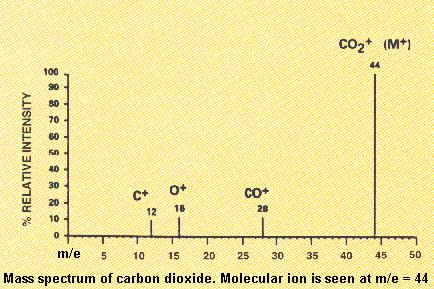
For example, the figure on the left shows a mass spectrum of the simple
molecule carbon dioxide, CO2.
In
this example, all the ions are positively charged. (It is possible to
generate and detect negative ions as well.) The ionised CO2
molecule (or molecular ion) appears at m/e = 44. Since the ionisation
process breaks up or fragments some of the CO2+
molecular ion, a fraction of the ions appear in the spectrum at m/e
values less than the m/e value that corresponds to the molecular mass
of CO2.
Cleavage of a carbon-oxygen bond in the molecular ion to produce ionised
carbon monoxide or ionised atomic oxygen result in the fragment ions
at m/e = 28 and 16 respectively.
Loss of two neutral oxygen atoms results in an additional fragment at
m/e = 12 for ionised carbon. The molecular ion is designated as M+
or CO2+ and the fragment ions are designated as
CO+, O+ and C+.
|