Links to graphics are presented at the end of this text. To display and read a text on ground water quality of the Rio Minho Basin click
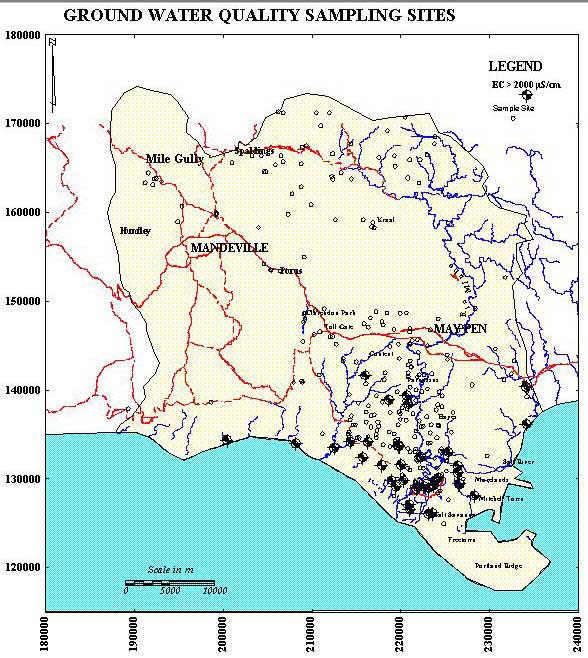
The ground water quality for the Rio Minho Basin is presented in maps (electrical conductivities, nitrates, etc.), Piper diagrams, Wilcox diagrams, Stiff diagrams, and Schoeller diagrams. You may also display the map showing all sampling sites within the basin.
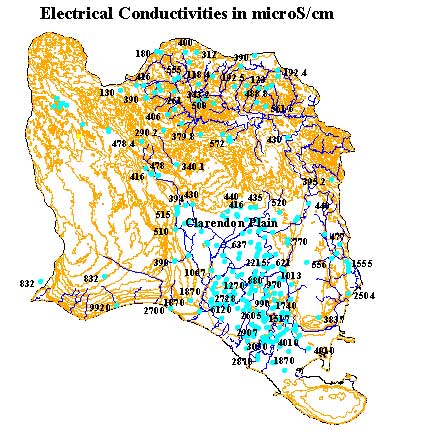
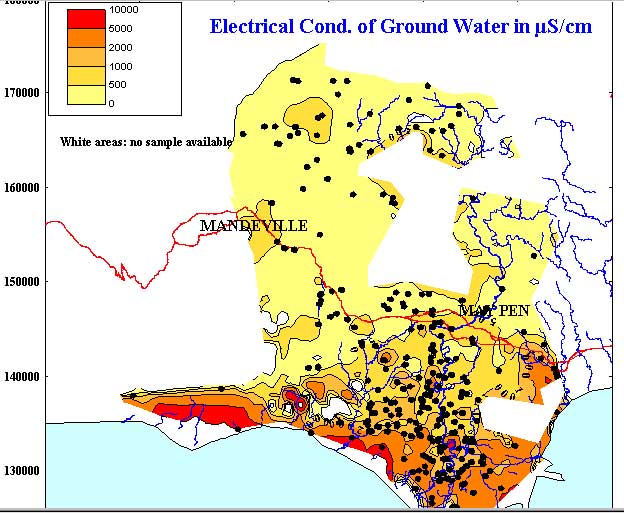
![]() lectrical conductivity, expressed in microSiemens/cm, is the parameter that defines the total mineralization or salinity of water. For a sodium-chloride type of water, that is usually from alluvium or near the coast, multiplying the electrical conductivity by a factor of 0.7 brings about the total dissolved salinity (TDS) in parts per million (ppm). In the water coming from limestone aquifers, the relationship is not that simple.
lectrical conductivity, expressed in microSiemens/cm, is the parameter that defines the total mineralization or salinity of water. For a sodium-chloride type of water, that is usually from alluvium or near the coast, multiplying the electrical conductivity by a factor of 0.7 brings about the total dissolved salinity (TDS) in parts per million (ppm). In the water coming from limestone aquifers, the relationship is not that simple.
A ![]() iper diagram lumps together several or many samples from an area, or from an aquifer. It points at origin of water, differentiating among various types (sodium-chloride, e.g., or calcium-bicarbonate, etc.). In this presentation, all samples from limestone aquifer are shown in one Piper diagram, and so are all samples from alluvium. The results are not always too conclusive considering that too many samples are shown on one diagram.
iper diagram lumps together several or many samples from an area, or from an aquifer. It points at origin of water, differentiating among various types (sodium-chloride, e.g., or calcium-bicarbonate, etc.). In this presentation, all samples from limestone aquifer are shown in one Piper diagram, and so are all samples from alluvium. The results are not always too conclusive considering that too many samples are shown on one diagram.
A ![]() ilcox diagram (or the US Department of Agriculture diagram) is a criterion for usability of water for irrigation. In the graphics that are selected for this presentation, all samples from wells operated by National Irrigation Commission (N.I.C.) are displayed on one Wilcox diagram, and all samples from S.C.O.J. wells on another. Sugar cane, which is the primary crop irrigated by S.C.O.J. wells is sensitive to water quality and the Wilcox diagram may be a good indicator.
ilcox diagram (or the US Department of Agriculture diagram) is a criterion for usability of water for irrigation. In the graphics that are selected for this presentation, all samples from wells operated by National Irrigation Commission (N.I.C.) are displayed on one Wilcox diagram, and all samples from S.C.O.J. wells on another. Sugar cane, which is the primary crop irrigated by S.C.O.J. wells is sensitive to water quality and the Wilcox diagram may be a good indicator.
A ![]() tiff diagram is a graphical presentation of (a) major ions content in absolute terms (in equivalents per million, or milliequivalents per litre, epm) and (b) type of water. A STIFF shows relative relationships among major cations and major anions. Three typical STIFF diagrams are selected and presented one each for (a) limestone aquifer, (b) alluvium, and (c) mixed aquifers.
tiff diagram is a graphical presentation of (a) major ions content in absolute terms (in equivalents per million, or milliequivalents per litre, epm) and (b) type of water. A STIFF shows relative relationships among major cations and major anions. Three typical STIFF diagrams are selected and presented one each for (a) limestone aquifer, (b) alluvium, and (c) mixed aquifers.
A ![]() choeller diagram is a cumulative presentation of absolute mineralization (in terms of ppm of major ions) and ranges of content of major ions.
choeller diagram is a cumulative presentation of absolute mineralization (in terms of ppm of major ions) and ranges of content of major ions.
| Map showing all sampling sites |
| Electrical Conductivity: |
| Typical STIFF Diagrams |
| Two Piper Diagrams: (a) from limestone, (b) from alluvium aquifer. |
| Wilcox Diagrams for wells belonging to and operated by National Irrigation Commission (N.I.C.) and Sugar Company of Jamaica (S.C.O.J.) |
| Schoeller's diagram for samples from NWC wells. |
| General discussion of ground water quality |
| Time series of some chemical parameters/constituents for selected wells. |
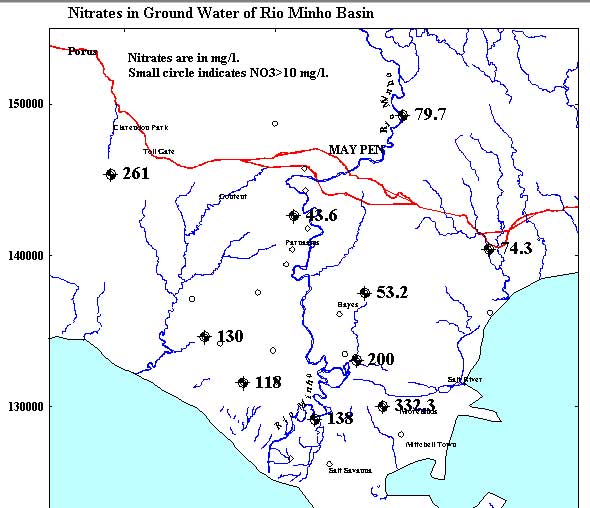
| Nitrates in Ground Water. |