
You may also see time series for individual wells by either clicking directly on a well in the table below (without the help of the map).
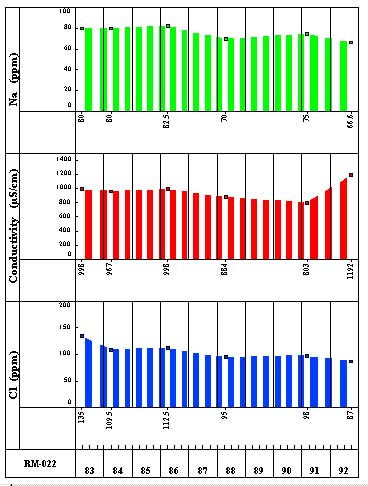
| RM-022 |
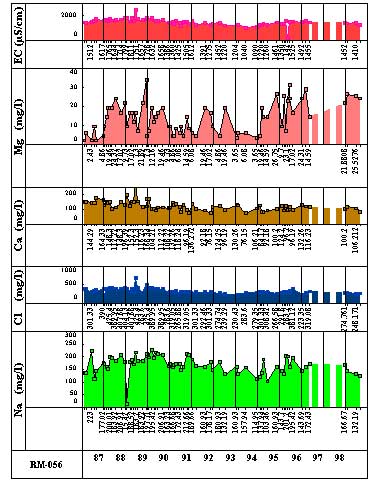
RM-056 |
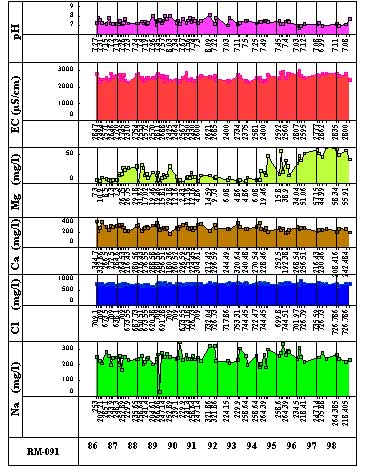
RM-091 |
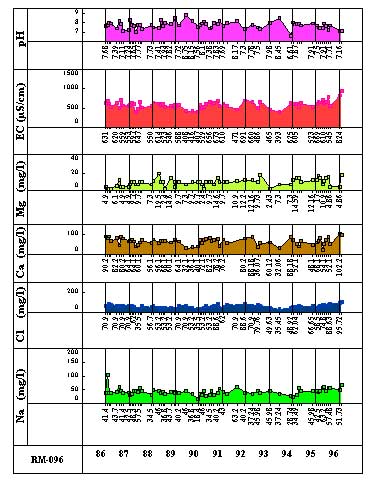
RM-096 |
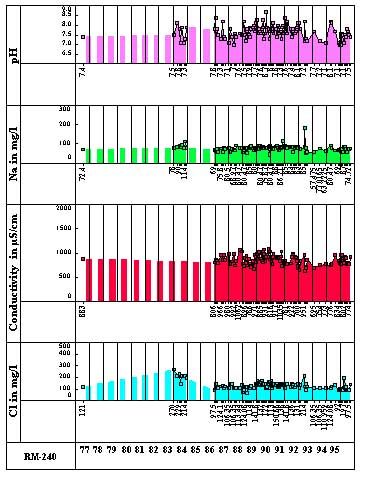
RM-240 |
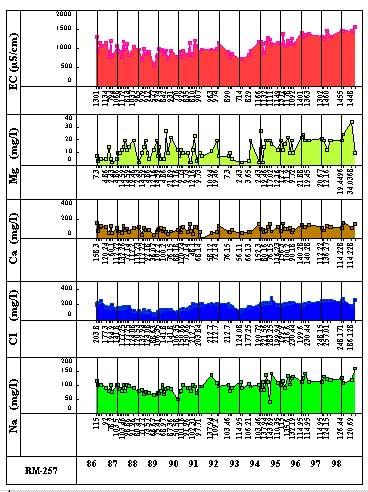
RM-257 |
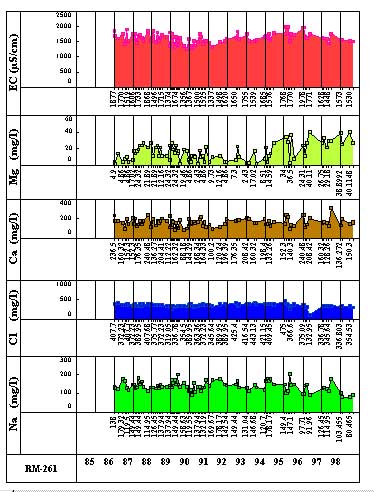
| RM-261 |
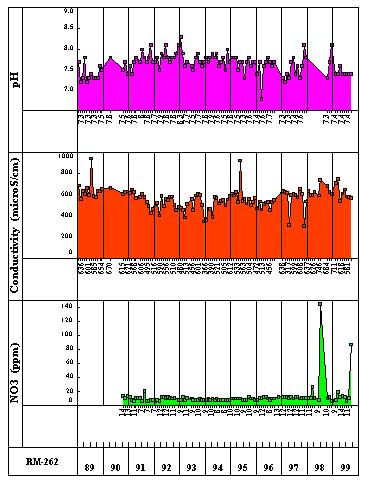
RM-262 |
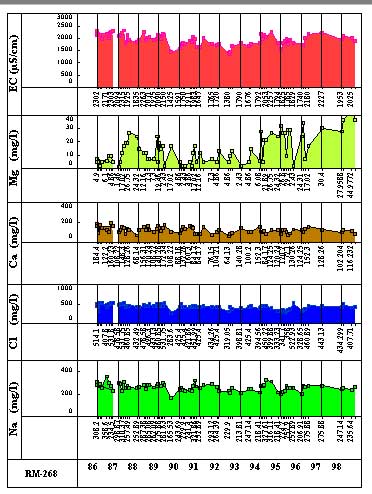
RM-268 |
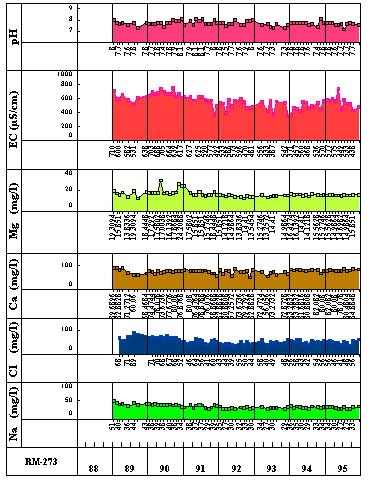
RM-273 |
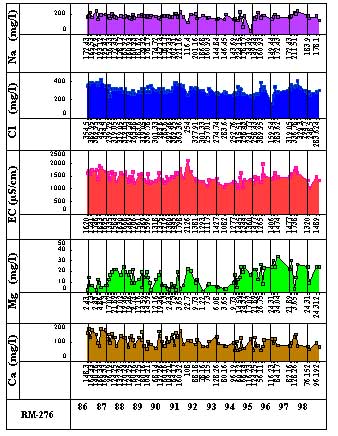
RM-276 |
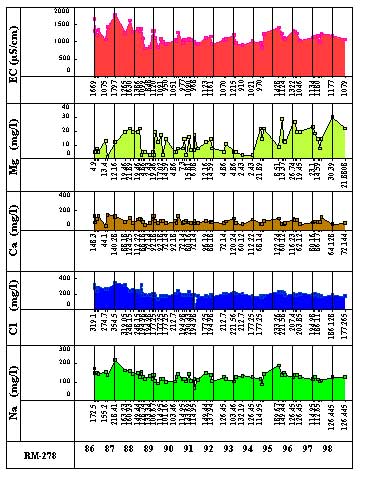
RM-278 |
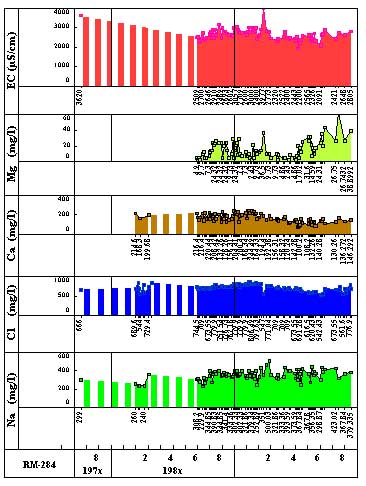
| RM-284 |
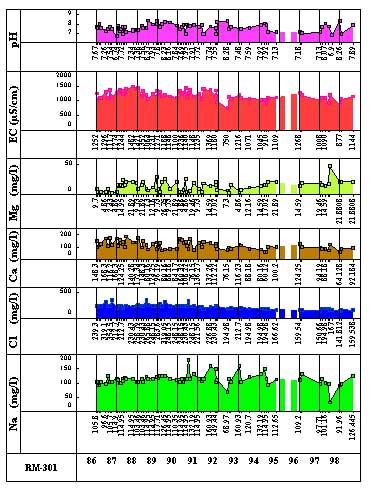
RM-301 |
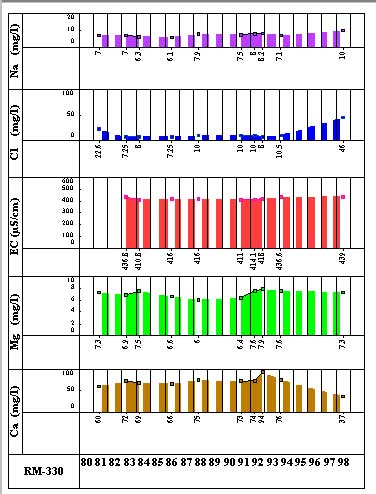
RM-330 |
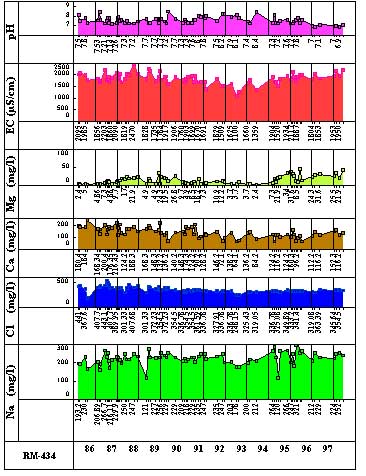
RM-434 |
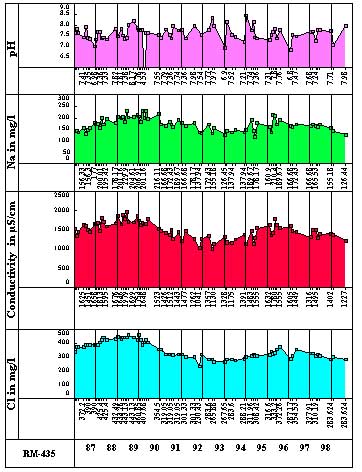
RM-435 |
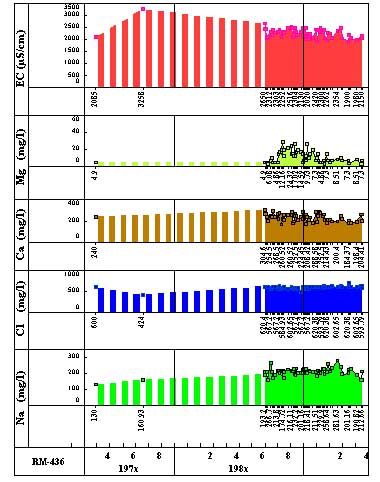
RM-436 |
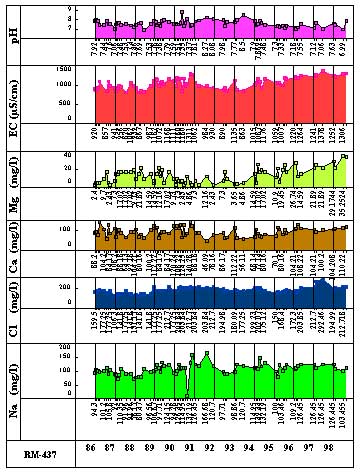
| RM-437 |
RM-450 |