choeller Diagram with Samples from NWC Wells
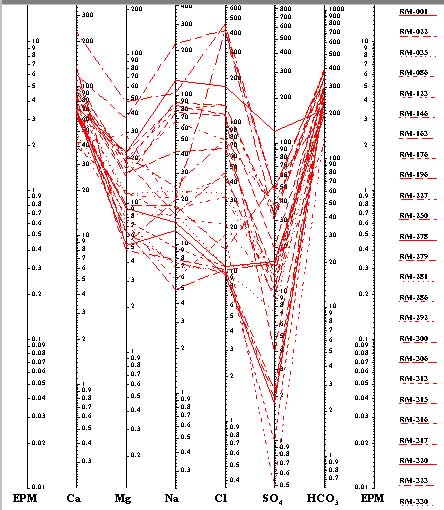
 bout 28 samples are displayed on this cumulative diagram. It shows the range of values (in parts per million) for major ions. The National Water Commission (NWC) wells are used for water supply (drinking and domestic) of villages and towns. The comparison between maximum field values and maximum permissible concentrations (by WHO standards) is shown in table below.
| Ion | NWC Wells | WHO and EPA Standards |
| Ca | 230 | |
| Mg | 50 | |
| Na | 220 | |
| Cl | 460 | 250 |
| SO4 | 120 | 250 |
| HCO3 | 400 | |
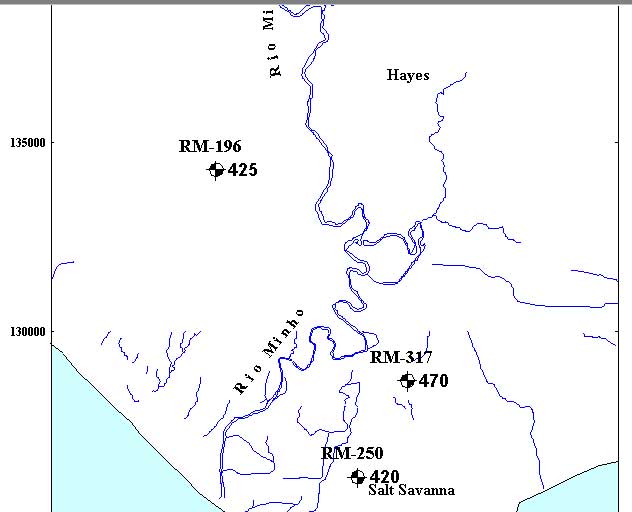
While sulphates are not a problem, the chloride content is higher than permissible in three wells used for water supply. The location of these wells is shown in the map below.