The ONFS data processing is based on Siegert relation; the correlation function is evaluated by Eq. (5.23). First, we average the correlation functions of each image. The error in the evaluation of the intensity correlation decreases as the square root of the number of the samples, and this dependence is intrinsic in the stochastical nature of the technique. Then, we evaluate the field correlation function, by extracting the square root of the difference between the mean intensity correlation and the square mean intensity. Thus we obtain a quantity which converges to the field correlation function as the fourth root of the number of samples.
On the contrary, ENFS gives directly the correlation function without any extraction of square root. We can notice that the plateau of Fig. 6.6 and 6.7 are more plain than in Fig. 5.9 and 5.10. The noise on the plateau is then spread across all the power spectrum when the Fourier transform is performed.
The situation is worst than in dynamic light scattering. The reason is that
we are working in two dimensions: in order that the power spectrum
can be evaluated, the correlation function must approach 0 faster than
![]() , while in one dimension, it must be faster than
, while in one dimension, it must be faster than ![]() . We
can perform an angular mean, but we gain only a term
. We
can perform an angular mean, but we gain only a term ![]() .
.
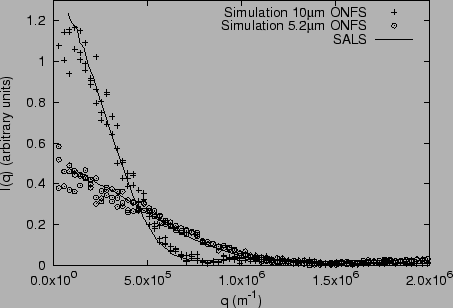
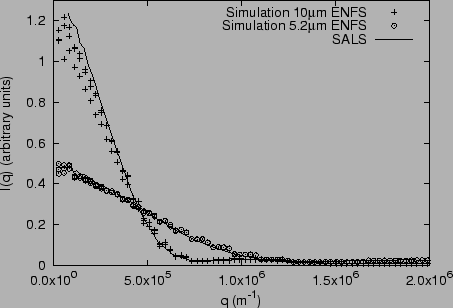
These considerations should explain why ONFS data are much less accurate than ENFS and SALS ones: the problem is the slow statistical convergence as the number of samples increases. In order to test this explanation, we performed some numerical simulations. We used the SALS data to simulate a power spectrum. We created one hundred random fields, with gaussian probability and the given power spectrum. We obtained the homodyne and heterodyne signals, thus creating images similar to the ones we acquired during the experiments. Last, we processed the data with the above described algorithms. The simulations are only affected by the statistics: they are virtually free from any experimental error. In Fig. 7.8 and Fig. 7.7 we present, respectively, the results for the ONFS and ENFS simulations. They look quite similar to the corresponding experimental measurements of Fig. 7.6 and 7.3. This confirms that the main source of error, for our ONFS measurements, is the poor statistical quality of the samples. Since the quality increases as the fourth power of the number of the samples, we cannot make ONFS measurements better than ENFS ones, unless we process at least one million images: this is, for the moment, impossible.