Next: What is the main
Up: Performances of ONFS and
Previous: The samples.
Contents
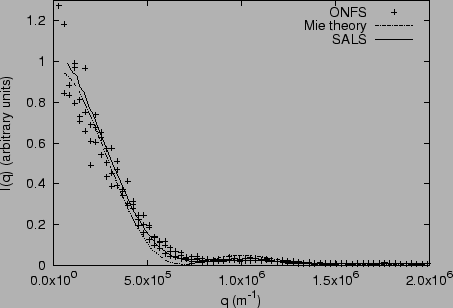
In Fig. 7.1, 7.2 and
7.3 are shown the results of ONFS
measurement. The same samples have been analyzed also by a SALS instrument;
the results are shown in the graphs.
Figure:
ONFS measurement
of the
 colloid. A SALS measurement and a theoretical
evaluation based on Mie theory are shown.
colloid. A SALS measurement and a theoretical
evaluation based on Mie theory are shown.
|
|
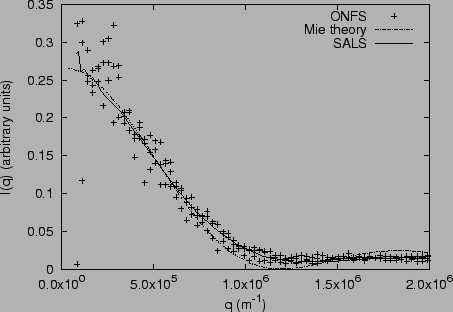
Figure:
ONFS measurement
of the
 colloid. A SALS measurement and a theoretical
evaluation based on Mie theory are shown.
colloid. A SALS measurement and a theoretical
evaluation based on Mie theory are shown.
|
|
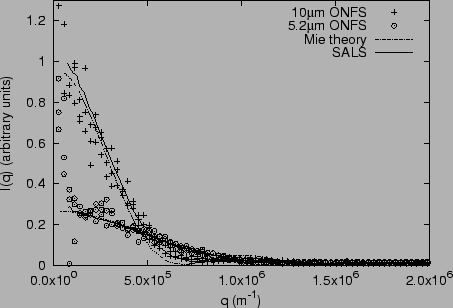
Figure 7.3:
ONFS measurements
of the two colloids. SALS measurements and theoretical
evaluations based on Mie theory are shown.
|
|
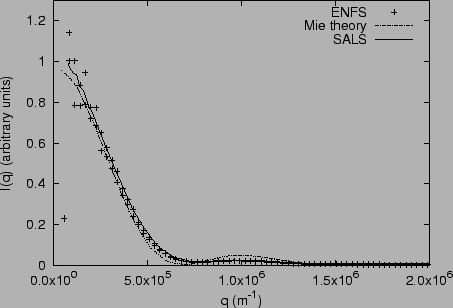
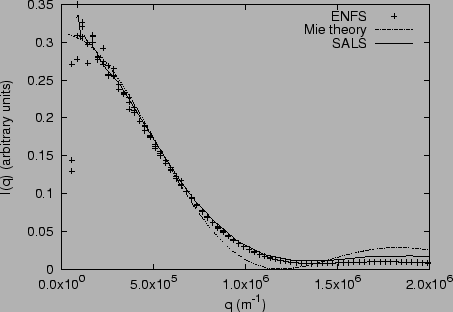
In Fig. 7.4, 7.5 and
7.6 are shown the results of ENFS
measurement. The same samples have been analyzed also by a SALS instrument;
the result is shown in the graphs.
Figure:
ENFS measurement
of the
colloid. A SALS measurement and a theoretical
evaluation based on Mie theory are shown.
|
|
Figure:
ENFS measurement
of the
colloid. A SALS measurement and a theoretical
evaluation based on Mie theory are shown.
|
|
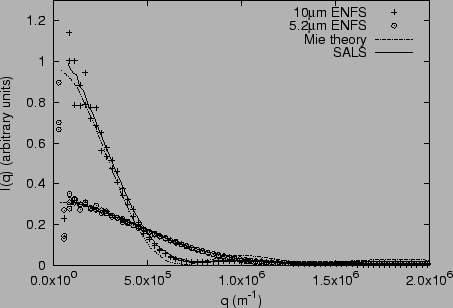
Figure 7.6:
ENFS measurements
of the two colloids. SALS measurements and theoretical
evaluations based on Mie theory are shown.
|
|
Both ONFS and ENFS measurements agree with the SALS measurement,
but ONFS gives less accuracy.
Next: What is the main
Up: Performances of ONFS and
Previous: The samples.
Contents
2003-01-09