
| Home |
| Communicating in the IT Industry |
| Working in the IT Industry |
| Computer Systems |
| Database Systems |
| Website Development |
| Event Driven Programming |
| Spreadhseet Modelling |
What is a spreadsheet used for? Spreadsheets are used to present almost any kind of information in a format that is easy for the user to understand. Spreadsheets can be used to present data such as financial income, exam results and professional progress. For a more detailed explanation of what spreadsheets are, please click here. |
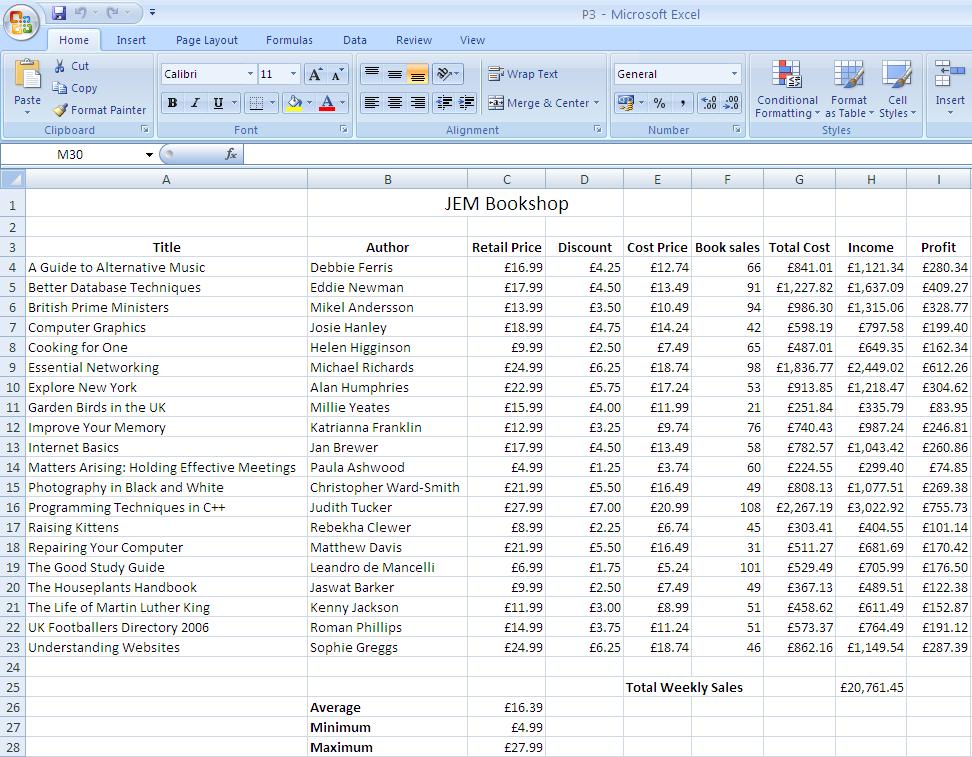 |
This is a screenshot of the task P3 that I completed for unit 27. It contains data for a bookshopm detailing the names of the books and the authors and how many books were sold in a week. The spreadsheet can then be used to work out calculations such as profit and income. Please click the screenshot to be taken to the full document. |
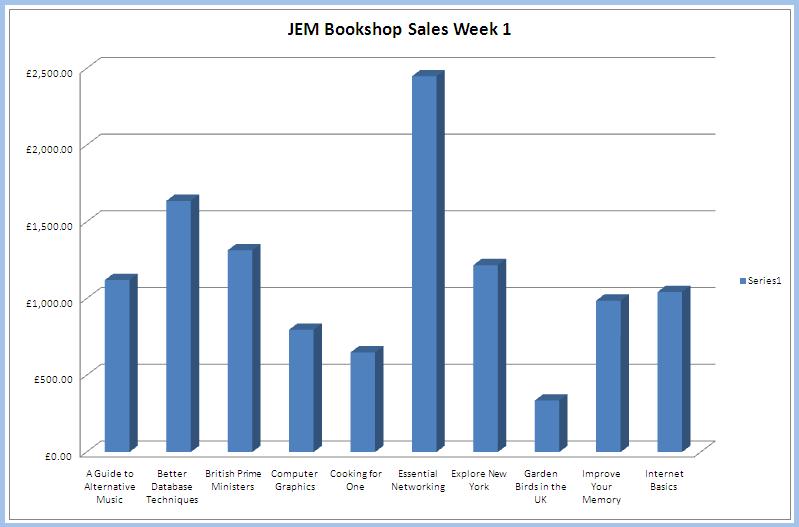 |
This is a screenshot of the graph that I generated from the screenshot of P3 shown above. It is of the books sales for week 1. This is done by simply highlighting the data you want to display and then choosing the format in which you want to display it; in this case I chose a bar graph to make the information easy to interpret. To see the full graph, please click the screenshot above. |
 |
There are many advantages of using Microsoft Excel to produce computerised spreadsheets. Some are: -Calculations can be worked out quickly by the computer -Data is presented in a tidy manner - Data can be easily presented in different formats such as graphs and chart (making it easier for the data to be intepreted) -Cells can be formatted so that they only show one type of information, for example currency. |
What is this unit about? The Spreadsheet Modelling unit is about lerning how spreadsheets are used.You also learn how to carry out steps to tell the computer to work out specific calculations. Steps are taken to show you how you can present data using different graphs and charts in order to make the data easier for users to understand and interpret. My review of the unit I enjoyed the unit as I learned about all of the different advantages of using computerised spreadsheets. I found it interesting to know that the computer can carry out many different functions alot easier than a human can! I also found it intersting to know that you can generate different graphs and charts to present information, and I will probably use alot of the things that I learned in my future career. |