![]()
![]()
![]()

|
|
|
|
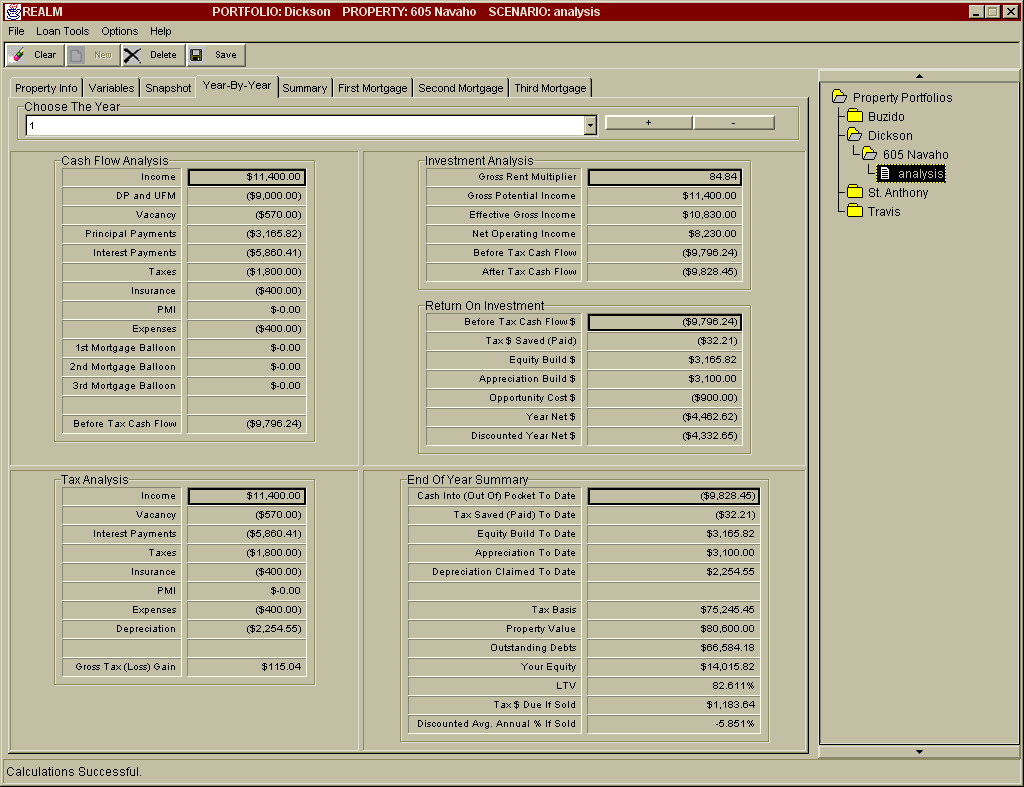
This tab lists all the numbers for the investment analysis broken out by year (for years 1 through 30). These are the core investment data from which other Tabs pull their data for presentation to the user. The data displayed is for a single year. You can see the numbers for any of the first through thirtieth years. To display data for a different year, you have two options:
There is a lot of data presented on this Tab for each year. It is broken down into five main areas: a Cash Flow Analysis, a Tax Analysis, a traditional Investment Analysis, a Return on Investment analysis, and an End Of Year Summary.
|
|
Send mail to [email protected] with
questions or comments about this web site.
|