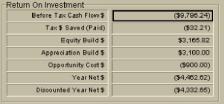
| Before
Tax Cash Flow. This number is the cash flow generated before any income
taxes are considered. This is the exact same number computed in the Cash
Flow Analysis. |
| Tax
$ Saved (Paid). This number is the actual amount saved (or paid) on income
taxes. It is computed by taking the Gross Tax
(Loss) Gain and multiplying it by the Marginal
Tax Rate. |
| Equity
Build $. This number is the total number of dollars applied towards principal
for all the loans on this property. |
| Appreciation
Build. This number represents the amount of dollars that the property has
appreciated this year. It is
computed by taking the Property Value at the end
of the previous year (make sure to look at the previous year’s data) and
multiplying it by the Appreciation Rate. |
| Opportunity
Cost $. This number represents this year’s opportunity cost of using the
money required for the Down Payment and
Up
Front Money for this investment instead of elsewhere. The calculations
use the Opportunity Cost value. |
| Year
Net $. This number is the dollars netted this year from this investment.
It is simply the sum of the before tax cash flow, tax dollars, equity
build dollars, appreciation build dollars, and opportunity cost dollars.
This number represents the total dollar return for this investment for this
particular year. |
| Discounted
Year Net $. This number is the Year Net $ discounted to today’s dollars
using the Discount Rate. This number
represents the total dollar return for this investment for this particular
year in today’s dollars. |