![]()
![]()
![]()

|
|
|
|
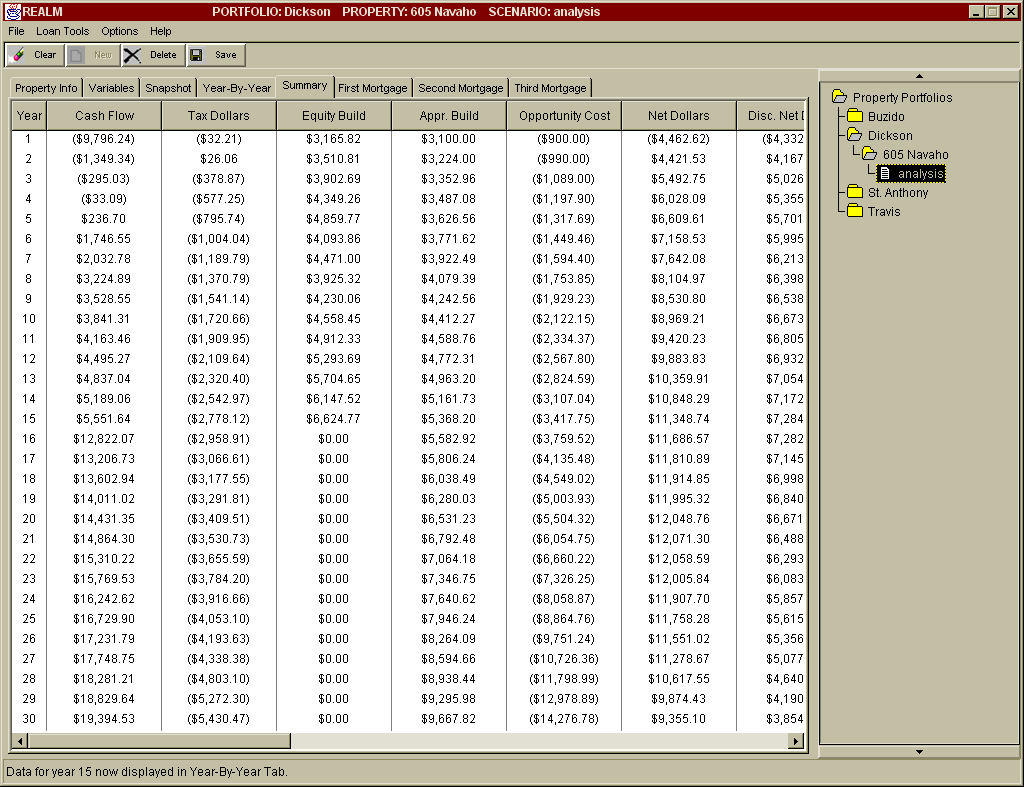
This tab displays a table with the investment numbers for all 30 years summarized. It provides a convenient place to analyze the investment data over 30 years. All the data in this Tab are pulled from the yearly data presented in the Year-By-Year Tab. Note that the columns in this table can be dragged to different positions. This is especially helpful when scrolling to data in the middle columns of the table. When you do this, the “Year” columns are not visible so it is difficult to quickly determine what data corresponds to which year. Simply right-click the “Year” column header and drag it to another column location as shown in the example below. This can be done with any column, not just the “Year” column.
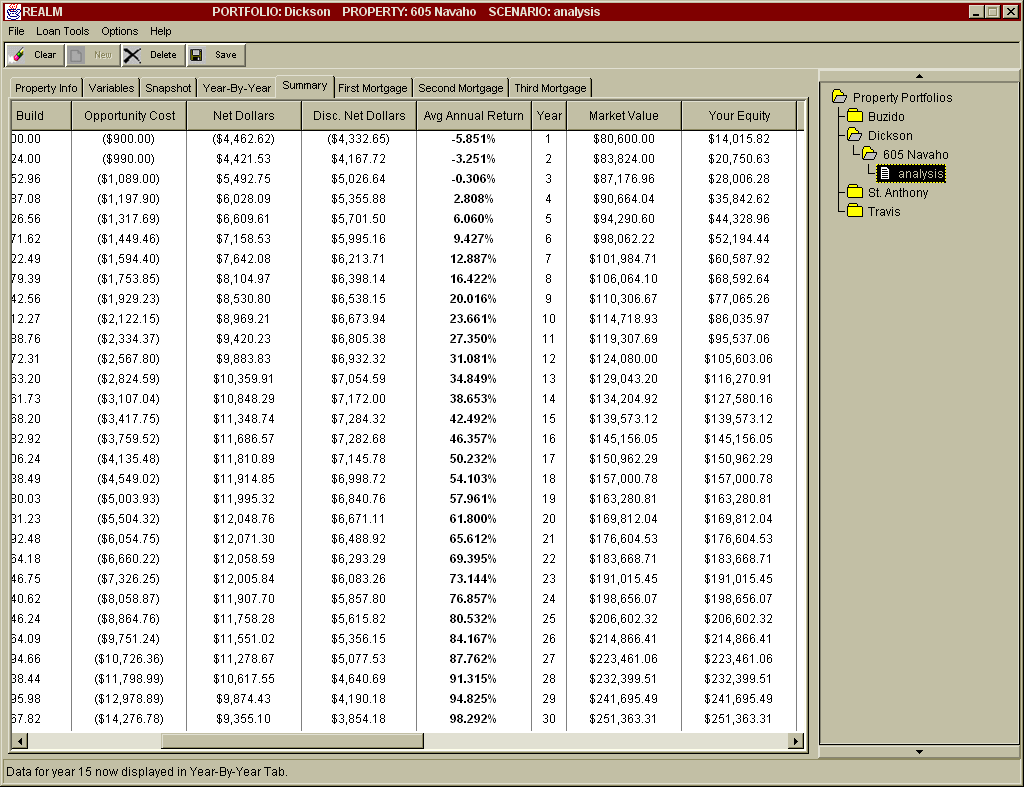
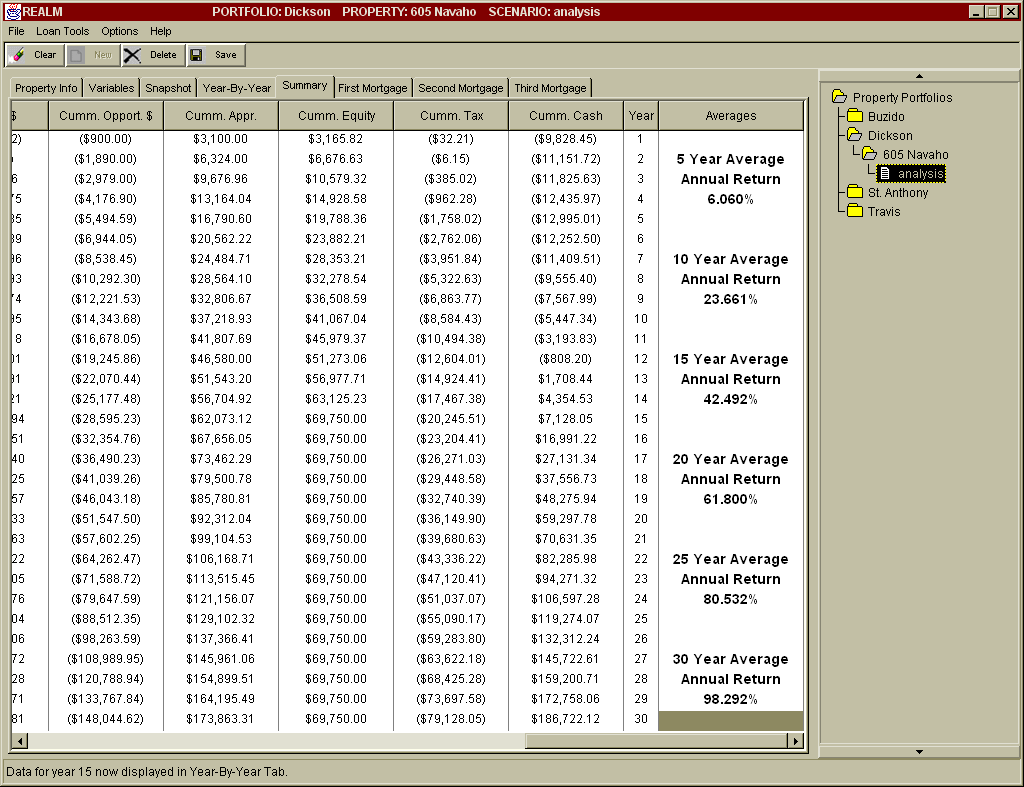
Scrolling the horizontal scrollbar to the right end will allow you to see 5, 10, 15, 20, 25, and 30 year Average Annual Returns as shown in the example below.
|
|
Send mail to [email protected] with
questions or comments about this web site.
|