|
Republic of the Philippines PROVINCE OF BOHOL
Geographic Information System (GIS) Section |
|
|
What is GIS? |
|
|
What is GIS? What is GIS? |
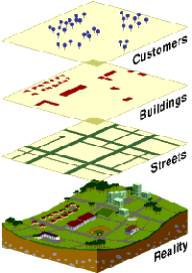
Layers of data are organized to be studied and to On a GIS, users search the attribute data and relate it
to the spatial data. Therefore, a GIS can combine geographic and other types
of data to generate maps and reports, enabling users to collect, manage, and
interpret location-based geographically referenced information. There are two main classifications of geographic data:
spatial data and attribute data. The two most popular types of spatial data are raster
and vector. Raster references spatial data according to a grid of cells (or
technically called “pixels”), whereas vector data references spatial data to
a series of coordinates. Raster data consist of different numerical values
assigned to individual pixels. Raster data Attribute data are descriptions, measurements, and/or
classifications of the geographic features. Attribute data can be classified
into 4 levels of measurement: nominal, ordinal, interval and ratio. The
nominal level is the lowest level of measurement in which the data can only
be distinguished qualitatively, such as vegetation type or soil type. Data at
the ordinal level can be ranked into hierarchies, but such differentiation
does not show any magnitude of difference. Examples of this ordinal data
include stream order and city hierarchies. The interval level of measurement
indicates the distance between the ranks of measured elements, but a starting
point is arbitrarily assigned. The best example of interval measurement is
Celsius temperature, in which 0 degrees Celsius is an arbitrary value, and 20
degrees Celsius is not twice as hot as 10 degree Celsius. Ratio measurements,
the highest level of measurements, includes an absolute starting point. Data
of this category include property value and distance. Time can also be considered a data element, since
geographic information often changes over time. For instance, a river course
may meander over time, or river dimensions may undergo sudden changes during
to floods, living patterns of a certain kind of wildlife may change, and land
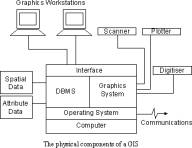
use may change due to agricultural to industrial use. There are three main components of a GIS: hardware,
software and human resource. GIS hardware includes: computers, computer
configuration/networks, input devices, printers and storage systems.
Computers for GIS usage can be PCs at the low end, or supercomputers and
X-Terminals at the high end. These computers can be stand-alone units or can
be hooked into a network environment. Input devices include digitizers and scanners.
A digitizer is a device used for selecting features from a hard copy map,
which are then registered to a coordinate system. Currently, digitizing is
the most common method for converting existing maps and images into digital
form. However, this process can be tedious, especially when converting
high-density maps. Scanners sometimes can replace digitizing by automatically
converting hard-copy maps to a digital raster file. Once in a GIS, the raster
image can be converted to vector format through a “raster-to-vector”
conversion. The third hardware component is the printer/plotter. These
devices are used to produce a hardcopy map. There are several types of
printers including: matrix, inkjet and laser. Plotter types include: laser,
electrostatic, direct thermal, pen plotter and inkjet. Finally, GIS storage
systems include: optical disks, magnetic disks (such as a hard drive), floppy
disks or magnetic tapes. GIS related software includes both the GIS program and
special application packages, such as digital terrain modeling and network
analysis. The main difference between GIS software programs and desktop
mapping programs is the ability of GIS programs to perform spatial analysis.
Examples of GIS software packages include: (1) Modular GIS Environment by
Intergraph Corp., (2) Geo/SQL by Generation 5 Tech. Inc., (3) ARC/INFO by
Environmental Systems Research Institute Inc., (4) SPANS by Tydac
Technologies, (5) FMS/AC by Facility Mapping Systems Inc. Desktop mapping
programs offer many of the same features as a GIS, but their ability to
support spatial analyses are limited. They are developed to satisfy
individual user needs for mapping presentations. Some examples of popular
desktop mapping programs include: (1) Map Info developed by MapInfo Corp.,
(2) Atlas GIS by Strategic Mapping Inc., (3) MapGrafix by ComGrafix Inc., (4)
QUIKMAP by AXYS Software Ltd., etc. Public domain GIS software packages are
GIS programs developed by government and universities, available free or for
a nominal cost. Examples of such GIS programs include () IDRISI by Clark
University, (2) GRASS by the GRASS Information Center and (3) MOSS by
Autometric Inc. Human resources used to operate a GIS typically
include: operational staff, technical professional staff, and management
personnel. Operational staff are people such as (1) cartographers, who
monitor the design of map displays, the standards for map symbols and
standard map series (2) data capturers, who converts map into digital form
and (3) potential users of a GIS. Technical professional staff include (2)
information analysts who solve particular user problems and satisfy their
information needs, (2) system administrators, who are responsible for keeping
the system (hardware/software) operational, (3) programmers, who translate the
application specifications prepared by the analyst into programs and (4) the
database administrator, who assists the analysts, programmers and users to
organize geographic features into layers, identify sources of data, develop
coding structures for non-graphics data, and document information about the
contents of the databases. Management personnel include (1) the manager, who
monitors the daily performance of the GIS project implementation team and
manages the output production as required by the organization and (2) the
Quality Assurance coordinator who manages the output of the final product to
ensure that it meets the conversion specification and data acceptance plan. Environment.
Environmental fields have long used GIS for a variety of applications that
range from simple inventory and query, to map analysis and overlay, to
complex spatial decision-making systems. Examples include: forest modeling, air/water quality modeling
and monitoring, environmentally sensitive zone mapping, analysis of
interaction between economic, meteorological, and hydrological &
geological change. Typical data input into an environmental GIS include:
elevation, forest cover, soil quality and hydrogeology coverages. In many cases, environmental GIS are used so that
environmental considerations can be better incorporated into socio-economic
development enabling a balance between the two. Infrastructure and Utilities. GIS technologies are also widely applied to the
planning and management of public utilities. Organizations dealing with
infrastructure and public utilities find GIS a powerful tool in handling
aspects such as planning, decision support, customer service, regulatory
requests, standardization of methods, and graphics display. Typical uses include management of the following
services: electric, gas, water, roads, telecommunication, storm sewers, TV/FM
transmitting facilities, hazards analysis, and dispatch and emergency
services. Typical data input includes street network, topographic data,
demographic data and local government administration boundary. Business Marketing and Sales. The use of GIS in business has greatly enhanced the
efficiency in a number of areas, especially marketing research. Examples of
the use of GIS in business include: locating potential competitors, mapping
market thresholds for retailers, providing computerized hazard information
classifications, aiding risk management decisions in insurance companies, and
enabling real estate agents to handle property data more efficiently. Delivery services also utilize GIS in aspects such as
navigation & monitoring of their fleets, routing optimization for
shipping and deliveries, geocoding address matching, and location searches.
Typical data input into this category include road networks, street
addresses, business profiles, and socio-economic profiles. Computer Cartography. The growth of computer-assisted-cartography (CAC) has been largely
dependent on the development of vector-based GIS. With the help of GIS,
cartographic tasks such as thematic overlays of information, map projections,
and map sheet layouts can be performed much more conveniently. Continually updated geographic databases provide an
easy way to produce new map editions. Automated map-making and virtual map
images have replaced traditional paper maps in many applications. Web-based
maps have made general-purpose navigation far more accessible to the public. However, manually digitized paper maps remain the primary
form of data input in an automated cartography GIS. Scanned maps are also
often used. Land Information.
GIS has aided management of land information by enabling easy creation and
maintenance of data for land records, land planning and land use. In particular,
a flourishing number of municipal governments have started to implement GIS
to help manage their land information. GIS makes input, dates, and retrieval
of data such as tax records, land-use plan, and zoning codes much easier then
during the paper-map era. Typical uses of GIS in land information management
include managing land registry for recording titles to land holdings,
preparing land-use plan and zoning maps, cadastral mapping etc. Input of data
into a land information GIS includes: political and administrative
boundaries, transportation, and soil cover. |