Breast Cancer Prognosis Using Image Processing
Results
Breast Cancer Prognosis Using Image Processing
Results
|
|
Breast Cancer Prognosis Using Image Processing Results |
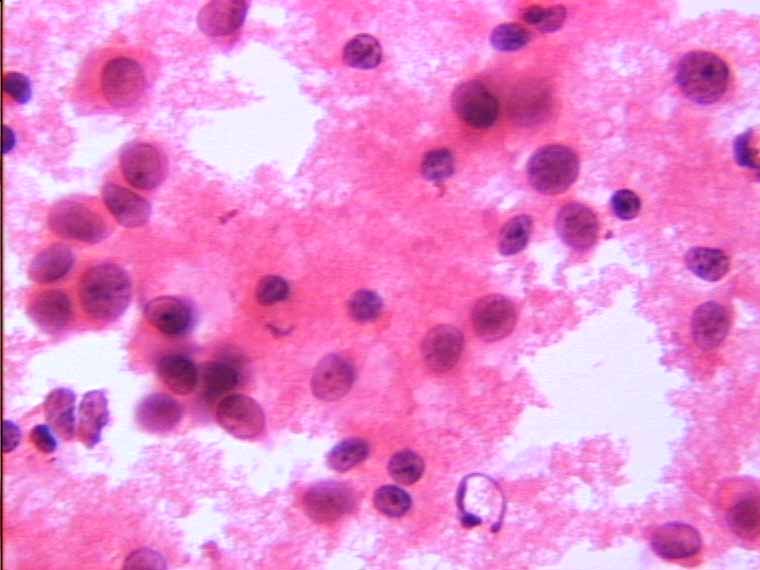
Results of Classification Using the C5.0 Intelligent Machine and 10 fold cross validation.
Analysis What the above table is saying is: Five class 4 grades were successfully classified. Three class 3 grades were successfully classified. Six class 3 grades were misclassified as class 4. Eight class 4 grades were misclassified as class 3. One class 1 grade was misclassified as class 3. Two class 1 grades were misclassified as class 4. One class 2 grade was misclassified as class 3. One class 2 grade was misclassified as class 4. One class 4 grade was misclassified as class 1. If we look at the table using an out-by-one strategy nearly all of class 3 and class 4 grades were successfully classified, except for one (a class 4 but classified as a class 1). The classifications of grade 1 and 2 are very poor but if we examine the frequency at which they appear within the data set it is possible that not enough examples existed to enable a correct classification.
The incorrect classification of class 1 and class 2 may be due to the fact that not enough cases existed to enable a correct classification. The method used to analyse the data (10 fold cross validation) will use the majority of the cases to build a classifier then test the classifier on the remaining cases, as only a few cases exist for class 1 and 2 it meant that if they were in the classifier then they couldn't be tested, if they weren't used in the classifier then no cases existed to test it and if some of the cases were present in the classifier not enough knowledge (because of the lack of cases) was built to test the remaining classes. |
|
Home |
Overview |
Abstract |
Main |
Results |
Future |
References |
Download |
Terminology |
Links |
About The Author |
Contact us
Copyright © 2002 Nick Bryan All rights reserved. |