Breast Cancer Prognosis Using Image Processing
Main
Breast Cancer Prognosis Using Image Processing
Main
|
|
Breast Cancer Prognosis Using Image Processing Main |
|
As mentioned before the concept of this study is the validity of using a computer in the prognosis of breast cancer. This project is divided into 3 stages:
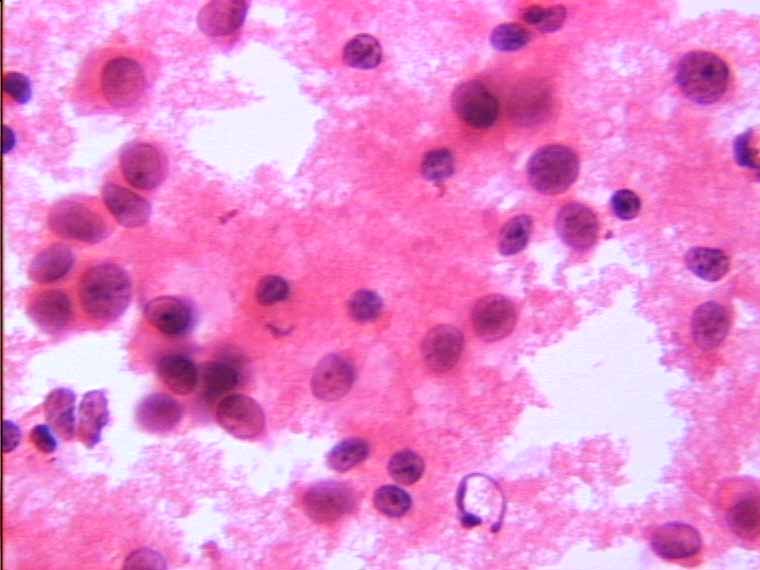
This involves segmenting the cells from the background, below is an image containing breast cells. 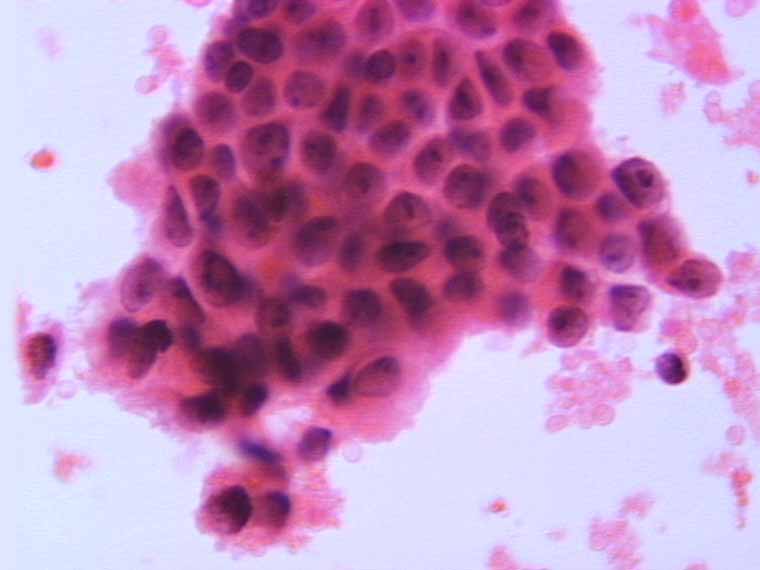 The method of segmentation that I chose to develop is based on the histogram of the image but there are alternatives such as (a) the Hough transform and (b) ************. The link below will take you to a page depicting the image processing algorithm that automatically segments the Cells Nucleus from the background. Click here for Segmentation algorithm which was implemented using an Image Processing Toolkit from WIT Select below for example images processed by the Segmentation Algorithm. Example 1 Example 2 The algorithm is relatively fast, low memory intensive and automatically detects a high percentage of Nuclei within a given sample. Data collected about the detected Nuclei was then written to a file so as to quantify prognostic indicators, as shown below.
These data files contain the required information for us to quantify the prognostic indicators. Stage 2: Quantification of prognostic indicators The prognostic indicators used in this study are as follows (for a more details regarding prognostic indicators refer to section 2 of the project report - Literature Survey which is accessible via the download page).
The number of pixels of each detected object are summed, the mean size is then calculated. This measured by taking the Standard Deviation of the compactness ratio. This indicator was quantified by calculating the mean of the distances between the center of each cell to its nearest neighbour. Distance = sqrt ((x2 - x1)sqr + ( y2 - y1 )sqr ) This indicator can be determined by calculating the mean compactness ratio, as follows: compactness = area/(perimeter length)sqr The segmentation algorithm was applied to each image in the data set of which there were 30. The prognostic indicators were then calculated for each image. An example of the the quantified prognostic indicators can be seen below.
Stage 3: Classification & Results The cells that were the study of this project have already been graded using the Nottingham Prognostic Index, this is a well known and respected prognostic indicator. So now there exists an exact value that represents a prognosis and 4 prognostic values, all tha remains is to test to see if a correlation exists between the calculated prognostic values and the known prognosis. Some of the data that has been collected for each image will be used to build a classifier, this classifier will then be tested on the remaining set of data, this is known as cross validation. The system used to build the classifier is called C5 The data file containing the calculated prognostic values along with corresponding NPI scores can be viewed here . NEXT |
|
Home |
Overview |
Abstract |
Main |
Results |
Future |
References |
Download |
Terminology |
Links |
About The Author |
Contact us
Copyright © 2002 Nick Bryan All rights reserved. |