Departmental Processing
Turnaround Estimation Project
| Home |
| Problem definition |
| Data collected |
| Regression model |
| Analysis |
| Stepwise |
| Final model |
| Forecast Model for Duration |
| Load Chart |
Recommendations for Future Work:
Although we found an overall good estimate model, we still feel that there are many areas of this analysis that could be improved, to provide a more accurate prediction model, as follows:
-
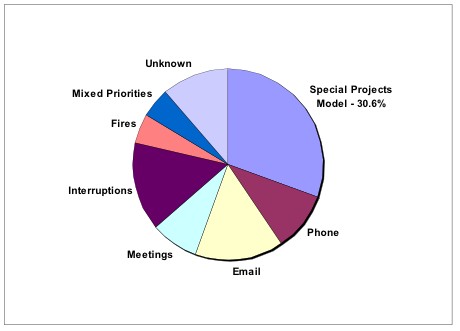
Collect a more comprehensive array of data such that the estimation model more fully explains the variations in the data set. As could be seen in the calculations, the resulting model only explained 30.6% of the variation in the data set, indicating that approximately 69.4% of the data set variance was influenced by forces/variables not measured in the Special Applications Database. Some of these forces are detailed in general form in Figure 4 in the Figures and Tables section of this report. Every “non-value added” task that takes time away from the direct job of completing a special design influences the final duration or lead-time of this job and therefore of the efficiency of the department. Determining what these factors are and how much department time they absorb will be key in creating an improved prediction model.
- Break Dummy Variables down into smaller quantitative components. Although each form type represented in the Order Engineering Special Applications Database signifies a different “product”, the subtasks (i.e. Drawings, Costing, BOM, etc) required to create these “products” are often similar but not always consistent from form to form or job to job. By quantifying the tasks that make up each form for each job, it could minimize the binary effects the dummy variables have on the model and replace the subjective Category variable altogether since the quantified, objective sub-tasks are often what is used to determine the value of the qualitative Category in the first place. Reducing the number of qualitative dummy variables may also influence the regression analysis in a way that will include more of the variables currently labeled as insignificant now.
- Analyze the collected sample data with a non-linear method such as multi-order polynomial regression or neural-network analysis. As could be seen in the earlier discussion of the Residual plot in Figure 3, in the Figures and Tables section of this report, the increasing spread of the residual plot points indicates a non-linear pattern in our data set that cannot be fully explained within a linear model.
- Review the operation of the department within the context of production and/or capacity planning processes to determine the theoretical design and effective capacity of the department given current department personnel, facilities, “systems”, etc.