


|
|
|
|
|
|
|
|
||
|
|
|
||
|
|
|
|
|
|
|
|
||
|
|
|
||
|
|
|
||
|
|
|
||
|
|
|
||
|
|
|
||
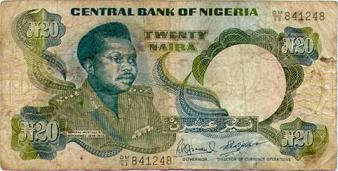
Nigeria uses the currency Naira (NGN). In year 2001, 111.23NGN was equivalent to $1 US, their currency has been getting weaker for several years because in 1998 it took only 21.89NGN to make $1 US. As you can see in the chart most of their export is petroleum related products. It’s a very oil rich country but its economy has suffered much because of the instability and corruption the country has been suffering, but recently the new government has been reforming and has been improving slowly. They have had $1 billion credit from the IMF but later it was found out that it was much less. The IMF has been urging Nigeria to implement market-oriented reform such as the modernization of the banking system but the government lacks the efficient funds to do so.
Canada has a very strong economy which has a high-tech industry, market-oriented and has very high living standards. Since World War II, our country has turned from mainly rural to very urban. This is mainly due to the growth of the manufacturing, mining, and service sectors. A key strength in the economy is the extensive trade surplus. In 2002 one US dollar was worth $1.57 CDN.
| Economic Factors | Canada | Nigeria |
|---|---|---|
| GDP | purchasing power parity - $112.5 billion | purchasing power parity - $934.1 billion |
| Population Below Poverty Line | 60% | N/A |
| Inflation rate | 14.2% | 2.2% |
| Labor force | 66 million | 16.4 million |
| Budget | 10.99 per 1000 | 38.75 per 1000 |
| Death Rate | revenues: $3.4 billion expenditures: $3.6 billion |
revenues: $178.6 billion expenditures: $161.4 billion |
| Industries | crude oil, coal, tin, columbite, palm oil, peanuts, cotton, rubber, wood, hides and skins, textiles, cement and other construction materials, food products, footwear, chemicals, fertilizer, printing, ceramics, steel | transportation equipment, chemicals, processed and unprocessed minerals, food products; wood and paper products; fish products, petroleum and natural gas |
| Electricity Production | 15.67 billion kWh | 566.3 billion kWh |
| Electricity Production by Source | fossil fuel: 61.9% hydro: 38.1% other: 0% nuclear: 0% |
fossil fuel: 28% hydro: 57.9% other: 1.3% nuclear: 12.9% |
| Electricity Consumption | 14.55 billion kWh | 504.4 billion kWh |
| Export Commodities | petroleum and petroleum products 95%, cocoa, rubber | motor vehicles and parts, industrial machinery, aircraft, telecommunications equipment; chemicals, plastics, fertilizers; wood pulp, timber, crude petroleum, natural gas, electricity, aluminum |
| Export Partners | US 32.3%, Brazil 8.3%, Spain 7.2%, Indonesia 5.9%, France 5.6%, India 4.6% | US 87.7%, Japan 2%, UK 1.1% |
| Import Commodities | machinery, chemicals, transport equipment, manufactured goods, food and live animals | machinery and equipment, motor vehicles and parts, crude oil, chemicals, electricity, durable consumer goods |
| Import Partners | UK 9.6%, US 9.4%, China 9.3%, France 8.7%, Germany 6.8%, South Korea 6.1%, Netherlands 5.2%, Italy 4.7% | US 62.6%, China 4.6%, Japan 4.4% |
| External Dept | $29.7 billion | $1.9 billion |
| Economic Aid | Recipient: $250 million | Donor: $1.3 billion |
| Exchange Rates | Nairas per US dollar - NA (2002), 111.23 (2001), 101.7 (2000), 92.34 (1999), 21.89 (1998) | Canadian dollars per US dollar - 1.57 (2002), 1.55 (2001), 1.49 (2000), 1.49 (1999), 1.48 (1998) |
In conclusion, Nigeria has a much weaker economy because it is still a third world country while Canada is a first. I predict that in the near future Nigeria will not catch up to Canada, it will take them time to slowly put into place modern high-tech facilities and become market-oriented. I do think that maybe in about 20 years its economy will be as good as Canada’s.