|
Multiple Source Air Quality Modeler and Analyzer (RAM 1.0)
|
||||
|
Motor
Vehicle
Emission
Modeler/Analyzer
Single Chimney Emission Analyzer
River Self-Purification Modeler(1D)
Quasi 3-D Refined Flow/ Contaminant Transport Modeling (CFD)
Digital Visualization Technology
|
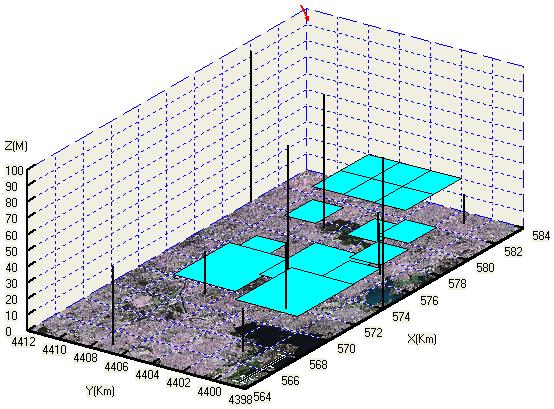
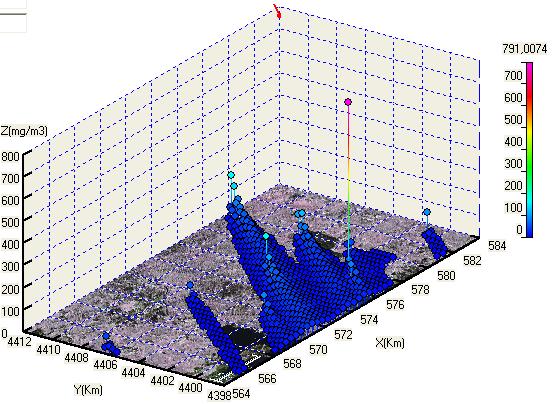
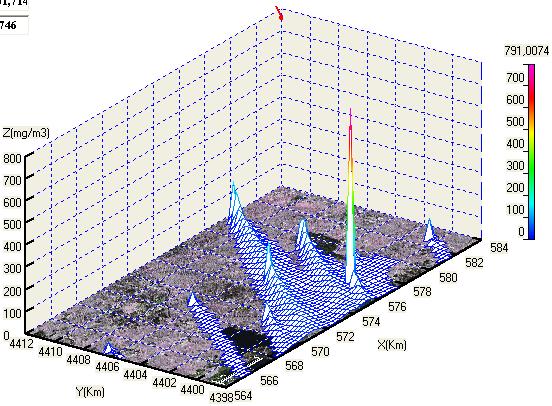
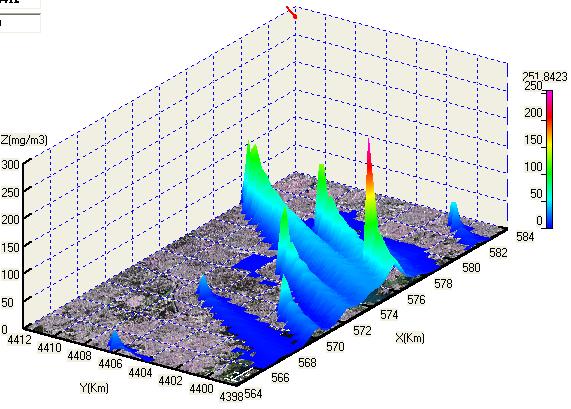
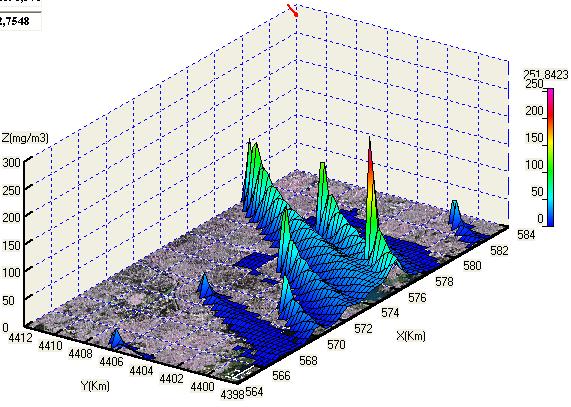
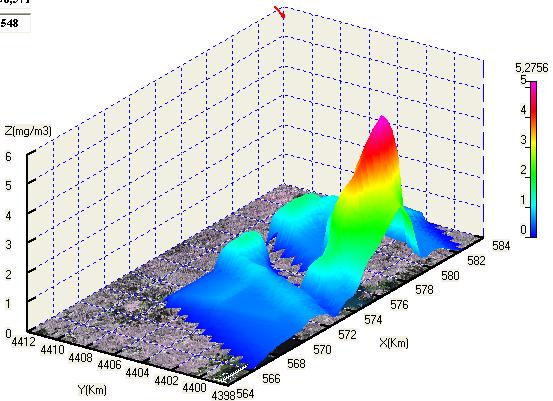
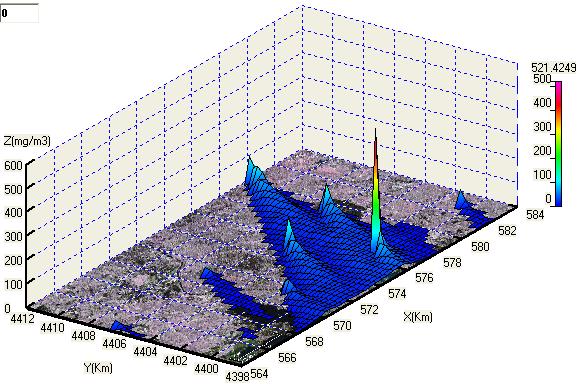
Multiple Source Air Quality Modeler and Analyzer (RAM 1.0, RAM - Regulatory Air Model) is a versatile Gaussian-plume dispersion model, developed originally by EPA (EPA - U. S. Environmental Protection Agency), with the support of RAM 1.0 Graphical User Interface (GUI), Map Support Tool, point-by-point analyzer and regional analyzer as well as help system. The software can be easily used in various Windows-based microcomputers. RAM 1.0 can provide various refined 2- and 3-D graphics both for emission sources and model-calculated results. The software also can display the X- and Y-coordinates and corresponding concentrations, either at given points by mouse move or in specified local region by drawing tools, both for generated 2- and 3-D figures. The graphical visualization functions of RAM 1.0 greatly help user to analyze and evaluate the model-calculated concentration fields. Following figures present a part of calculated results from one example (concentrations of contaminants in mg/m3 , receptor height = 0 m). Please click Albums for viewing more calculated results of this example.
Point- and area-source
positions
SO2
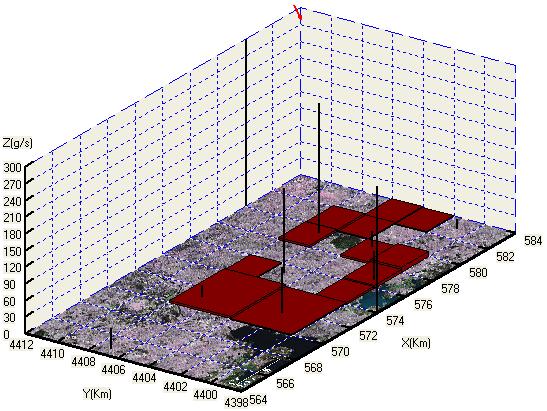
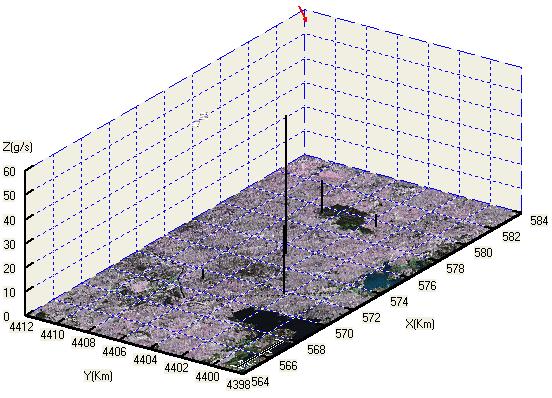
emission
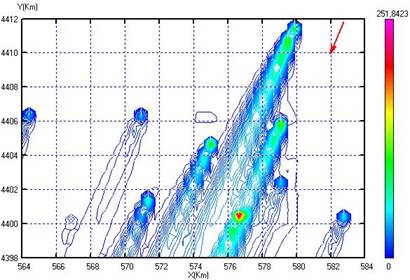
rates of point- and area-sources Particle emission rates of point-sources SO2 concentration at receptors caused by all sources at 1-hour Surface-wire plot of SO2 caused by all sources at 1-hour Surface plot of SO2 caused by all sources at 2-hour Surface-wire plot of SO2 caused by all sources at 2-hour Surface plot of SO2 caused by all area-sources at 2-hour Surface-wire plot of SO2 caused by all sources for 2 hours' average Color contour lines of SO2 caused by all sources at 2-hour
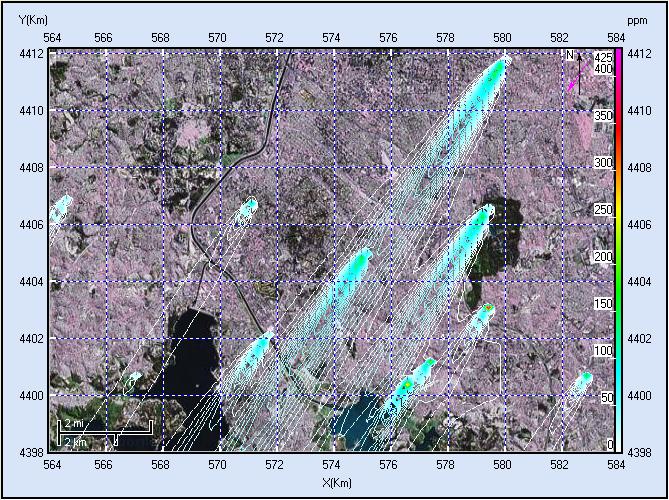
Google map and color contour lines of SO2 caused by all sources at 1-hour
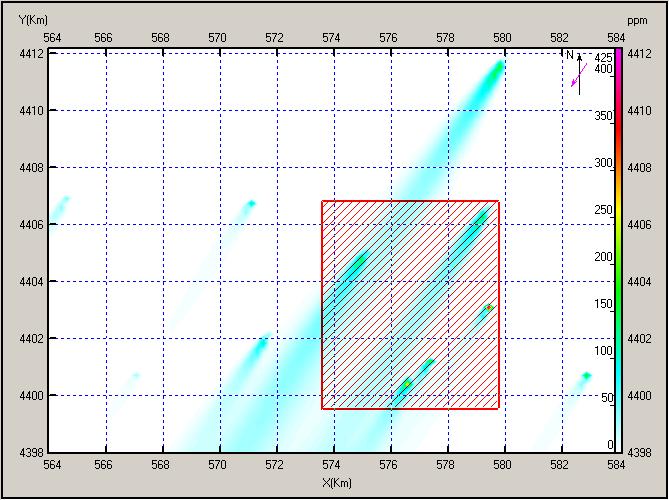
Image map of SO2 caused by all sources at 1-hour, with a local region (red line square), specified by the user through the drawing tools provided by the software. The position of this region and corresponding characteristic concentrations (maximum, minimum and mean) can be instantly displayed on table. |
|||