|

A businessman is often faced with the
challenge of making decisions based on probabilities. In many
situations the analyst is obliged to assume a normal distribution to
simplify the calculations, or the analyst has no sufficient knowledge
or tools to perform normality tests or a test of goodness to check if
the data fits to some other probability density function.
The purpose of the "Universal
Probability Calculator" is to calculate the probability of taking a
value greater or less than a specific value, given a set of data. The
method does not demand statistical knowledge from the user, there is no
need of normality assumptions, goodness test or transformations. The
proposed method is easy to be used, robust and many experiments have
evidenced its quality. The tool is implemented in VBA Excel,
so it does not require any installation and it has a friendly interface.
In the business world, both
in
manufacturing or service operations it is common to collect a sample
and then calculate probabilities that will support the decision making
process. In many cases, it is desired only
to calculate the probability in a simple and quick way and there is no
time or software to do deeper analysis. For example in industry, it is
possible to process a lot of parts in one machine and then estimate the
yield of that machine given a specified value. Or in a bank, given a
sample of the waiting time of the clients in the line, it desired
to calculate the probability to have a client waiting more than a
value specified by the law.
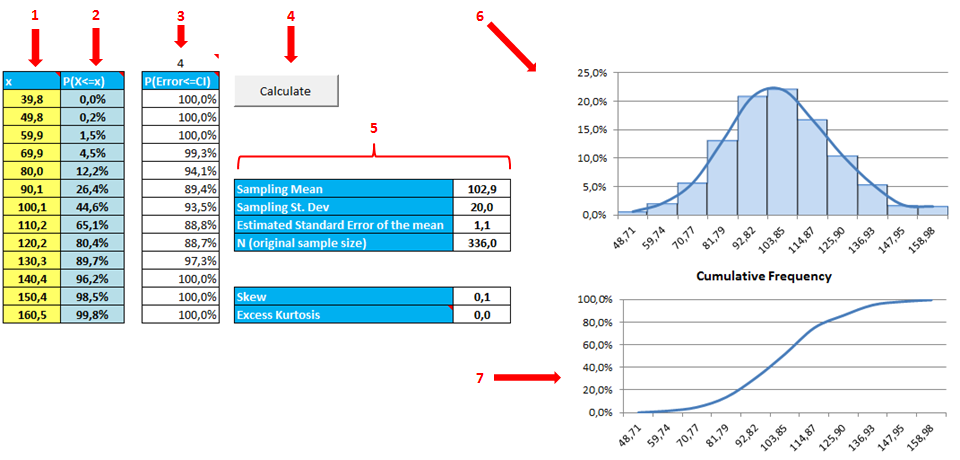
The interface of the tool is seen below in the figure 1.
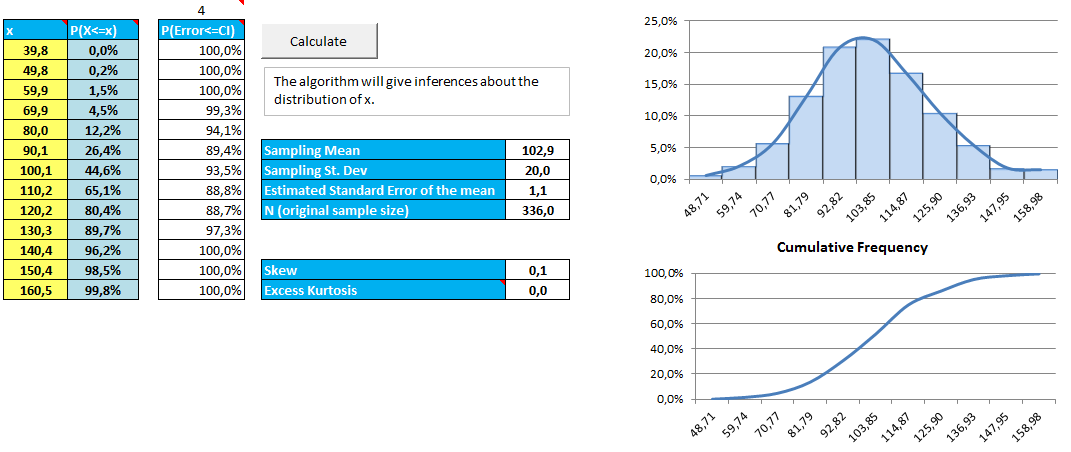
Figure 1: Interface
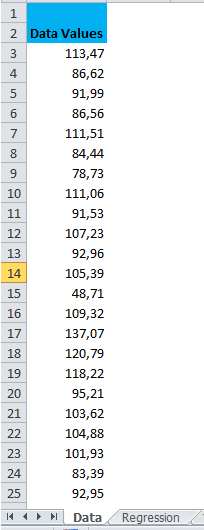
Considering it is an Excel tools, there
is one specific spreadsheet (1 column) to store the data set with the
samples. After that, the user just needs to specify in the yellow columns the values for which is desired to calculate the probability of
taking a value less than it, it means, P(X < x).
The interface is explained in the figure
2.
 |
Figure
2: Interface
|
The left
side of the figure 2 has the data set with the sample. The
field 1 has the cells where the user should specify the values x
to calculate the probability P(X
< x). The field 2 is the result with the value of
the probability. The field 3 gives an important information about the
quality of the result, it gives the estimated confidence level
for the confidence interval specified by the user in the
first row of the column. For example, for the value x=80,it is 94.1%
confident that the true probability value is in the interval [12.2 -
4.0; 12.2+4.0] , or [8.2; 16.2]. The confidence interval is
specified by the user and the tools will calculate the confidence
level. Naturally, the higher the sample size, the higher the
confidence level.
The arrow 4 indicates the button the user needs to press in order to calculate the
probabilities. The field 5 gives information about the first four
moments of the distribution: mean, standard deviation, skewness and
excess kurtosis. If the skewness and kurtosis are close to zero, the
closer to a normal distribution the data is. In order to give a
quantitative information, a normality test based on " Pearson -
D'agostino Test" is performed and the p-value is calculated.
Usually, a p-value < 0.05 means the data does not follow a
normal distribution.
Finally,
the arrows 6 and 7 indicate the histogram and the cumulative
probability function for the data set.
You can
buy the tool for
only US$ 2.00.
The file will be sent to you via email in 2 days. For
additional support, submit the form by this link.
|