|

The
purpose of the "Robust Capability Analysis" is to give information
about the stability and capability of the process, given a set of data.
The method does not demand statistical knowledge from the user, there
is no need of normality assumptions, goodness test or transformations.
The proposed method is easy to be used, robust and many experiments
have evidenced its quality. The tool is implemented in VBA Excel,
so it does not require any installation and it has a friendly interface.
What is expected from a Control Chart ?
- Predict the process ability to
meet service expectations.
- Differentiate common cause from
special cause.
- Use it effectively to take
operational decisions on the floor.
Why is difficult to deploy an effective statistical process
control on the floor?
- Advanced statistical knowledge
- Statistic software
- I- Chart or p-Chart ?
- How to measure the Stability and
Capability of the process?
- What is the probability of
missing the target?
- What to do if the distribution
is not normal? Does it matter?
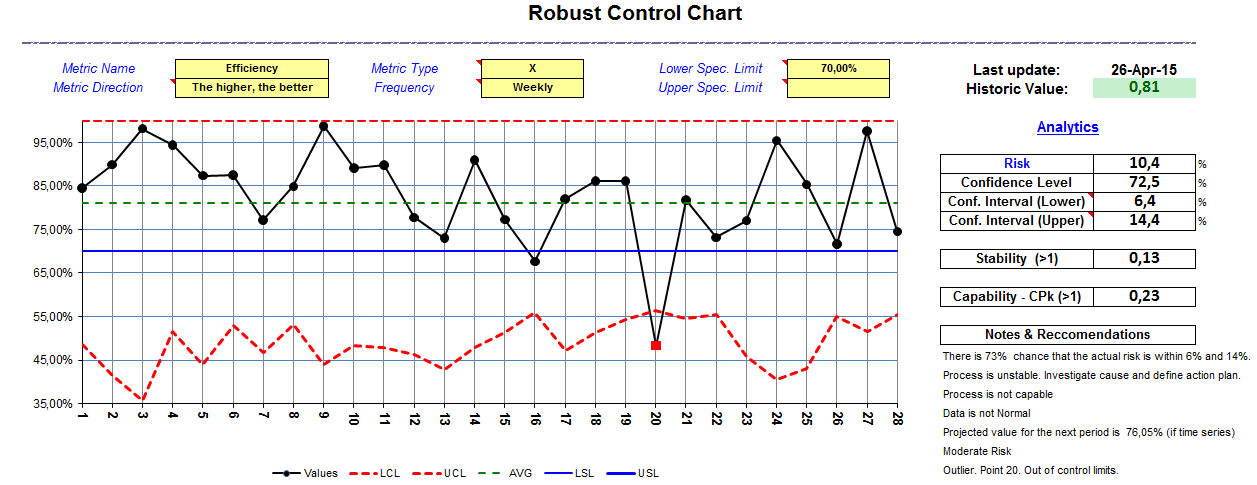
The interface of
the tool is seen below in the figure 1.
Figure
1
The figure 1 shows the
control chart (in this case a P-Chart). It is plotted the data points,
the control limits (red lines), the mean (green line), the
specification limits (the blue line, in this example there is only the
lower specification limit). In the right side there are some results:
the risk (probability of missing the targets), a confidence level and
confidence interval for the accuracy of the risk. Naturally it depends
of the quantity of data points. It is also calculated an stability
index, the capability index (lowest CPk). There is also an important
field with notes and recommendations that helps the user to interpret
the results (this is done because one purpose of the tool is to
delivery understandable results regardless the statistical knowledge of
the user).
The figure 2 gives the control chart
using the well-known statistical software "Minitab". So it is possible to
compare the charts.
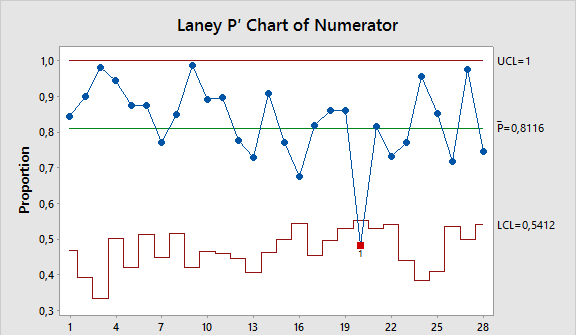
Figure 2
The figure 2 is very
similar to figure 1 and it evidences the quality of the results
provided by the tool. The Robust Control Chart gives
additional, simple and useful information. It is easy to be used
because the user does not need to know which type of control chart he
must use (it depends on the type of the data). The tool is able to recognize automatically if it should be used a P-Chart or I-Chart. The user only
needs to populate the yellow cells of the figure 1 and the data as
showed in the figure 3 below.
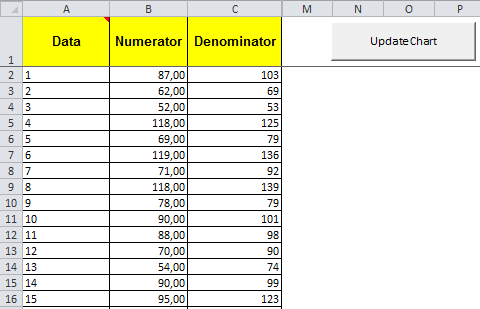
Figure 3
It is necessary to populate the 3
columns and press the button, the macro will build the correct type
of Control Chart. If the is no denominator for the data, just use the
value 1. The next figure gives an example for a case with continuous
variable, using I-Chart.

Figure 4
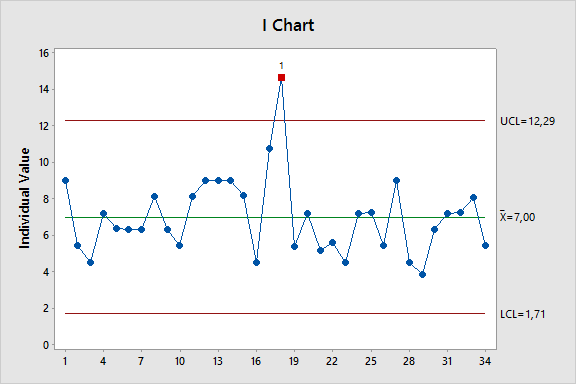
Figure 5
There are many other types of control
charts, but the goal here is to provide a simple and flexible tool that
is able to plot automatically P-Chart or I-Chart without demanding statistical knowledge from the user. The information provided by the
Robust Control Chart is useful in many practical situations to evaluate
the stability, capability and the risk of the process.
You can buy the tool for
only US$ 3.00.
The file will be sent to you via email in 2 days. For
additional support, submit the form by this link.
|