The purpose of the "Robust Daily Control Chart" is to give information
about the stability and capability of the process and also the actual
risk of missing the target by the end of the month. The
proposed
method is easy to be used, robust and many experiments have evidenced
its quality. The tool is implemented in VBA Excel, so it does
not
require any installation and it has a friendly interface.
There are
situations both in
manufacturing and service operations where the process is managed on
daily basis in order to reach a target by the end of the month.
The idea is to update the chart every day and then evaluate
the
current risk of missing the target of the month. The tool will provide
information about the necessary performance in the remaining days of
the month to reach the target.
An illustration of
the tool is seen in the figure 1.
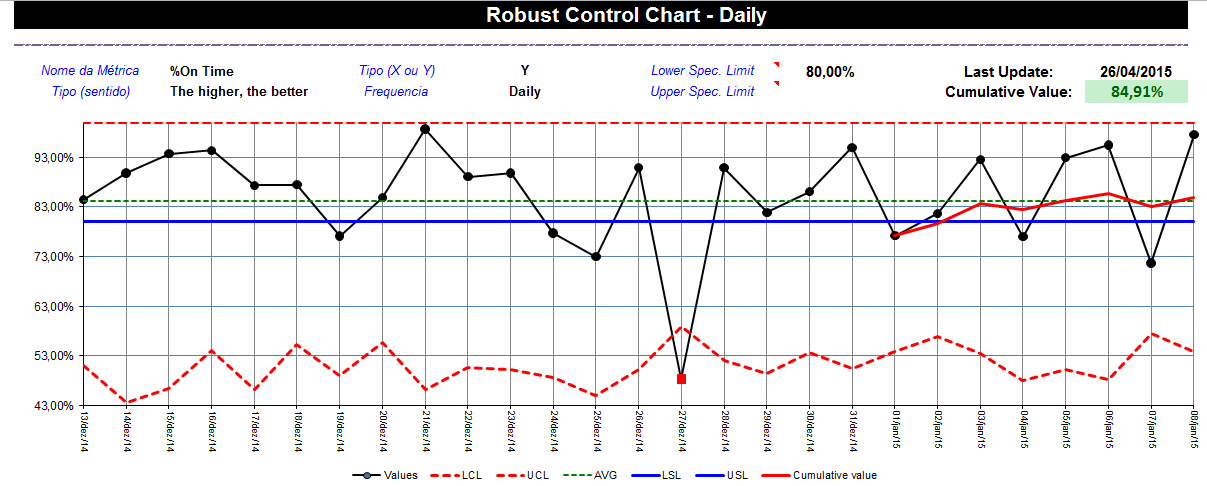

Figure 1
In the example, it is plotted
a P-Chart
because the data is discrete. The metric is the proportion between the
quantity of orders delivered on time and the total number of orders
delivered. The chart will plot the previous month and the current
month. The red doted lines are the control limits, the blue
line
is the specification limit (in this case there is only the lower
specification limit), the green line is the average, and the continuous
red line id the cumulative value of the metric until the current day of
the month. Considering the last entry refers to January, 08th, if it
was the last day of the month, the metric would close at 84.91%. It is
given also the stability and capability indexes, the risk of missing
the target by the end of the month (in this case it is 22%), the result
of the normality test, and finally, some notes and recommendations for
the user.
For
example, considering the current
cumulative value is 84% (higher than the specified: 80%), it is
necessary to have at least an overall performance of 77% from now to
the end of the month to ensure the metric will be closed within the
specified range by the end of the month.
The interface with the user
is presented in the next figure.
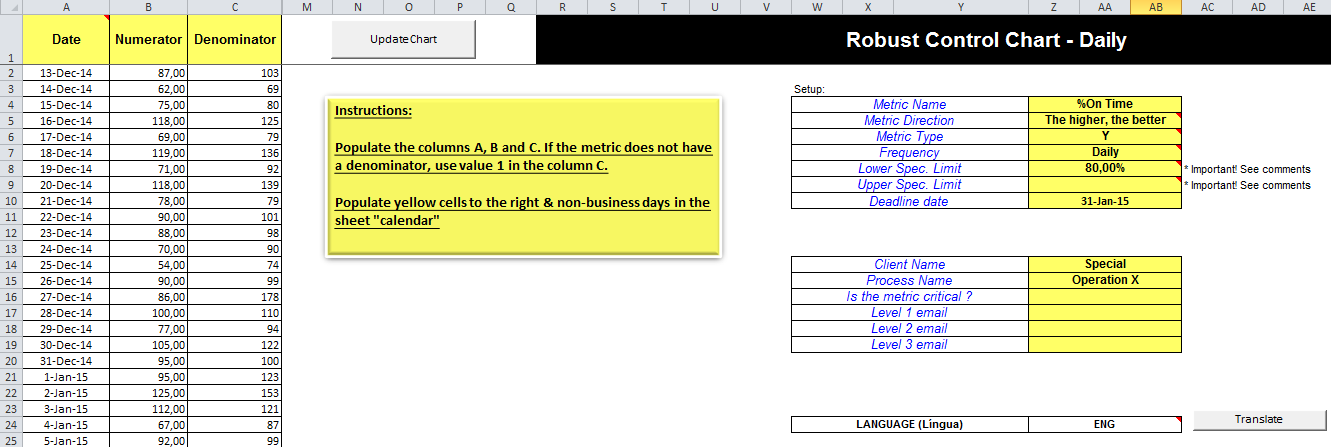
Figure
2
It is
only necessary to populate the yellow cells, so it is easy to use the tools with no
need of statistical software or advanced statistical knowledge.
You can buy the tool for
only US$ 2.50.
The file will be sent to you via email in 2 days. For
additional support, submit the form by this link.
|