|
||||
|
||||
Cleveland Wages Pages is a personal web site posted by Bill Callahan to share information and ideas about the "income issue" in Cleveland. The data presentation and opinions on this site are mine alone, unless otherwise attributed. Got something to say about all this? E-mail
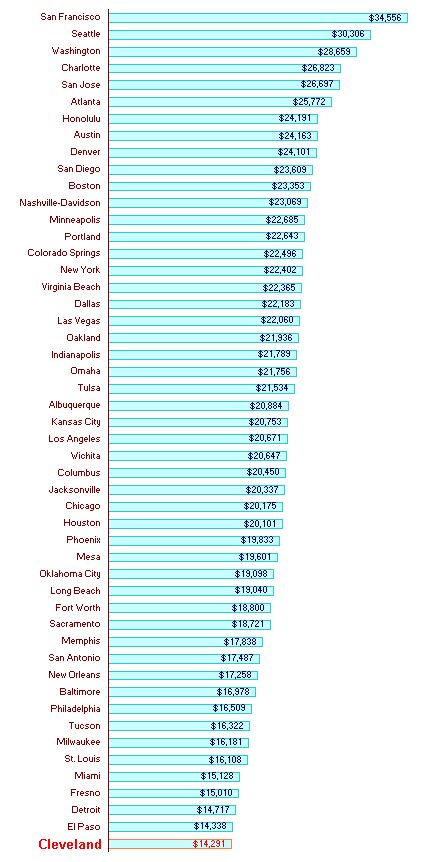
me at [email protected]. "It's the income, stupid!" Census highlights: Cleveland's
per capita income is last among 50 top U.S. cities (chart
on this page) Cleveland's median
household income is 49th among top 50 cities (chart) 20-year changes:
Cleveland's gain in per capita income is among smallest (chart) Other 20-year
comparisons... Ten comparable cities, Links on income and
poverty in Cleveland:
Are the State's jobless figures for Cleveland "phony"? Zeller explains...
|
September, 2002
Here's a headline
you haven't seen in the Plain Dealer: Cleveland is poorest of top 50 U.S. cities But it's true -- or at least it's what the new U.S. Census tells us. Look a little further down this page for the details, but here's the nub of it: The average personal income of all Cleveland residents in 1999 was the lowest among the nation's fifty largest municipalities. That makes us literally the poorest (to be precise, the lowest-income) big-city population in the nation. (MORE) After twenty years of "Cleveland's comeback", the results are in: It didn't work! By the only standard that really matters to most Cleveland residents -- our ability to make a living, support our families, get ahead economically -- the city of Cleveland is still right where we were twenty years ago... at the bottom of the national pile. Per capita income, 50 biggest U.S.
cities, 1999 The new income figures from the U.S. Census are unambiguous. Among the 50 biggest U.S. cities, Cleveland in 1999 was 50th in residents' per capita income, and 49th in median household income. Expanding the comparison group to include the sixty-seven biggest U.S. cities -- all those that had more than a quarter of a million residents in 1999 -- we find Cleveland was:
If we look at changes over the past twenty years, this picture does not improve. There were 57 U.S. cities above the quarter-million mark in the 1980 Census. At that time, Cleveland's per capita income of $5,770 was the fifth lowest (i.e. number 53 of 57). Cleveland's household median income of $12,277 was ninth lowest (number 49 of 57). How much has Cleveland's "comeback" improved our place in the standings? Compared to the same 57 cities:
With the 1979 figures converted to 1999 dollars, the census numbers show:
TEN-CITY COMPARISON... Here's a chart showing Cleveland's per capita income in 1979 and 1999 in comparison to nine other cities that started with similar income and poverty situations in 1979... And another chart showing how Cleveland stacked up against the same nine comparable cities in the 1999 earnings of a typical full-time, year-round worker. Why these cities? Explanation in this Word document. |