|
||
|
||
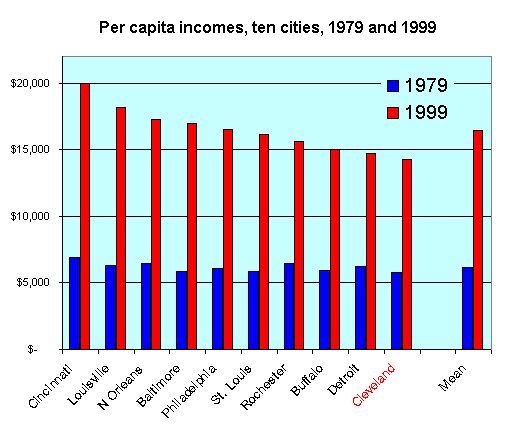
Here are Cleveland's 1979 and 1999 per capita incomes compared to nine other cities that started with similar income and poverty situations in 1979. All of the cities on the chart had 1979 poverty rates within 5% of Cleveland's, and 1979 family median incomes within a 10% range (plus or minus $1,599) of Cleveland's. In addition, all lost population in the last twenty years, and none are in regions of high growth (i.e. West Coast, Southwest or Southeast).
Details of this comparison can be found in this Word document and the accompanying Excel spreadsheet. |