|
|


 |
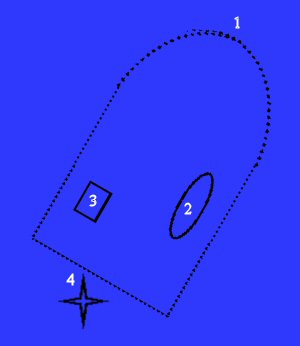
High Accuracy Mapping:Most divers never need a map showing anything more then maps which allow them to find a dive site - this type of mapping is covered in the mapping page. However, some divers need to accurately map an underwater site - for example map a ship wreck or underwater archeological site. This page covers two techniques which can be used to generate these types of maps. For both types of maps here we'll use the following example (figure 1): you are mapping an old steamship. The wooden parts of the ship have all rotted away, so all that remains are the metal components (boilers, screws, etc.). Your goal is to accurately map the location of the ships' remains.
Figure 1: Wreck site for examples. Dotted line = outline of ships hull. 1 = bow, 2 = boiler, 3 coal bins and 4 = screw. Index: GPS Mapping: Unfortunately this type of mapping inherently has large errors. These errors are due to wind and current moving the position of the buoy relative to the position of the object underwater. But there is a way around this. In order to do these corrections the diver must make a series of observations when he places the buoy. First he needs to measure the depth of the water at the site of the buoys anchor. As the buoy rises the diver must measure the length of line he lets out - this is easy to do if the buoy's anchor line is marked ever foot or so. Lastly, when the buoy reaches the surface the diver must measure the direction the line has moved with his compass. Making the correction is simply - by measuring the depth of the buoy's anchor and the length of anchor line let out the diver can calculate the deflection of the buoy off of the actual location. This is done by assuming these measurements will form a right-angle triangle (see figure 1). If we know the length of two sides of a right angle triangle we can calculate the length of the third size using the formula h^2=a^2 + b^2. The actual depth of the object being mapped a, and the length of line we let out is h. So to calculate the deflection we simply plug in our values into the following formula: d (deflection) = square root of (h^2 - a^2) So now we know how far off the buoy is from the true location of the item being mapped. And because the diver recorded the direction the buoy moved we know what direction the correction has been made in. Here's and example: A diver is mapping our wreck site, and is about to mark the location of the boiler. The diver attaches a marker to the boiler, and notes that the boiler is at 20m (67') depth. He releases the line and measures out 25m (83') of line before the buoy reaches the surface. He uses his compass to determine that the buoy has moved due north (0 degrees) of the boilers position. On the surface the person manning the GPS determines that the buoy is located 100m due north of their reference point. To determine the true location of the boiler the diver first calculates the deflection:
So we know that the buoy is actually 15m north of where the boiler is actually located. This correction can then be added to the map.
Figure 2: Correcting for deflection (d) caused by current/waves. a is the actual depth of the object being mapped (as measured by your depth gage), and h is the length of line you release to get the buoy to the surface.
Baseline Mapping:
Basic Concept:
Figure 3: Baseline (yellow) and 2 measures (green). Note that the baseline runs through 2 objects we wish to map.
What You Need: Many people use an anchor/float system as a baseline. The advantage of this system is that you can keep the baseline (rope or pipe) off of the bottom, and keep it all at the same depth - it is the only way to make a straight and level baseline on uneven terrain. The basis of this system is a series of floats attached by short lengths of rope to anchors. The anchors are placed along the baseline, and the floats attached with thin ropes to the anchors. The floats are attached so that they are all at the same depth, and the baseline attached to the floats. This will place your baseline above the bottom, and because of this it can be perfectly straight and level. Establishing a Baseline: One end of the base line will be your anchor - everything on your map will be measured relative to this point. Ideally you want this point to be relevant to your site - in our example shipwreck our anchor will be the ships anchor (attached to the bow). Next you need a terminus - the end of your baseline. This is just the other end of your baseline - in the case of our ship example we're going to use a point just past the screws. So our baseline will run from just in front of the ships anchor to just past the ships screw. Once you've determined where your anchor and terminus will be you must run your baseline. A baseline has to be nothing more then a rope, but ideally you want something rigid (a pipe), with distances marked at regular lengths along it. Place the baseline along the desired route and anchor it whenever possible. In theory you want this line to be perfectly straight and level - in reality your line probably won't be tooo straight, and nothing even close to level, but do your best. There you have it - your very own baseline!
Mapping Points:
Drawing the Map: The first step in drawing the map is to decide on a scale. Scale is how big something on the map is compared to something on land. For example, on a 1:1000 map 1cm on the map would equal 1000cm (10m) on the ground. The larger the scale the more accurate the map. For example a 1:5 map would be more accurate than a 1:1000 map, but if the same site was to be drawn at both scales the 1:5 map would be 200 times larger then the 1:1000. As such the main thing that determines the scale of your map is the size of your paper - the larger your paper the more accurate your map will be. The first step is to draw in the baseline. Pick a point on the paper to be the anchor of your baseline. Next, use your protractor to mark in the bearing of the baseline (for example if your baseline runs along a bearing of 325 degrees you will want to draw in your baseline on the paper at 325 degrees relative to the north-south lines on your page. Finally, draw in the baseline with your ruler - make sure that you draw the baseline the to scale. In the case of our example this will be a line 30cm long, on a bearing of 325 degrees Next we must convert the lengths we measured into scale-lengths. To convert the lengths we simply divide by the scale. In our case this is easy - since we're using a scale of 1cm = 1m we can simply convert in our head (i.e. 2.2m underwater = 2.2cm on our map). But for other scales you will have to divide by the scale of the map. You need to do this for both the distance along the baseline to where the measurement was made, as well as for the distance form the baseline to the object. Below is an spreadsheet for our example:
Table 1: Spreadsheet listing the objects we are mapping, the bearings to each object, the distance along the baseline, and form the baseline where the object lies, and finally the scale distances on our map. Finally, we plot our points. For each item on the map we will have three numbers - distance along the baseline to where we made our measurement, distance the object is away from the baseline, and the bearing from the baseline to the object. First you must determine where on the baseline you are measuring from. In the spreadsheet above we listed this info under the "Dist on Baseline (DOB)" column. In the "Scale (DOB)" column is the distance on our map. So the first step in plotting the boiler would be to place the center of our protractor on the baseline, 15cm away from the anchor. Next we use the protractor to measure a bearing of 92 degrees, and mark the bearing on the map. Finally we measure 6cm out form the baseline, along the bearing of 92 degrees. This is where the boiler is located on our map.
Figure 4: Animation of the three steps needed to map one point (in this case the boiler). a) Measure the distance along the baseline, from the anchor of the baseline to the point where you'll take the next measurement. b) Measure the distance from the baseline to the object. c) Measure the bearing to the object from the baseline.
Correcting for Depth:
So the boiler actually lies 5.65m away from our baseline, not the 6m we originally measured.
Figure 5: Correcting for distance (d) caused by having the baseline and object being mapped at different depths. h is the distance to the object measured by the divers, a is the difference in the depth between the object and the baseline.
|
This Page, and all other pages in the http://www.geocities.com/k_o_dionysus/ directory copyright (2004), Bryan Heit & the Knights of Dionysus