In this section the scheduling schemes given by the edge-colouring algorithms are applied in organising the communication for an irregular mesh based calculation. Simulations were done on 16 nodes of a Intel iPSC/860 parallel computer using the scheduling schemes to evaluate the practical effect of the edge-colouring algorithms.
On the Intel, there are two ways of sending and receiving messages. When the blocked send/receive subroutines csend/crecv are called, the program does not leave the calls until the sending/receiving action is completed. When the unblocked send/receive subroutines isend/irecv are called, the program immediately leaves with a message id, and carries on executing other parts of the code. A msgwait subroutine with the appropriate message id can be called at a later stage to make sure that the messages have been actually sent/received.
On an Intel iPSC/860, the communication time needed to csend/crecv a message is a linear function of the length. More specifically [6],
| (1) |
where ![]() is the communication time in microseconds,
is the communication time in microseconds, ![]() is the number of
bytes in the message. The discontinuity of the communication time
is due to the effect of buffering for messages longer than 100 bytes.
In the above model the effect of the distance between
processors and possible link contentions
are not included.
is the number of
bytes in the message. The discontinuity of the communication time
is due to the effect of buffering for messages longer than 100 bytes.
In the above model the effect of the distance between
processors and possible link contentions
are not included.
Given a scheduling scheme such as that of Table 5, generated by an edge-colouring algorithm,
the pseudo code for the synchronous pair-wise exchange type
communication scheme on any processor ![]() is
is
The cost given by a colouring scheme, such as those presented in Tables 4 and 5, are just predictions of the actual cost that the scheduling scheme might give. In order to see if these predictions have any significance in practice, simulations were carried out on the Intel i860 hypercube. Two meshes were considered and five partitioning algorithms [8] were used to partition each mesh into 16 subdomains. For each partitioning, three message passing schemes were generated using the three scheduling algorithms COLOUR, REDUCE and REDUCE10. The five partitioning algorithms used were: the recursive coordinate bisection (RCB), the recursive graph bisection (RGB), the recursive spectral bisection (RSB) (see, e.g. [13] for these three algorithms), the KL algorithm [11] and a hybrid algorithm of KL and RGB, called MINGRAPH [8].
For each shared face between two subdomains, it was assumed that 10 double precision numbers need to be exchanged. Thus for example, in Table 4, node 7 exchanges 30 double precision numbers with node 4 at stage 1, and 40 double precision numbers with node 13 at stage 2, etc. After each stage, a global synchronisation step was executed by calling the Intel i860 FORTRAN subroutine gsync(), so as to ensure that each node had finished sending and receiving data, before proceeding to the next stage. The message passing was repeated 1000 times, and the communication time was taken to be the elapsed time between the start and the finish of the message passing. In Table 7, the number of stages, the communication costs (predicted) and the actual communication time (in milliseconds, or ms for short) recorded in the simulation are reported. For the partitioning of the 788 mesh given by the recursive coordinate bisection (RCB), the algorithm COLOUR gave a message passing scheme with 7 stages and a predicted communication cost of 47 units. The actual communication time was about 8.4 seconds. This was reduced to about 7.0 seconds by using the algorithm REDUCE10. In general, Table 7 illustrates that the predicted costs reflect the trend of actual communication time very well, and that the predicted reductions of communication costs by the algorithms REDUCE and REDUCE10 were actually delivered in the measured communication time.
| Par. methods | Mesh | COLOUR | REDUCE | REDUCE10 |
| RCB | 788 | 7/47/8423 | 6/35/6958 | 6/31/6992 |
| RCB | 5520 | 7/842/45582 | 7/666/40006 | 7/521/35662 |
| RGB | 788 | 6/47/7580 | 5/34/6103 | 5/32/5975 |
| RGB | 5520 | 7/598/33528 | 7/511/30266 | 7/427/28418 |
| RSB | 788 | 5/36/6286 | 5/26/6052 | 5/25/5634 |
| RSB | 5520 | 5/385/22200 | 4/216/14778 | 4/216/15010 |
| KL | 788 | 10/52/10935 | 9/36/9424 | 9/36/9366 |
| KL | 5520 | 6/326/20345 | 6/263/19170 | 6/256/18471 |
| MINGRAPH | 788 | 6/40/7230 | 6/29/6838 | 6/28/6505 |
| MINGRAPH | 5520 | 4/209/14136 | 3/189/13582 | 3/189/13020 |
It is also interesting to compare the communication time given by various partitioning algorithms. The recursive coordinate bisection algorithm (RCB) on the 5520 mesh needed at least 35 seconds, almost 3 times greater than the best communication time given by the MINGRAPH algorithm. The partitioning algorithm KL performed badly on the 788 mesh, mainly because the algorithm generated disconnected subdomains which bordered a greater number of neighbouring subdomains. This increased the number of stages for the communication, therefore the start-up and synchronisation costs.
It is interesting to relate the communication time in Table 7
to formula (1). The synchronisation costs
for one call of the synchronisation routine gsync() on a 16 node configuration of the Intel
was found to be about 530 microseconds. Assuming no link
contentions, the communication time (ms) for executing ![]() stages of synchronous pair-wise exchange
1000 times was
stages of synchronous pair-wise exchange
1000 times was
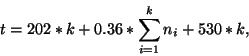 |
(2) |
For large meshes, the start-up and synchronisation costs were less dominant.
For example on the partition of the mesh-5520
using RSB, the message passing algorithm COLOUR gave a scheme of 5 stages,
with a sum of largest message lengths of 385.
This gives a calculated ![]() ms. The message passing algorithm REDUCE10 gave
a scheduling scheme of 4 stages with a sum of largest message lengths of 216,
and a calculated
ms. The message passing algorithm REDUCE10 gave
a scheduling scheme of 4 stages with a sum of largest message lengths of 216,
and a calculated ![]() ms. Again
the two calculated timings are proportional to, but under-estimate
the actual
communication time (which are 22200 ms and 15010 ms respectively,
from Table 7).
Between
ms. Again
the two calculated timings are proportional to, but under-estimate
the actual
communication time (which are 22200 ms and 15010 ms respectively,
from Table 7).
Between ![]() of the time was spent in the start-up and synchronisation.
of the time was spent in the start-up and synchronisation.