
|
Stability calculation
|
Previous Top Next |
|
Forces
|
X
|
Y
| |
|
Fd
|
Self weight (dead load) of wall
|
xd
|
yd
|
|
Fds1
|
Self weight of soil above ground water table
|
xds1
|
yds1
|
|
Fds2
|
Self weight of soil below ground water table
|
xds2
|
yds2
|
|
Fsx, Fsy
|
Horizontal and vertical soil pressures
|
xs
|
ys
|
|
Fw1
|
Ground water pressure
|
|
yw1
|
|
Fw2
|
Free water pressure
|
|
yw2
|
|
Fde
|
Seismic load of wall
|
|
yd
|
|
Fdse1
|
Seismic load of soil above ground water table
|
|
yds1
|
|
Fdse2
|
Seismic load of soil below ground water table
|
|
yds2
|
|
Fsex, Fsey
|
Horizontal and vertical seismic soil pressures
|
xse
|
yse
|
|
Fwe
|
Free standing water seismic pressure
|
|
ywe
|
|
Fax, Fay
|
Horizontal and vertical additional loads
|
xa
|
ya
|
|
Vertical force
|
Horizontal force
|
Moment
| ||
|
V
|
x
|
H
|
y
|
Mo
|
|
Fd
|
xd
|
|
|
Fdxd
|
|
Fds1
|
xds1
|
|
|
Fds1xds1
|
|
Fds2
|
xds2
|
|
|
Fds2xds2
|
|
Fsy
|
xs
|
|
|
Fsyxs
|
|
|
|
Fsx
|
ys
|
Fsyys
|
|
|
|
Fw1
|
yw1
|
Fw1yw1
|
|
|
|
Fw2
|
yw2
|
Fw2yw2
|
|
|
|
Fde
|
yd
|
Fdeyd
|
|
|
|
Fdse1
|
yds1
|
Fdse1yds1
|
|
|
|
Fdse2
|
yds2
|
Fdse2yds2
|
|
Fsey
|
xse
|
|
|
Fseyxse
|
|
|
|
Fsex
|
yse
|
Fsexyse
|
|
|
|
Fwe
|
ywe
|
Fweywe
|
|
Fay
|
xa
|
|
|
Fayxa
|
|
|
|
Fax
|
ya
|
|
|
SV
|
|
SH
|
|
SM
|
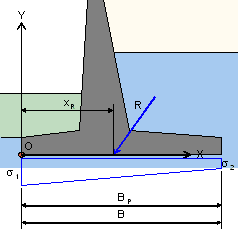
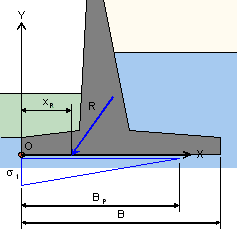
|
Case
|
BP
|
s1
|
s2
|
|
B/3 < xR < 2B/3
|
B
|
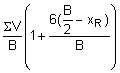 |
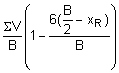 |
|
0 < xR < B/3
|
3xR
|
 |
0
|
|
2B/3 < xR < B
|
3(B-xR)
|
0
|
 |
|
xR < 0, xR
> B
|
N/A
|
N/A
|
N/A
|


|
Load condition
|
Annual probability
|
Return period
|
|
Usual
|
Greater or equal to 0.10
|
Less than or equal to 10 years
|
|
Unusual
|
Less than 0.10 but greater than or
equal to 0.0033
|
Greater than 10 years but less than or
equal to 300 years
|
|
Extreme
|
Less than 0.0033
|
Greater than 300 years
|
|
Site information category
|
Usual
|
Unusual
|
Extreme
|
|
Well defined
|
1.4
|
1.2
|
1.1
|
|
Ordinary
|
1.5
|
1.3
|
1.1
|
|
Limited
|
3.0
|
2.6
|
2.2
|
|
Site information category
|
Usual
|
Unusual
|
Extreme
|
|
Well defined
|
1.7
|
1.3
|
1.1
|
|
Ordinary
|
2.0
|
1.5*
|
1.1*
|
|
Limited**
|
-
|
-
|
-
|