Various flow visualizations
This page shows some of the dye patterns obtained during the experiments. To see the classification obtained from the complete range of experiments conducted, click here.
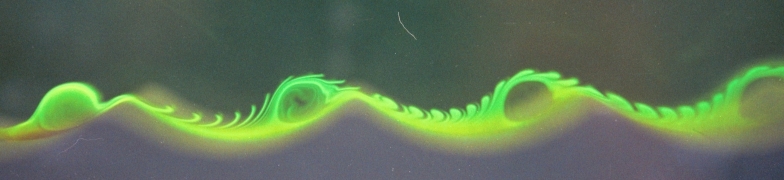
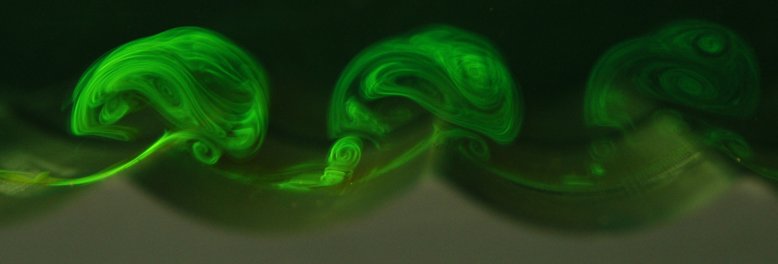
Examples of side views
Ripple slope s = 0.175; wave orbital amplitude to ripple wavelength ratio r = 0.23; wave period T = 3.13s.
Ripple slope s = 0.175; wave orbital amplitude to ripple wavelength ratio r = 0.26; wave period T = 1.43 s.
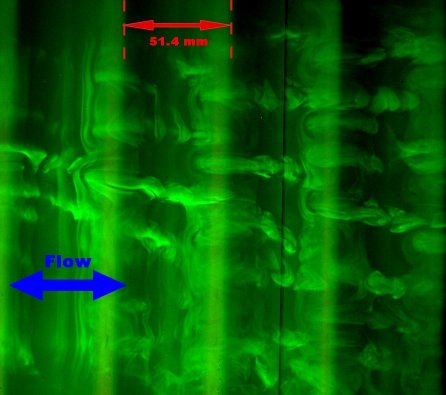
Example of a top view
Ripple slope s = 0.175; wave orbital amplitude to ripple wavelength ratio r = 0.39; wave period T = 3.13s.
>>> Go to the flow classification derived from the flow visualizations <<<