Life
Insurance & Mortality Table
A mortality table
is essentially a record, based on past experience, that
shows the number of persons living at successive ages out
of an original group of given size. For convenience, the
original group is usually taken as 100 000 or 1 000 000
at age one. The table also includes information other than
the number of persons living at successive ages.
One of the widely
used mortality used at the present time is the Commissioner
1941 Standard Ordinary Mortality table (usually referred
to as the CSO table).
If we denote by
Ix the number of persons from the original group who live
to attain the age x, then the table shows that I5 = 983
817, I50 = 810 900 etc. Clearly the numbers that die in
any year can be obtained as the difference living at consecutive
ages. Thus
I10-I11=971804-969890=1914
persons died between
the ages of ten and eleven. If we denote by dx the number
of persons in the original group that attain age x but die
before reaching age x+1, then clearly
dx=Ix-Ix+1
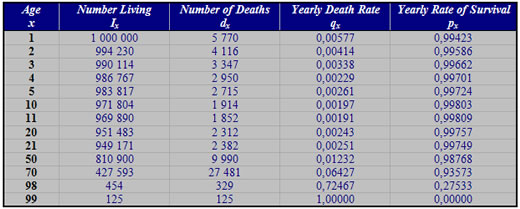
Thus d50
= 9 900 means that 9 900 persons out of the original 1 000
000 died during their fiftieth year of life. Since Ix
persons attain age x and Ix+1 of these also reach
age x+1, the probability
Px=
Ix+1 / Ix
is
called the probability of survival for persons of age x.
Likewise, since dx persons die between the ages
x and x+1, the probability
Qx=
dz/Ix
is
called the rate of mortality, or death probability, for
persons of age x. The mortality tables is the foundation
of life insurance and life annuities and is therefore of
fundamental importance. It should be clear that a mortality
table based on a given group will not agree exactly with
another table based on a different group. For example, wide
differences are found in the rate of mortality according
to race, sex, occupation, standard of living and various
other factors. Consequently, there are numerous mortality
tables in actual use, and many of these revised from time
to time as medical science progress and general health conditions
improve, thus increasing the span of life. Most life insurance
companies use at least two mortality tables: one for life
insurance and a different one for life annuities. For if
people die more rapidly than predicted by the mortality
table, the company pays out faster on insurance policies
and life annuities.
The
fundamental principle that makes life insurance and life
annuities sound is that persons of a given class do tend
to die with approximately the same regularity as indicated
by a mortality table made up of such group.
Example:
The graduating class of a university contained 500 students
aged twenty-one. According to the CSO table, how many of
these will be alive to celebrate their fiftieth reunion
of their class?
Solution: The question is, essentially,
how many of these 500 students will live to attain the age
of seventy-one. The CSO table gives I21 =949 171 and I71
=427 593. Consequently the expected number is
500x(I71/I21)=500x(427593/949171)=225