Study and Validation of a Model
of Fetoplacental Circulation
2.2. Protocollo di prova con sangue
Test Protocol with Blood 
|
|
Date le caratteristiche della placenta ed i problemi connessi abbiamo lavorato
allo studio di un protocollo di prova che fosse il meno traumatico possibile per l'organo.
Si è deciso di utilizzare prevalentemente placente provenienti da
parti effettuati con taglio cesareo, con gravidanze non patologiche.
Le placente prelevate con questa tecnica risultano utilizzabili per le prove in misura del 40% circa.
Sono state utilizzate 61 placente, di cui 53 provenienti da parto cesareo.
Durante le fasi di sperimentazione è stata considerata fondamentale
l'esigenza di garantire la riproducibilità di tutte le prove effettuate.
Il protocollo di prova sviluppato prevede la possibilità di
compiere esperimenti ulteriori ed è realizzabile in laboratorio da un gruppo di tre persone.
2.2. Test Protocol with Blood 
|
|
We used 61 healthy placentas, 53 of them obtained by cesarean birth at term, after physiologic
pregnancy: thanks to this surgical technique about 40% of placentas
were not heavily damaged, and could be used for this type of experiments.
During the experimentation, the reproducibility of each phase has always
been taken in consideration.
The developed protocol allows to perform such experiments and eventually further analysis by
a group of 3 people.
2.2.1. Instrumentation .
|
|
The level control unit of the reservoir manage the input of blood through the valve (27).
It can work in manual mode, by closing (26) and using (23) if the alarm signal is ringing.
The extravascular transducer we used is a subset of the system normally used for
clinical analysis, shown in figure 30: as we use blood with heparin, a perfusion system
of the catheters with heparin is not necessary..
The presence of the cannulas creates a difference of pressure between
the vessels and the measured position.
Fig.30: Circuito extravascolare.
Extravascular circuit.
The instrument must be zeroed following 2 different procedures for the 2 channels:
- Venous signal: the measure must be zeroed at atmospheric pressure, i.e.
when (10) is open with null blood flow in the catheter;
the transducer must be at the same level of the placenta.
The pressure loss due to the venous cannula will be measured
at the end of the experiment and subtracted from the measured value.
- Arterial signal: the above method cannot be used, for the high pressure
(overloading the instrument) generated by the resistance of the arterial
cannulas, as shown in the following diagram.
Fig. 31: Theoretic pressure loss in the arterial cannulas
versus m.
The real diagram are depending, other than by the viscosity
m
and by the flow, by the arterial pressure too, for the elasticity
of the cannulas. As the geometry of the cannulas is quite variable
(they are manufactured without particular control on the accuracy of the inner diameter) we
we were not able to define an accurate
DP, we measured this value at the end of each experiment.
It must be subtracted from the value read by the instrument. Moreover the instrument does not allow
the zeroing if the measured pressure is higher than 80 mmHg.
For these reasons the transducer has been put in higher position,
90 cm over the level of the placenta, and the zeroing, not definitive,
has been done with a reference flow of 100 cc/min.
To use properly the instrument, catheters and transducers must not
contain air bolls, otherwise the dynamic characteristics are compromised, as shown below.
 Fig.32: Model of the transducer.
 Fig.33: Model of the transducer with air in the catheter.
Both the transfer functions have 2 complex poles, but the second circuit has a lower bandwidth.
Without air fcut is about 80 Hz for the transducer, so the response
is almost flat up to about 50 Hz, but air bolls reduce fcut to 20 Hz, jeopardizing the signal.
Fig.34: Transfer function of the transducer.
2.2.2. Fluid for Perfusion
|
|
As fetal or human blood is not easily available in the required quantity,
we used bovine blood, supplied by Ultrocchi Carni S.p.A. located in S. Stefano
Ticino (MI), Italy.
Soon after the sampling, during the slaughtering, we used to add heparin (5000 U.I., 1cc/liter
of blood).
The following tables compare the type of blood we used with
fetal blood.
| Erythrocytes |
Leukocytes |
Platelets |
Hemoglobin |
Haematocrit |
| 1012 / l |
109 / l |
109 / l |
g/100ml |
% |
| 6.5±1.5 |
7±3 |
500±300 |
11.5±2.5 |
31±9 |
Tab.2: Data about adult bovines.
To minimize the difference between fetal and bovine blood, we analyzed
its properties at each working session, measuring the haematocrit and
the viscosity.
|
Weeks
|
n
|
Erythrocytes
1012/l
|
Leukocytes
109/l
|
Platelets
109/l
|
Hemoglobin
g/100ml
|
Hematocrit
%
|
|
18
|
6
|
2.44± 0.46 |
4.3± 2.8 |
204± 44 |
11.1± 1.8 |
34.1± 9.8 |
|
19
|
17
|
2.71± 0.57 |
3.9± 2.4 |
266± 87 |
11.6± 1.9 |
36.4± 9.3 |
|
20
|
52
|
2.77± 0.51 |
4.3± 2.8 |
244± 66 |
11.7± 1.6 |
36.9± 7.3 |
|
21
|
85
|
2.89± 0.58 |
4.2± 1.9 |
254± 102 |
12.2± 2.4 |
37.8± 9.1 |
|
22
|
115
|
2.98± 0.43 |
4.2± 1.6 |
260± 109 |
12.4± 1.6 |
34.4± 6.8 |
|
23
|
105
|
3.02± 0.52 |
4.2± 2.5 |
261± 93 |
12.3± 1.8 |
38.1±8.3 |
|
24
|
51
|
3.17± 0.45 |
4.3± 1.2 |
275± 88 |
12.6± 1.7 |
39.1± 6.2 |
|
25
|
52
|
3.31± 0.53 |
4.3± 1.2 |
263± 91 |
13.1± 1.7 |
40.3± 7.5 |
|
26
|
26
|
3.35± 0.68 |
4.4± 1.5 |
269± 98 |
12.9± 2.4 |
40.5± 7.8 |
|
27
|
25
|
3.43± 0.53 |
4.3± 1.6 |
268± 81 |
13.2± 1.9 |
41± 6.9 |
|
28
|
n=17
|
3.60± 0.55 |
4.6± 2.1 |
290± 86 |
13.4± 2.9 |
41.6± 8.1 |
|
29
|
n=10
|
3.66± 0.51 |
4.8± 1.4 |
264± 144 |
13.6± 1.8 |
43.2± 8.6 |
Tab.3: Data about normal fetuses.
Available data about the blood viscosity are conflicting and not helpful:
the authors used different methods whose results cannot be compared, not only for
fetal blood, but even in the case of maternal blood.

Fig.35: Capillary viscometer.
The main results obtained in the last 70 years on pregnant women
are listed in table 4. The values of the first column were obtained by
Cohen e Thomson through calculations based on the hematocrit, the second
and the third column were obtained by Hamilton and Buchan, who
used a Ostwald viscometer and a spinning viscometer [40].
In table 5 data about normal fetuses are compared with values of pregnant / not
pregnant women (by Buchan [40]).
Tab.4: Viscosity during pregnancy
Compared with a woman, the fetal
hematocrit is higher, and its erythrocytes are less deformable.
The 2 effects give a higher viscosity of the whole blood.
Anyway, if analyzed with a normalized value of hematocrit,
the fetal blood viscosity is rather low,
due to the low concentration of fibrinogen and of the others
blood proteins.
The values are also dependant from the gestational age. The following table is the only published study.
[40]:
| |
Pregnant woman
|
Adult woman
|
Fetus
|
|
Blood visc. cP
|
9,8
|
12,7
|
16,8
|
|
Hematocrit
|
37,3
|
44,7
|
49,2
|
|
Visc. of plasma cP
|
2,25
|
1,75
|
1,46
|
|
Fibrinogen g/l
|
4,32
|
2,8
|
1,76
|
|
Deformablity erythrocytes
|
1,13
|
0,81
|
0,72
|
Tab.5: Blood rheologic data:
adult woman,
pregnant woman and fetus (40th week).
Data obtained by Buchan using a spinning viscometer.
|
Gestational age
|
34 - 35
|
36 - 37
|
38 - 39
|
40 - 41
|
42 +
|
| Hematocrit |
0,421
|
0,459
|
0,488
|
0,512
|
0,564
|
|
0,032
|
0,031
|
0,033
|
0,32
|
0,037
|
| Deformablity erythrocytes |
0,65
|
0,69
|
0,72
|
0,72
|
0,64
|
|
0,11
|
0,08
|
0,09
|
0,09
|
0,11
|
| Viscosity plasma cP |
1,24
|
1,38
|
1,43
|
1,46
|
1,69
|
|
0,25
|
0,29
|
0,26
|
0,33
|
0,35
|
| Viscosity blood cP |
12,5
|
14,6
|
15,5
|
16,8
|
19,7
|
|
1,8
|
2,1
|
2,3
|
2,3
|
3,5
|
Tab.6: Changes of the fetal blood during pregnancy.
A spinning viscometer was offered by
Giuseppe Cambiaghi S.p.A. in Rho (MI, Italy), but it has not been used
because requiring at least 50 cm3 of blood, probably too much
for a newborn. For the same reason we did not want to repeat these measurements
with our capillary viscometer.
As our method was comparable to the one used by
Cohen and Thomson, we used to dilute the bovine blood
if the measured viscosity was greater than 4,5 cP, up to this value.
To reduce the differences between fetal and bovine blood we considered
also the pH value: it affects the metabolism and the oxygen saturation curve.
As the pH value is related to PCO2, its measurement must be performed
when PCO2 is 40 mmHg.
 Fig.36: Hematocrit of the bovine blood.
The pH of blood, if required, can be modified
adding sodium bicarbonate according to the formula:
Fig.36: Hematocrit of the bovine blood.
The pH of blood, if required, can be modified
adding sodium bicarbonate according to the formula: 
considering that B.E. is the value obtained by the hemo-gas-analyzer about
the excess bases in millimoles per liter, and Vp is the priming volume
of the circuit (1820 cc. in our case).

Fig.37: Placenta at UV rays after perfusion with blood and fluorescent yellow coloring agent.
During some of the sessions we added few
mg of uranin (fluorescent yellow coloring agent) to the bovine blood, in order to mark
leakages and quality of the perfusion by UV rays (365 nm, 4 W). The above picture evidences
that the perfusion reached all the districts of the placenta.
2.2.3. Preparation of the Circuit .
|
|
We named preparation all the preliminary steps
needed to set the whole perfusion system before the connection
to a placenta. For some steps the sequence must be strictly respected.
The accuracy of this description is due to the willingness to make the experiment
exactly reproducible by other researchers.
The list of the phases to be executed does not describe extensively each step, as they are typical
of the model/brand of the used instruments or belong to the common know-how of the operators.
- Set all the connections shown in figure 23;
- Set the proper gas flows with the flowmeters, verifying that the pressures at their inputs are equal;
- Apply the level control and the protective net to the
pool, and fill it with physiologic solution (adding 1cc heparin 5000 UI/liter);
- Connect the heat exchanger of the oxygenator to the pool;
- Switch on the pump (24) and the thermostat, set to 39.0°C;
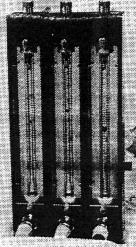 Fig.38: The 3 flowmeters.
- Verify that (11), (13), (21), (22),
(7), (8), (9), (10) are closed, and the shunt (14) is open;
- Fill the circuit: close (16), (15), (23), open (17) and (26),
switch on the level control and the pump (20), at the highest rate, checking
that no leakage occurs;
- Connect the air chambers;
- Discharge the tubing for the connection to the cannulas from air opening
their clamps;
- Discharge the pressure transducers and their catheters from air introducing
physiologic solution (with heparin) through (7) and (9);
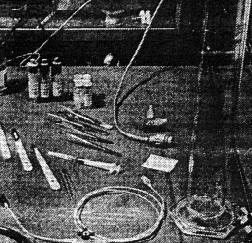
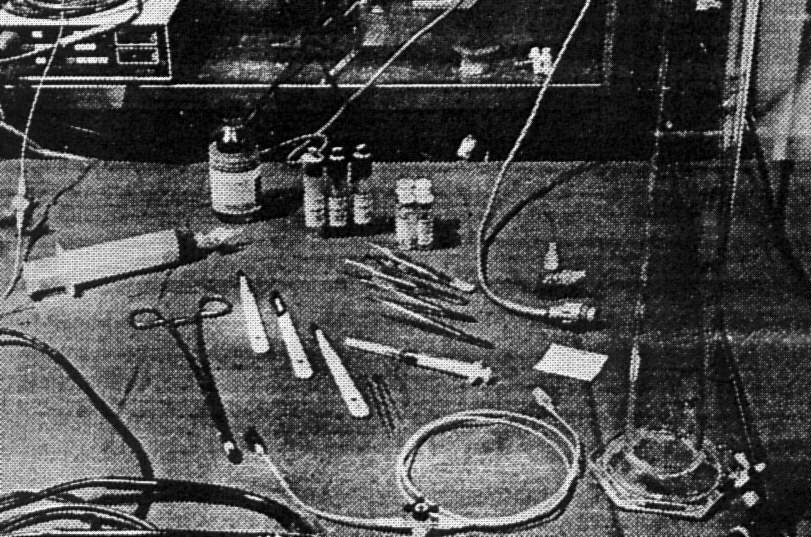
Fig.39: A pressure transducer
and some other instruments.
- Set the pump, the instrument for the measurement of the blood pressure and the scope;
- Wait for all the values to get stable: in particular verify
the partial pressures of oxygen and carbon dioxide, and the pH value.
The preliminary setup can be done in about 40 minutes.
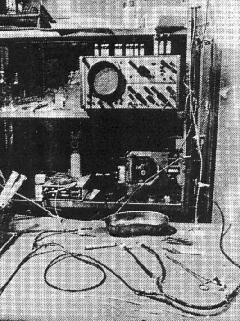
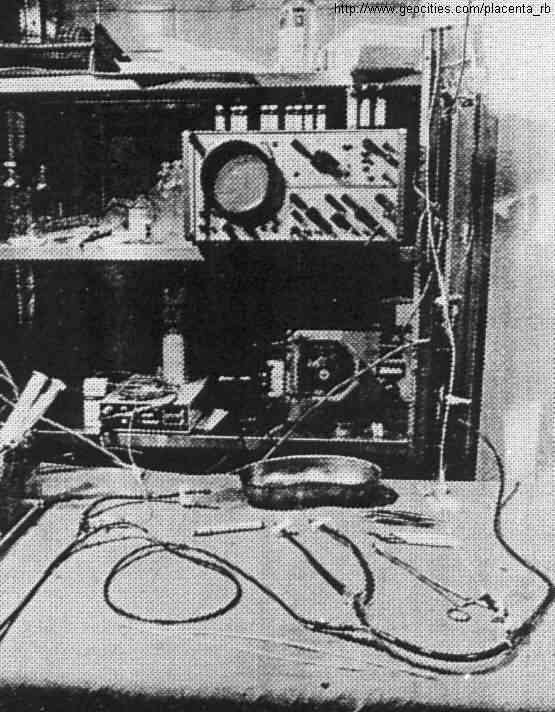
Fig.40: The circuit ready to be connected
to the placenta, working with the shunt (near the venous and arterial connections).
2.2.4. Preparation of the Placenta .
|
|
The main problem during these phases of the experimentation was
the timing: soon after the withdrawal, the placental vessels tend to collapse; the arteries,
in particular, show bulges of blood caused by spasms.
The placenta is carried to the laboratory in a bucket
with 2 litres of physiologic solution and heparin at 39°C.
The umbilical cord is cut at 5-8 cm from the placenta.
The vein and the arteries are easily distinguished,
for their different diameters, and because usually there is blood
coming out from the vein, while the arteries appear empty.
Beginning from the vein, the cannula,
during its insertion up to the origin of the cord, must be followed with
fingers from outside, to adapt it to the tortuousness of the
vessel. Blood coming out from the cannula indicates its correct
positioning inside the vessel. The tip of the cannula must not touch the vessel wall at
the first bifurcation as in this way the flow is stopped. For this reason
the cannula must be retracted (few mm) after the complete insertion, also fixing it with cyanoacrilate.
In order to facilitate the sliding of the cannulas into the vessels we tried
specific products (Silkospray by Willy Rusch AG and Luan by Molteni Farmaceutici), with fair
results; the best result was obtained just wetting
the cannula with warm blood diluted with physiologic solution and heparin.
To insert the cannulas into the arteries we followed a similar procedure,
but it was more difficult for the usual spasm of the vessels.
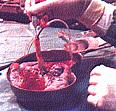
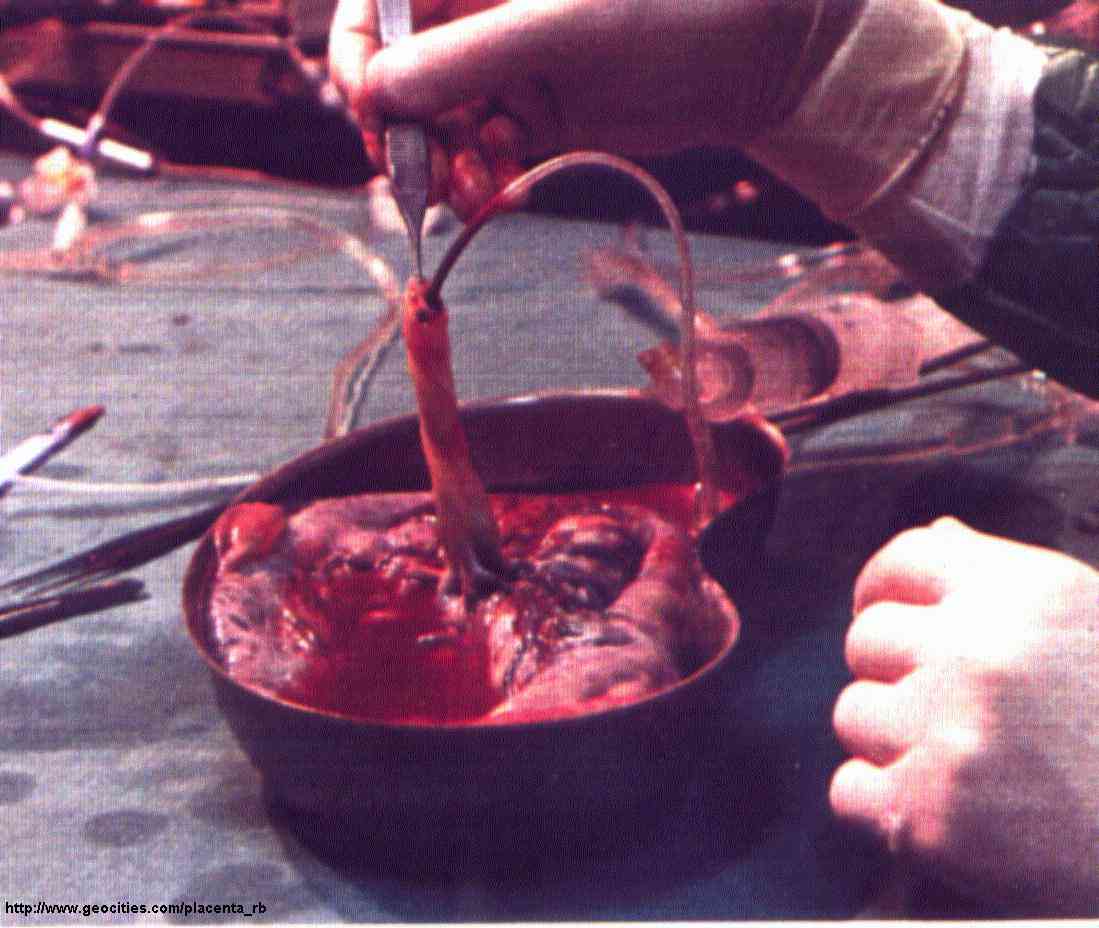
Fig.41: A placenta after the insertion of the venous cannula (click to enlarge).
During this step air should never be introduced. The arterial cannulas
must be previously filled with physiologic solution using
2 syringes, that are kept connected during the insertion into the umbilical cord.
A light force on the syringe pistons allows to verify that the
solution flows into the chorionic arteries, evidencing the correct insertion of the
cannulas. This force must be low: to create a pressure as high as 100 mmHg,
only 2.67 N (it is the force due to the gravity for an object
weighting 272 grams) are enough:
piston surface = 2 cm2
F = 200 mm2 *1,333 * 10-2 N * mm-2 = 2,67 N.
At the end, the cannulas can be fixed with 2 clamping strips.
About 10 cc of physiologic solution with heparin should be injected into each artery
to divide the fetal blood inside the placenta
from the bovine blood that is to be introduced by the perfusion circuit.
Doing so, some blood should come out from the venous cannula, but in lower
quantity, for the general constriction due to the absence of blood pressure after the
withdrawal.
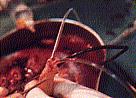
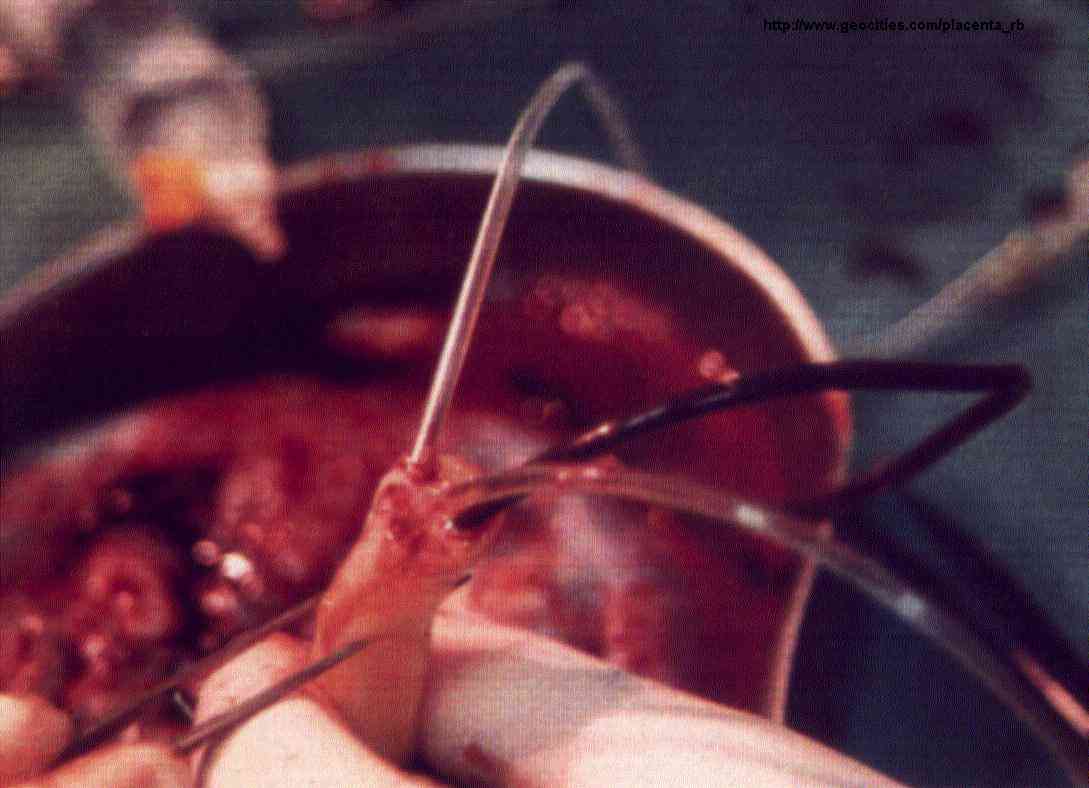
Fig.42: The umbilical cord with its cannulas. The venous blood is evident (click to enlarge).
Some authors [38] noticed
a seepage of water through the membrane dividing
the fetal and the maternal circulation (this fact happened also
during our experiments): this membrane, to allow the
exchange of substances, is permeable to molecules with low molecular weight.
With a seepage of few cc/minute we did not notice
fluorescent colouring agents with molecular weight higher than
5000 crossing the membrane.
All the mentioned steps must be completed in less than 10 minutes.
2.2.5. Connection to the Perfusion Circuit .
|
|
The placenta is immersed into the pool and its umbilical cord is fixed
with suture thread, as shown in figure 43.
The arterial cannulas are connected to the luer connectors (12)
(fig 23) and the clamps (13) are opened.
In order to take blood into the placenta, the shunt must be closed
(14).
The max. arterial pressure is to be continuously controlled:
its estimated value at the end of the cannulas (in the umbilical arteries)
must never be greater than 120-150 mmHg.
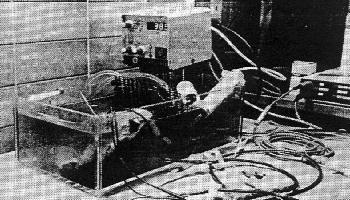
Fig.43: A placenta being perfused.
If the pressure is too high, the vessels can break, as evidenced by
blood flowing into pool or under the chorionic membrane. If the mentioned level is exceeded,
The blood flow has to be reduced, also recalculating
the pressure losses due to the cannulas.
The placenta, just released, is generally vasoconstricted. The vasoconstriction decreases
slowly during the perfusion with blood characterized by high PCO2; for
this reason, at the beginning of the perfusion, the physiologic flow rate
has to be reached gradually.
None of the researchers that made experiments of
in-vitro perfusion has ever been able to obtain a physiologic
pressure with input flow greater than 120 cc/minute:
see table 7 for the values available in the literature [38]:
| |
Q cc/min |
P mmHg |
| Gagel |
120 |
120 |
| Kranz |
78~ 120 |
110 |
| Nesbitt |
60~ 90 |
|
| Vermeulen |
90~ 200 |
90~ 250 |
Tab.7: Flow rates and pressure obtained by other researchers.
Before connecting the venous cannula to (11) the fetal blood that is inside the placenta
must be discharged waiting few minutes, during which the flow of the venous output can be measured.
The air chambers are activated opening (21) and (22) and trimming
the resistances (5) and (6) when the needed flow is reached:
measurements can be done only after that the levels of the chambers is stable.
If the flow has to be increased for any reason, the pressures have to be monitored
with (21) and (22) closed: otherwise the air chambers introduce strong
delays, making the trimming of the pump velocity difficult.
2.2.6. Data Measurement .
|
|
The measurements can be done when all the variables under test
are stable, or anyway varying within ±5%, at least for 30 seconds.
The data acquisition can be done until an abnormal situation
(causing the measurements being no longer reliable)
takes place. The main reasons are a vessel break and
a sudden rise of the max. arterial pressure. This last cause
(pressure even rising from 100 mmHg to 250 mmHg in less than 1 minute) looks often
due to abnormal partial pressure of the gases.
- Measurement of the pressures:
At the end of the experiment the umbilical cord is cut at its origin, after stopping
the pump and disabling the air chambers, then the pump is restarted (at
the rates used during the data collection) and the
values of max. pressure before the arterial cannulas are acquired,
to do the needed adjustments: the obtained values must be
subtracted from the data shown by the instrument during the perfusion at the correspondent
flow rates.
- Measurement of the leakage:
As already verified by other researchers in Nederland
[38], we noticed that
the placental membranes are semi-permeable: part of the perfusion liquid is lost,
also if there are not vessel breaks. In order to define if
the experiment is valid we had to make
a comparison between real leakages of blood and the physiologic seepage.
In particular the intact membranes are not permeable
to the corpuscular part of blood.
Thus the measurement of the total liquids lost during the perfusion
can be performed directly checking the level of blood
in the reservoir of the oxygenator. In order to
distinguish the 2 values we have to calculate
the volume of the lost corpuscular part only. A good evaluation about
this value can be obtained measuring, at the beginning and at
the end of the experiment, the blood hematocrit and its total
volume, including the priming volume of the circuit and the estimated volume
of blood inside the placenta. The real leakage of blood has been considered
as the ratio between the volume of lost corpuscular part
and the logarithmic averaged hematocrit computed between the starting
and final situation. The priming volume of the circuit is 320
cc, the placenta contains about 100 cc of blood.
Apparent total leakage: DV = Vi-Vf
Leakage of corpuscular part: DVc = Hti*Vi-Htf*Vf
Real leakage of blood: DVs = DVc/Htm
Seepage: DVt = DV-DVs
Tables with data obtained during our experiments are listed in Ch 2.5 of this thesis.
best viewed with  res. 800 x 600.
Last updated: August 2, 2003


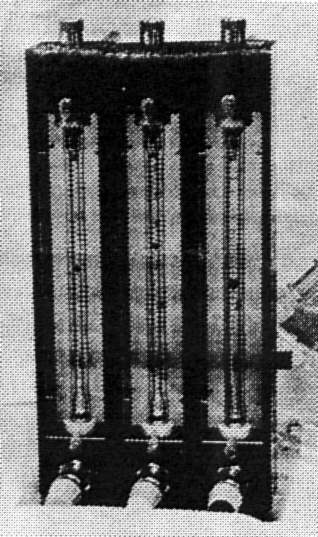 Fig.38: The 3 flowmeters.