Study and Validation of a Model
of Fetoplacental Circulation
1.3. Metodi di analisi
Methods of Analysis 
|
|
Le caratteristiche del flusso ematico nella placenta, sia nel versante
materno che in quello fetale, sono state
descritte grazie all'introduzione delle tecniche ad ultrasuoni.
Sono stati inoltre quantificati il flusso in aorta fetale
e nella porzione intra-addominale della vena ombelicale.
Da allora sono stati pubblicati molti lavori sulla stima quantitativa del
flusso sanguigno del feto in gravidanze normali e patologiche. Comunque
misurazioni del flusso in vasi che pulsano sono soggette a vari problemi,
possono risultare di scarso valore clinico per le imprecisioni
della misurazione, che portano ad un errore potenziale del 50% per le arterie ombelicali.
Allo scopo di superare i problemi menzionati č stata introdotta
l'analisi spettrale, assieme allo sviluppo di indici opportuni per l'estrazione
di informazione dal segnale di velocitā.
Le tecniche cui si č accennato rivestono attualmente una notevole
importanza in campo diagnostico, e il presente lavoro fa spesso riferimento
a dati ottenuti grazie alla loro applicazione.
1.3. Methods of Analysis 
|
|
The characteristics of the placental blood flow, both
on the maternal side (Griffin, 1983) and on the fetal side (Stuart, 1980),
have been studied thanks to ultrasound techniques.
Also the flow in the fetal aorta (Eik-Nes, 1980) and in the intra-abdominal
portion of the umbilical vein (Gill, 1979) have been evaluated. Anyway,
flow measurements in vessels with pulsations are troublesome. The insonation
angle must be known and the diameter of the vessel must be measured [12].
Moreover a huge variability of the individual parameters has been noticed
[33]. Measurements of the fetal blood flows
have low clinical importance due to their inaccuracy, that produces possible
errors reaching 35% for the flow measurements in the aorta, and up to 50%
for the umbilical arteries [12][34].
The spectral analysis, and several indexes used to get information
by the obtained waveforms, have been introduced in order to cope with the
mentioned problems. These indexes are independent from the insonation angle,
but the gained information is only qualitative.
Other parameter, useful also to determine values used by our model,
have been obtained thanks to the electronic microscope, briefly described
at the end of this chapter.
1.3.1. Pulsed Doppler 
|
|
The necessity to examine phenomena that take place
in relatively deep layers, without having disturbs from blood flowing in
close districts, carried to the development of equipment that can explore
the Doppler phenomenon in a volume of reduced dimensions and at any depths
by the examiner.
The same transducer is used for the transmission and the reception
during successive time intervals. The depth of exploration is obtained
inserting a delay of 13 milliseconds for every centimeter of depth to the
reception of the reflected wave. The higher number of trains of wave are
emitted and received in the time unit, the higher fidelity is obtained
(frequency of repetition PRF).
According to the Shannon theorem on the sampling, the highest Doppler
shift that can be used for the sampling of a curve of speed without low-frequency
aliases is one half of the repetition frequency. A limit of speed is therefore
present, beyond that the speed curve would be altered by aliases. The detection
of such aliases is quite important to avoid the attribution of clinical
meaning to distorted curves.
The variation of frequency of a train of ultrasounds reflected by the
erythrocytes is in the field of the audible frequencies. The Doppler equipment
restores an acoustic signal that has different characteristics of frequency,
intensities and timbre in case of laminar flow, of turbulent flow, of noises
of wall or valvular borders.
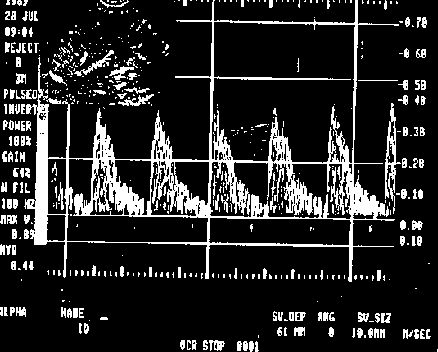
The equipment allows to draw real-time spectral representations of
the frequencies (FFT: fast Fourier transform). Such technique allows to
quantify all the frequencies of the signal and to visualize them on a monitor:
the gray-scale represents the amplitude of the signal, that corresponds
to the number of blood cells flowing at a particular speed. The line of
maximum frequency of the wave (envelope) is used to calculate the indexes,
that are supposed to contain information on dynamics of the fetoplacentar
circulation. Figure 21 explains the explained concepts.

Fig.21: Sonogramma Doppler di aorta discendente fetale.
Doppler diagram of fetal descendent aorta.
A laminar flow, with parabolic profile of the speeds, shows frequencies
uniformly distributed from 0 to the maximum frequency, filling the area
subtended by the wave. There is an accumulation of the frequencies towards
the maximum value when the speeds of the fluid threads turn out equalized,
like in the aortic arc, during systole.
Moreover the equipment gives a computerized analysis of the spectrum:
it calculates the instantaneous values of the maximum and medium frequency
(weighed in intensity) and draws a curve of average speed, named analogic
curve of flow.
1.3.2. Duplex Scanner 
|
|
Although the pulsed Doppler equipment allows to select
the desired depth, it is practically impossible to intercept deep vessels
and to select the area of control without concurrent images.
The duplex scanner merges a B-scan real-Time to a monoprobe transducer
that can be placed independently : the B-scan generates ecografic images
in real time exploring one section by contiguous lines with the measurement
of the time of reflection of an ultrasound beam.
Therefore this instrument supplies an image that represents a section
of the body, with a resolution that reaches 2 mm.
On the same screen the direction of the Doppler beam is shown, and the
sampled volume is marked by a bright section.
The diagrams that are commented in the chapter on the results of the
model have been obtained at the San Paolo hospital. They are an example
on the usefulness of this diagnostic technique.
1.3.3. Signal Elaboration 
|
|
The literature concerning the waveforms of the flow (FVW)
often make reference to some adimensional indexes, originally introduced
in order to obtain indications on the vascular resistances of several districts
in the adult. It was demonstrated that there is a correlation between such
indexes and some common pathologies of the fetus [12][34].
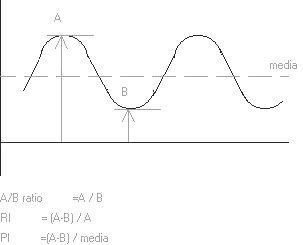
The three more recurrent indexes are:
- A/B ratio (A/B ratio in the English literature, S/D ratio in the
American literature), defined as ratio between the peak of systolic flow
A and the flow of end diastole B;
- resistance index RI, defined as difference between systolic peak
A and flow of end diastole B divided by the systolic peak. Campbell and
others [35] observed a good correlation between
a high RI value in the fetal aorta and pathological pregnancies;
- pulsatility index PI, defined as difference between systolic peak
and flow of end diastole divided by the mean flow. A correlation between
low PI values in the umbilical arteries and fetuses with IUGR has been
experienced, also weeks or months before that the pathology started to
be evident [34].
It is important to remark that the 3 defined indexes are bases on empirical
observations rather than on the theoretical definitions [36].

Fig.22: Tre indici di misura qualitativa del flusso di
sangue nelle arterie ombelicali.
Three indexes of qualitative measure of the blood flow
in the umbilical arteries. 'media' = mean value.
1.3.4. Electronic Microscope  . .
|
|
Also trying to correct the aberration of the lenses, the magnification of an
optical microscope cannot be increased indefinitely for
the diffraction. The image given by the microscope
has a finite diameter, the smaller,
the lower ratio between wavelength and lens dimension.
Calling a the min. distance between 2 points to be seen distinguished,
it can be demonstrated that a is function of the wavelength l,
of the refraction index n of the material between object and objective,
and of the max. angle a between a light ray
coming from the object towards the objective and the optical axis
of the objective itself, according to the formula [37]:
 For this limited resolution, a magnification greater than
2500x does not allow to improve the results.
In order to increase the resolution we can follow 3 ways:
* to reduce l, e.g. with deep UV light;
* to increase a, with higher complexity
of the lenses to reduce the aberration;
* to increase n, e.g. with lenses immersed in oil.
The electronic microscope follows the first way.
The discovery that the electrons behave as radiation with
very short wavelength suggested the possibility to use
electron beams to increase the resolution.
In 1939, with this solution, Kausch and Ruska managed to shot the first picture
of a virus.
Basically an electronic microscope works as a normal microscope but,
as the optical lenses do not modify the electron beam,
magnetic or electrostatic lenses are used. This instrument is composed by
an electron source and a system of accelerating and focusing grids, supplied
by high voltage generators (>80kV). In this condition l
can be 5 to 10 pm, in the range of X rays.
Magnifications higher than 100000x can be obtained, with resolution of few nm.
The electron beam crosses through the object and the deflections, reaching a fluorescent
screen, or other visualisation systems.
The passage of the electron beam needs also a vacuum chamber.
For the high energy of the electrons living organisms cannot be observed.
Moreover the obtained view is not an optical image, for the spectrums of absorption
and reflection (at X rays the parameters are different that at white light).
best viewed with  res. 800 x 600.
Last updated: July 5, 2008: Medical banner exchange removed.

