HOME
Figures
more figures
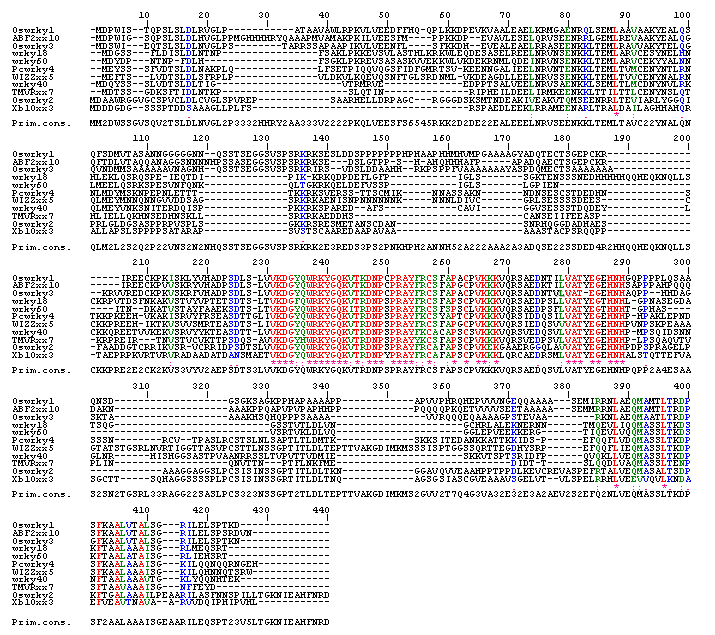
Sequence analysis of group IIa members reveals that members are homologous to each other. The color red indicates complete conservation of sequence, and blue/green represents high conservation.