Elasticity Along a
Linear Demand Curve
Consider the graph we looked at earlier. A causal glance would
indicate that the severity of the slope will determine elasticity.
This would be a mistaken assumption. Actually the elasticity of a
linear curve changes from place to place. The slope of the line is
no indication of elasticity, although they are related. Recall from
chapter two the formula for determining the slope of a line:
(Y2 - Y1)
(X2 - X1).
In terms of price and quantity this would be
(P2 - P1)
(Q2 - Q1)
Now recall the arc formula for elasticity:
(Q2 - Q1) * (P2 + P1)
(P2 - P1) (Q2 + Q1)
We can divide this formula into two parts (at the multiplication
sign). The left hand side of the equation is the reciprocal of the
slope formula. Indicating that the slope and the price elasticity
of demand have an inverse relationship. Since the first part is the
inverse of the slope the value of the first part does not change anywhere
on the linear demand curve.
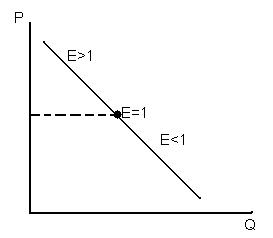
The right hand side of the equation shows a ratio of the sum of two prices to the sum of two quantities. As the sum of the prices and quantities change so does the value of the second part of the equation. If the sum of the two prices is large relative to the sum of the two quantities the ratio will be large. This occurs at the highest points on the demand curve. If the sum of the two prices is small relative to the sum of the two quantities then the elasticity will be small. This occurs at the lowest points on the demand curve. This tells us that the slope of a line and the price elasticity of demand are not the same.
Look at the graph to see how elasticity varies along a linear demand curve.
Elasticity Along a
Linear Demand Curve
![]()
![]()