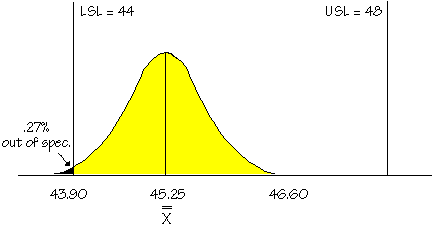
Capability Analysis: How is it made?Step 6 Analysing the resultsWhen this analysis is completed, the calculations should be combined with the drawing. This provides an easy-to-read, one-page graphic report of the system's capability.
This system is slightly incapable, producing .27% outside of specification. The Cp value is 1.48 and the Cpk is .93. The Cp value indicates that if the system were centered on the target value, it would be capable because the Cp is greater than 1. The Cpk value of .93 suggests that the system is not centered (this can also be seen from the sketch). This system could be improved immediately by shifting the center to the right, toward the center of the specifications. A Cpk value equal to 1 indicates the system is capable of producing at least 99.73% of output within specification limits. Capability is often spoken of in terms of sigma or standard deviation. For instance, if a system is said to have 3 sigma capability, this means that 99.73% of the data is located within the specification limits and that the limits are three standard deviations away from the grand average. Three sigma capability represents Cp and Cpk indices of 1, thus 3 sigma capability is the minimum requirement a system should have. If a system is said to have 4 sigma capability, it means that 99.99% of the data is located within the specification limits and measures 4 times sigma hat on each side of the average. (These percentages come from the Standard Normal Distribution Table and are the same for all normal distributions.) In other words, the more capable a system is, the more of its standard deviations can fit between the lower and upper specification limits. This implies that as a system is improved by reducing the variation between each part of output, the standard deviation becomes smaller. Thus more standard deviations can fit between the specification limits. � Previous�����������
How is it made Menu � |