![]()
![]()
![]()
PRAC #5
STATISTICAL
FUNCTIONS
These
functions are also found on your calculator. A class set of results for
assignments or exams provide a good exercise.
The
assessment for your course is as follows
|
Event |
Weight |
|
Student
Project |
25% |
|
Half
Yearly |
24% |
|
Yearly |
16% |
|
Trial |
10% |
|
Spreadsheet
Prac |
5% |
|
Database
Prac |
5% |
|
Graphics
Prac |
5% |
|
Desktop
Prac |
5% |
|
Communication
Prac |
5% |
Assume there
are 20 students in this course.
Design
a spreadsheet that will calculate the total mark for each student, average,
minimum and maximum mark for each event and average, minimum and maximum total
marks.
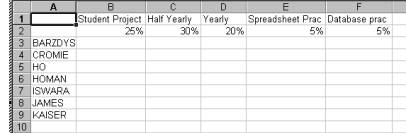
Assume
that all marks will be given as a percentage. This means that if a student's
marks are
|
Event |
Mark
% |
|
Student
Project |
80 |
|
Half
Yearly |
75 |
|
Yearly |
85 |
|
Trial |
79 |
|
Spreadsheet
Prac |
90 |
|
Database
Prac |
83 |
|
Graphics
Prac |
50 |
|
Desktop
Prac |
62 |
|
Communication
Prac |
55 |
Total
mark will be
80x0.25 + 75x0.30 + 85x0.20 + 90x0.05 + 83x0.05 + 50x0.05 +
62x0.05 + 55x0.05 = 76.5
![]()
![]()
![]()